Abstract
Understanding the interactions of adsorbed fibronectin (Fn) with other biomolecules is important for many biomedical applications. Fn is found in almost all body fluids, in the extracellular matrix, and plays a fundamental role in many biological processes. This study found that the structure (conformation, orientation) and reactivity of Fn adsorbed onto mica is dependent on the Fn surface concentration. Atomic force microscopy and x-ray photoelectron spectroscopy were used to determine the surface coverage of adsorbed Fn from isolated molecules at low surface coverage to full monolayers at high surface coverage. Both methods showed that the thickness of Fn film continued to increase after the mica surface was completely covered, consistent with Fn adsorbed in a more upright conformation at the highest surface-Fn concentrations. Time-of-flight secondary ion mass spectrometry showed that relative intensities of both sulfur-containing (cystine, methionine) and hydrophobic (glycine, leucine/isoleucine) amino acids varied with changing Fn surface coverage, indicating that the conformation of adsorbed Fn depended on surface coverage. Single-molecule force spectroscopy with collagen-related peptides immobilized onto the atomic force microscope tip showed that the specific interaction force between the peptide and Fn increases with increasing Fn surface coverage.
INTRODUCTION
Fibronectin (Fn) is a large dimeric glycoprotein found in both plasma and the extracellular matrix; plasma Fn is primarily produced by hepatocytes, whereas cellular Fn is produced in epithelial cells, fibroblasts, and macrophages. Understanding the structure and reactivity of Fn on surfaces is fundamental to discerning its role in processes such as cell-cell interactions, wound repair, inflammation, coagulation, and oncogenesis (1). Fn plays a key role in cell signaling through integrin (2) and other nonintegrin cell-surface receptors, cell differentiation, and migration, and it is a frequent target for bacterial adhesion (3).
The monomer units of Fn are joined at the C-terminus of the protein in an antiparallel fashion by disulfide bonds (4,5). Each monomer is made up of three modules (Fn types I, II, and III) and a variable region. Fn module types I and II have interchain disulfide bonds, whereas type III does not. The variable region is in the middle of each monomer. Cellular Fn is different from plasma Fn in that it has an extra unit called A (6). In its soluble form, Fn is globular, with a radius of ∼20 nm (5,7), whereas in the adsorbed state it can take on a number of different conformations ranging from globular to elongated and cross-linked (5,8,9), based on the surface properties of the substrate.
The binding sites on Fn responsible for its biological activities are distributed along the length of the molecule. The common anchoring point for various bacterial receptors and the collagen receptor are located toward the N-terminus of the molecule (10), whereas the Arg-Gly-Asp (RGD) site is more centrally located (10). The surface reactivity of Fn is dependent upon how Fn presents these sites when adsorbed on a surface. Thus, understanding the conformation and reactivity of adsorbed fibronectin is crucial to understanding many biological processes. Previous studies have used biological methods (i.e., monoclonal antibody binding) to investigate the structure of adsorbed Fn (11,12). This study represents, to our knowledge, the first combination of atomic force microscopy (AFM), x-ray photoelectron spectroscopy (XPS), and time-of-flight secondary ion mass spectrometry (ToF-SIMS) to analyze the conformation and reactivity of adsorbed Fn.
As a first step in understanding the biological properties of adsorbed Fn, we undertook a study of the structural and reactivity changes of Fn adsorbed to a nonbiological substrate (mica) as a function of surface coverage. ToF-SIMS is used to probe conformation differences of adsorbed Fn at different surface concentrations, whereas AFM and XPS are used to estimate the amount of adsorbed Fn on the surface. Surface reactivity is probed with AFM force spectroscopy.
EXPERIMENTAL
Atomic force microscopy
The AFM used in this study is a PicoScan (Molecular Imaging, Phoenix, AZ) instrument. Protein imaging was performed using the magnetic AC (MAC) mode (13). Imaging in air and liquid was carried out with type II MAC tips from Molecular Imaging. Force experiments were carried out with NP-S tips (Veeco, Santa Barbara, CA) with spring constants in the range 0.06–0.52 N/m. Force curves were carried out at a rate of 1 Hz with a force trigger of 0.25 V and a total travel distance of 1 μm. For each force experiment, between 500 and 5000 force curves were acquired. The tip location was controlled by a script written to raster the tip over the sample area. All force curves were taken under phosphate-buffered saline solution (PBS, Fisher Scientific, Fair Lawn, NJ). Surface coverage was calculated by first flattening the image, thresholding via the maximum entropy method, then performing a particle analysis. Fn film thickness was determined by first scraping away the adsorbed Fn from a 1.5 × 1.5 μm area with a high force applied to the AFM tip and imaging the bare and Fn-covered mica surface with low force applied to the AFM tip. The height difference between the two regions was then calculated from the AFM image.
Force curve analysis
Jump heights were extracted from the force curves by filtering them to exaggerate vertical segments with a filter proposed by Kasas (−2, −5, −8, −10, 0, 5, 20) (14). Once the peaks were found, 11 points to the left and right of the peak were fit with a second-degree polynomial. The difference between the endpoints of the polynomials was taken as the jump height. This method was proposed by Baumgartner et al. (15). The analysis routine for this procedure was written in Java as a plugin for ImageJ.
X-ray photoelectron spectroscopy
The XPS measurements were performed on an S-Probe spectrometer (Surface Science Instruments, Mountain View, CA) equipped with monochromatic Al Kα source (hν = 1486.6 eV), hemispherical analyzer, and multichannel detector. The binding-energy scale was referenced by setting the hydrocarbon C1s binding energy to 285.0 eV. Elemental compositions were determined from spectra acquired at a pass energy of 150 eV. High-resolution spectra were obtained using an analyzer pass energy of 50 eV. Further details of the XPS experiments are published elsewhere (16).
Time-of-flight secondary ion mass spectrometry
A Physical Electronics instrument (7200, PHI, Eden Prairie, MN) was used for ToF-SIMS data acquisition. The instrument has an 8 KeV Cs+ ion source, a reflectron time-of-flight mass analyzer, chevron-type multichannel plates, and a time-to-digital converter. Data were acquired over a mass range from m/z = 0–500 for both positive and negative secondary ions. The area of analysis for each spectrum was 100 × 100 μm. The total ion dose used to acquire each spectrum was <2 × 10¹² ions/cm2. The ion beam was moved to a new spot on the sample for each spectrum with a total of three spots per sample. The mass resolution (m/Δm) of the secondary ion peaks was typically between 5000 and 6000. At least three samples were analyzed for each step in the modification process. The mass scale for the positive ion spectra was calibrated using the  and
and  peaks and the mass scale for the negative ion spectra was calibrated using the CH−, OH−, and C2H− peaks. The differences between the expected and observed masses for both positive and negative ions after calibration were <10 ppm.
A complete discussion of principle component analysis (PCA) on protein films was published by Wagner and Castner (17), and the peak set and analysis method used in this study are the same as described by those authors. Using this peak set, PCA was used to determine which amino acids varied as the surface concentration of adsorbed Fn changed. PCA analysis was done on a mean-centered data set. The analysis was done with MATLAB (The MathWorks, Natick, MA), using scripts developed in-house for PCA.
Protein adsorption
Human plasma fibronectin (Invitrogen, Grand Island, NY) was adsorbed onto freshly cleaved mica (Ted Pella, Redding, CA) from solution concentrations ranging from 1 to 100 μg/ml in PBS solution. Adsorption time was varied between 1 and 10 min, depending on the surface coverage desired. After the desired adsorption time was reached, the liquid cell was rinsed with 20 times its volume of PBS to remove the protein solution. For samples imaged in air, the dilution displacement technique was used to extract the substrate, after which it was immediately dried in a stream of nitrogen (AirGas, Radnor, PA). All force spectroscopy experiments on adsorbed Fn were carried out under PBS in the AFM liquid cell.
Functionalization of AFM probes and silicon nitride chips
Silicon nitride was deposited onto silicon wafers at the Washington Technology Center using a low-pressure chemical-vapor deposition method. Four-inch silicon wafers (Silicon Valley Microelectronics, San Jose, CA) to be coated with silicon nitride were cleaned with HF, KOH, or plasma etching. The deposition gases used were ammonia and dichlorosilane. The deposition was performed in a horizontal hot-walled quartz furnace with a pressure range of 300–250 mtorr and tilt from mouth to source of 20–30°. The wafer was then diced into 1 × 1-cm pieces and the pieces were then soaked in water for 2 days, with frequent changing of the water to remove any impurities introduced from the dicing process. Silicon nitride blanks (1 × 1 cm) were treated in parallel with the NP-S AFM tips. Both the blanks and the NP-S tips were cleaned with piranha solution, 70:30 H2SO4 (EMD, San Diego, CA)/H2O2 (J. T. Baker, Phillipsburg, NJ) (caution: piranha solution reacts violently with organics). Piranha cleaning lasted 3 h. After this cleaning, the tips and blanks were rinsed with copious amounts of 18 MΩ water to remove excess acid. Subsequently, the tips and blanks were initially dried in a stream of nitrogen, then baked dry on a hot plate immediately before the next step.
Esterfication of the AFM tips was carried out by condensing ethanolamine HCl (Sigma, Milwaukee, WI) with the silanol groups on the silicon nitride surface. This procedure was first proposed by Hinterdorfer et al. (18). First, all of the glassware used for esterfication along with molecular sieves (Fisher Scientific) was baked dry. Then, the ethanolamine HCl was dissolved in dimethylsulfoxide (J. T. Baker) at a 30% (w/w) solution containing molecular sieves. Once the ethanolamine HCl was dissolved and the molecular sieves stopped off gassing, the tips and blanks were introduced. The reaction was allowed to proceed overnight. After esterfication, the tips and blanks were rinsed in fresh dimethylsulfoxide followed by chloroform (J. T. Baker).
Next, the substrates were incubated for 4 h in a solution of 1 mg/ml of pyridyldithio poly(ethylene glycol) succinimidylpropionate (NHS-PEG-PDP) (Polypure, Oslo, Norway) in chloroform with 1% (v/v) triethylamine (Sigma) as a catalyst. This step binds the NHS group of the PEG chain to the primary amines on the surface. Next, the substrates were incubated in a peptide solution for 4 h. The peptide sequence used was CTLQPVYEYMVGV. The terminal cystine on the collagen peptide binds to the PDP end of the PEG chain via disulfide exchange.
RESULTS AND DISCUSSION
XPS and AFM of Fn films
The beginning of the adsorption process is governed by  (19), where the amount of adsorbed protein (q%N, defined as the percentage of nitrogen in the film measured by XPS) varies linearly with solution concentration (C0) under the assumption that all molecules that hit the surface stick. However, protein adsorption is a complicated process governed by ionic effects, hydrophilic/hydrophobic interactions, and entropic effects. Due to these interactions, the structure of adsorbed proteins can be different from their solution and crystal structures. Previous imaging studies of single molecules of Fn with AFM demonstrated that Fn exhibits a number of different conformations when adsorbed onto hydrophilic substrates at low concentrations, but predominately exists in an extended state (20). When adsorbed at higher concentrations, the morphology of the adsorbed Fn is dependent on the solution concentration of Fn and the adsorption time (21).
We first determined the surface coverage of adsorbed Fn as a function of solution concentration. We used two complementary techniques, AFM and XPS, to determine surface coverage. XPS is a surface analytical technique that can determine the atomic composition and chemical environment of the outermost 2–10 nm of a surface (22), and can accurately determine the surface coverage (22). AFM can be used to create topographical maps of the adsorbed Fn, thus allowing calculation of surface coverage, as well as providing information about conformation. Together both methods can be used to determine the amount of Fn adsorbed from increasing coating concentrations and to investigate coverage-dependent changes in Fn conformation.
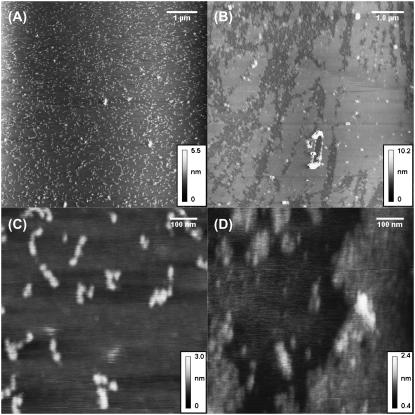
Fig. 1 shows MAC mode AFM images of Fn adsorbed onto mica at coverages of q0.6% and q3.0%. Surface coverage of Fn was controlled by keeping the adsorption time constant while varying the solution concentration of Fn. At low concentrations, single molecules dominate the landscape, whereas at higher concentrations, the formation and growth of islands is observed. The shape of Fn molecules at low surface coverage is that of three beads lying close together, whereas at higher concentrations, a smooth film is formed.
FIGURE 1.
MAC mode AFM images of Fn at q0.6% (A and C) and q3.0% (B and D). Adsorption was done in PBS. At the lower concentration, single molecules are clearly visible, whereas at the high concentration, there are islands of Fn.
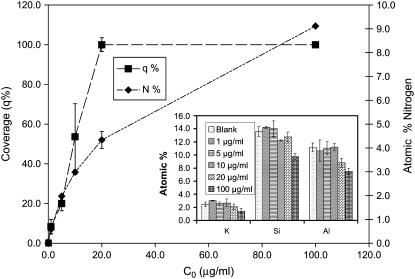
Fig. 2 compares Fn surface coverage as measured by AFM and XPS. As expected, for solution concentrations up to 10 μg/ml, AFM demonstrated a rapid increase in surface coverage, plateauing for solution concentrations at >10 μg/ml. XPS results from the adsorbed Fn films confirmed that the amount of nitrogen increases with increasing solution concentration up to 10 μg/ml, in agreement with AFM results. At concentrations >10 μg/ml, AFM results indicate that the surface is completely covered with Fn. In contrast, XPS indicates that Fn is still being deposited onto the mica surface as the solution concentration increases. The decrease in the XPS intensities of the substrate elements (Si, Al, and K) with increasing solution concentration, along with the increase in XPS nitrogen intensity from the adsorbed Fn, shows that the Fn film increases in thickness with increasing solution concentration. Although AFM shows that a full Fn monolayer is formed at both q4.3% and q9.1%, the increase in thickness from the q4.3% to the q9.1% Fn films, as measured by AFM, was 3.7 Å. The combined XPS and AFM results for the Fn films formed from the 20- and 100-μg/ml solutions (q4.3% and q9.1%, respectively) indicate that there is a change in Fn conformation or orientation (i.e., to a more upright or end-on configuration) at the higher solution concentration.
FIGURE 2.
AFM (▪) and XPS (♦) data showing surface concentration of Fn films adsorbed from different solution concentrations. Surface coverage by AFM shows that the surface is covered at a solution concentration of 20 μg/ml, whereas the XPS data show that the nitrogen concentration is still increasing at that coverage.
ToF-SIMS of Fn films
The above findings demonstrate that a monolayer of Fn forms before the surface is saturated, suggesting that structural rearrangements of the molecule to accommodate more Fn in the film are occurring for adsorption from high solution concentrations. Structural rearrangements can lead to different binding sites exposed at the outer surface of the Fn film. ToF-SIMS is a surface analytical technique capable of detecting adsorbed proteins at concentrations as low as ∼1 ng/cm2 with a depth of 1–2 nm (23). Since the sampling depth of ToF-SIMS is less than the dimensions of Fn, only the outermost amino acids of adsorbed Fn will be detected by ToF-SIMS (24). By examining changes in the amino acid peaks at different surface concentrations, structural changes in the molecule can be tracked (25). PCA is a linear modeling technique used to extract differences in ToF-SIMS data based on relative changes in peak intensities between samples, and shows which peaks are responsible for these changes. We hypothesized that if the structural rearrangements (conformation, orientation, etc.) occur as the surface Fn concentration is changing, these rearrangements should result in changes in the ToF-SIMS peak intensities. To test this hypothesis, ToF-SIMS data was acquired at various surface concentrations of adsorbed Fn and PCA was performed on the data to determine whether any structural changes could be detected.
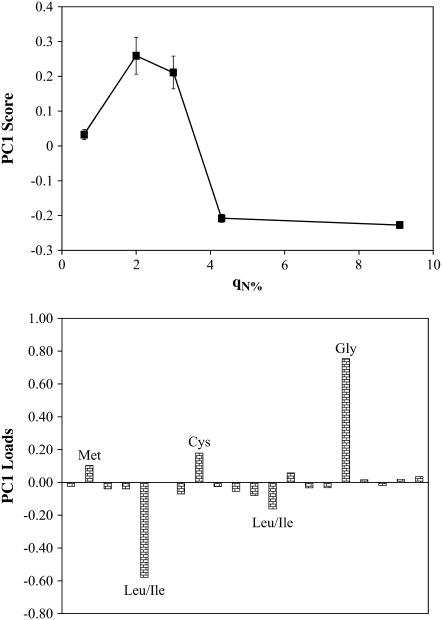
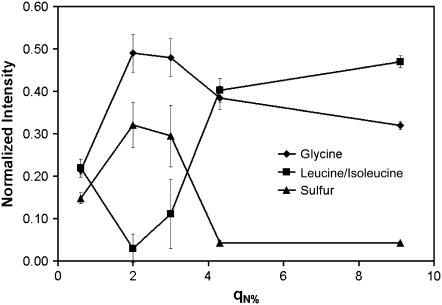
PCA was performed using mean-centered data, which highlights variation in the data, with more weight given to peaks with larger variations over peaks with higher mean intensity. Fig. 3 shows the principle component 1 scores and loads for the mean-centered data. The scores plot shows that there are differences between samples with low (q0.6%), intermediate (q2.0% and q3.0%), and high (q4.3% and q9.1%) surface concentrations of adsorbed Fn. The loads plot shows that glycine, leucine/isoleucine, methionine, and cystine are the amino acids most responsible for these differences. Fig. 4 shows the normalized intensities for these amino acids as a function of the film nitrogen concentration.
FIGURE 3.
Principle component 1 score and loads for Fn films at different surface concentrations. Hydrophobic and sulfur containing amino acids are responsible for the differences among samples.
FIGURE 4.
Normalized intensities from the ToF-SIMS data for the amino acids that caused the largest separation in the peak set. The hydrophobic amino acids glycine (♦) and isoleucine/leucine (▪) exhibit opposite behavior, whereas the sulfur-containing amino acids methionone and cystine (▴) follow the same trend as glycine. As the film thickness increases, the amino acids present at the top of the film change.
Changes in the ToF-SIMS amino acid peak intensities can be from changes in the protein structure due to interactions with the substrate (i.e., denaturation resulting from the adsorption process) or from removal from solution and insertion into the ultra-high-vacuum environment of the ToF-SIMS instrument (i.e., denaturation resulting from water removal). Previous studies with fibrinogen have shown that drying effects are largest at intermediate protein surface concentrations (26). This is consistent with the results of this study, where the ToF-SIMS data from surfaces with intermediate Fn surface concentrations were significantly different from surfaces with low- and high-Fn surface concentrations. It is interesting to note that intensities from the sulfur-containing amino acids were lowest from the surfaces with the highest Fn surface concentrations. Type I and type II Fn modules are stabilized by internal disulfide bonds (10). This suggests that the disulfide bonds are more surface-exposed at low-Fn surface concentrations, but caution must be taken when interpreting the ToF-SIMS data at q0.6%, because at this surface coverage the substrate has more influence over the fragmentation pattern compared to a full monolayer of Fn. However, the significant changes in the intensities of the sulfur-containing amino acids with Fn surface concentration suggest that structural rearrangements occur in the protein film as the Fn surface concentration increases.
Force spectroscopy of Fn films with a collagen peptide
The above-described studies indicate that the conformation of adsorbed Fn varied significantly with the coating concentration. We hypothesized that these conformational changes might alter the biological properties of the adsorbed Fn by increasing or decreasing the availability of ligand-binding sites. To test this hypothesis, we tested the availability of collagen-binding sites on Fn by probing with a collagen-related peptide. The binding sites exposed at the surface of an Fn film will govern the reactivity of the film. Collagen in vivo is present in an insoluble form. Using standard biochemical methods to measure binding sites with solubilized collagen could allow cryptic sites within the film to bind collagen because of diffusion into the film. To avoid this problem, we probed the film with a ligand tethered to an AFM tip via a flexible cross-linker, allowing only the surface sites to be measured. Binding of the probe to internal cryptic sites via diffusion is prevented both because of the short time the probe is in contact with the surface and because the length of the cross-linker is larger than the Fn film thickness.
The force sensitivity and spatial resolution of AFM makes it an ideal technique to study Fn in its adsorbed state (27,28). Force spectroscopy experiments with native Fn have shown that the adsorbed state of the molecule depends on the local chemical environment (29,30), surface roughness (29), and the density of the adsorbed film (21). The modular structure of the molecule is seen in the force-distance curves (31,32), and each module has its own characteristic unfolding length, whereas the type III modules can refold when the molecule is relaxed (31).
AFM tip modification
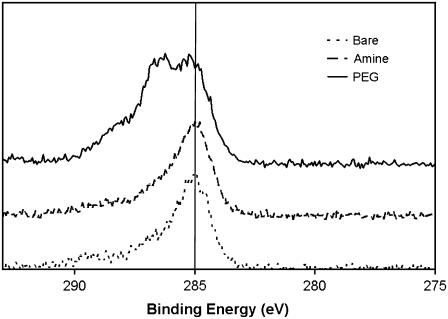
Tethering the peptide to the AFM tip requires a cross-linker that will bind both to the peptide and the tip surface, without simultaneously interacting with the peptide or the tip surface, and will elevate the peptide above the functionalized tip for easy access. The NHS-PEG-PDP cross-linker (33) was chosen because it will bind to the cystine on the peptide and amines on the tip surface and its effectiveness has been proven in other single-molecule studies (18,34,35). Each step in the modification process was verified by XPS and ToF-SIMS. XPS and ToF-SIMS are complementary surface-analytical techniques, providing quantitative information about the bonding environment and species present on the surface (22). Table 1 lists the XPS determined elemental compositions and Fig. 5 shows the high-resolution carbon spectra for each modification step. Since for single-molecule force measurements the peptides need to be widely spaced (i.e., present in low concentrations) on the AFM tip (36), major changes in the surface composition after surface modification is not expected. In fact, no statistical difference in the elemental surface compositions was detected by XPS across the different modification steps; however, the trends suggest that the surface composition is changing. The slight attenuation of the substrate silicon and nitrogen signals upon modification are consistent with an overlayer being deposited onto the tip for each subsequent step. The slight decrease in carbon composition after the esterfication step is due to the ethanolamine displacing some of the hydrocarbon contamination, whereas the increase in carbon composition after the pegylation step is due to the presence of the cross-linker. The oxygen composition remains constant throughout the process. The presence of the oxygen on the bare surface and the splitting of the silicon peaks (data not shown) are consistent with an oxide layer (37). Although this oxide layer is covered by the surface modifications, each step in the process introduces oxygen species. The types of bonds and the relative occurrence of each bond type are gleaned from the high-resolution spectra. The peak at 285.0 eV on all three spectra is due to C-C and C-H bonds from the presence of adventitious hydrocarbon contamination, even though the substrates were thoroughly cleaned (adventitious carbon species are deposited onto all air-exposed surfaces, including ones that have been “cleaned”). There is a slight difference between the high-resolution carbon spectrum of the bare substrate and the aminated substrate. Again, since the amount of material added to the surface is small and similar to the background material, this small change is not surprising. The peak at 286.5 on the pegylated sample is due to the C-O bonds in the PEG chain. XPS results indicate that surface modifications were successful through the trends observed in the elemental compositions and the appearance of ether bonds in the high-resolution carbon spectra.
TABLE 1.
Surface composition determined by XPS
| Si3N4 | Amine | PEG | |
|---|---|---|---|
| C | 14.1 (1.1) | 13.7 (0.7) | 15.4 (1.8) |
| N | 23.7 (0.8) | 23.8 (0.3) | 22.7 (0.8) |
| O | 32.1 (0.5) | 32.6 (0.3) | 32.7 (0.8) |
| Si | 30.1 (0.5) | 30.0 (0.6) | 29.2 (0.9) |
The elemental composition for each surface modification does not change significantly, because of the low surface concentration of the primary amines and PEG cross-linkers. Standard deviations are in parentheses.
FIGURE 5.
High-resolution XPS C1s spectra. There is no major difference between the bare and the aminated samples. The PEG samples show a second peak near 286.5 eV that is indicative of the ether carbon bonds from the PEG backbone. The high binding energy shoulder in the spectrum from the pegylated surface is due to the carbonyl groups in the cross-linker.
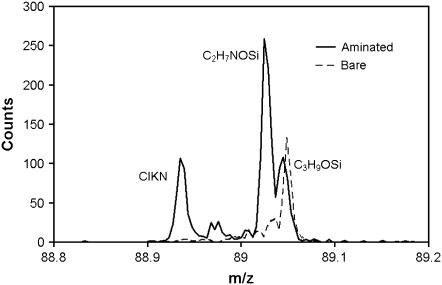
ToF-SIMS, although it is not inherently a quantitative technique, can detect low-concentration species more readily than XPS (38). The appearance of a ToF-SIMS peak from C2H7NOSi near m/z = 89 after the ethanolamine (NH2CH2CH2OH) treatment provides strong evidence that ethanolamine has been successfully attached to the silicon nitride surface (see Fig. 6). Likewise, characteristic fragments from the PEG cross-linker and collagen peptide can be detected with ToF-SIMS after subsequent surface modification steps. Further details of the XPS and ToF-SIMS characterization of each step in the AFM tip functionalization are provided elsewhere (39).
FIGURE 6.
ToF-SIMS peaks showing the appearance of the primary amine on the silicon nitride. The C3H9OSi peak is from the silicon nitride substrate. After the amination step, the fragment C2H7NOSi appears, which indicates that the ethanolamine has been attached to the silicon nitride surface. The ClKN peak is from the molecular sieves.
Fibronectin collagen peptide force spectroscopy
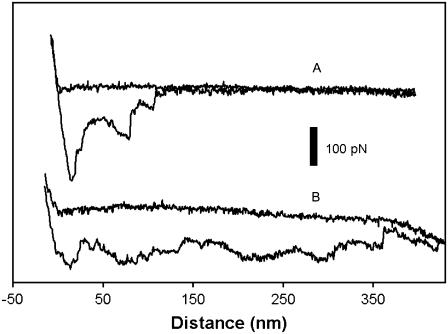
Force spectroscopy experiments were carried out with bare silicon nitride tips to assess nonspecific interactions (40) and collagen-related-peptide-functionalized tips to assess specific interactions. Specificity was confirmed by measuring the forces before and after flooding the system with excess peptide using the collagen-related-peptide-functionalized tips. We considered the possibility that Fn could accumulate on the tip; however, there was no observed dependence of measured force on the repetition number (data not shown) except at the higher Fn surface concentrations with the collagen-peptide-functionalized tips. Fig. 7 shows typical force curves for these experiments. The force curves show the specific interactions at low-Fn surface concentrations and the AFM tip not detaching from the surface at high-Fn surface concentrations. These results suggest that at the higher Fn surface concentrations, Fn is cross-linking (41), since the interaction distance is much greater than the size of individual Fn molecules. Table 2 lists the results from the force experiments. For the bare tip, there is a distinct jump in force from q2.0% to q3.0% (20–50% AFM surface coverage), whereas the forces at q0.6% and q2.0% (10–20% AFM surface coverage) are very similar. This is likely due to the fact that at the higher surface concentration there is a higher probability of the tip interacting with multiple adjacent Fn molecules, whereas at the lower surface concentration, the tip is interacting with single Fn molecules.
FIGURE 7.
Typical force-distance curves from the collagen-related peptide/Fn force spectroscopy. (A) Specific interactions between the collagen-related-peptide-functionalized tip and Fn on the surface at q2.0%. (B) Tip failing to detach from the surface at q3.0%
TABLE 2.
Statistics for the Fn/peptide system
| qN% | Tip | F (pN) |
|---|---|---|
| q0.6% | Bare | 21.4 (6.2) |
| Peptide | 22.5 (9.8) | |
| q2.0% | Bare | 34.4 (10.2) |
| Peptide | 54.8 (22.3) | |
| q3.0% | Bare | 55.7 (24.2) |
| Peptide | n.a. |
When adsorbed Fn is present, there is a high probability that an interaction with the peptide-functionalized tip will occur. The method used to calculate interactions does not consider the point of separation as an interaction. For both the bare tip and the collagen-related-peptide-functionalized tip, the force increases with surface concentration of Fn. The highest surface concentration used with the collagen-related-peptide-functionalized tip resulted in significant tip fouling, and an interaction force was not calculated. The values were calculated from the empirical probability density function, where μ = Σxipi and σ2 = Σ(xi − μ)2pi. Standard deviations are in parentheses. n.a., not applicable.
With the peptides attached to the AFM tip there are three possible interactions that can occur: specific interactions, nonspecific interactions, and no interactions. Specific interactions are when the collagen peptide binds to Fn (Fig. 7 A), nonspecific interactions are when the probe touches a Fn molecule on the surface but no binding events occur, and no interactions occur when the probe does not touch a Fn molecule on the surface. The second part of Table 2 summarizes the results of the pulling experiments for the collagen-related-peptide-functionalized tip. At the surface concentration of q0.6% the force is equivalent to the forces experienced by the bare tip. This is due to the low probability of the tip hitting a Fn molecule and also suggests any adsorbed Fn molecules that are probed are not in a conformation favorable for binding with the collagen related peptide. The ToF-SIMS results suggest that the latter is the case. As the Fn surface coverage increases to q2.0%, the measured force increases significantly and is greater than the force measured at q2.0% with the bare AFM tip.
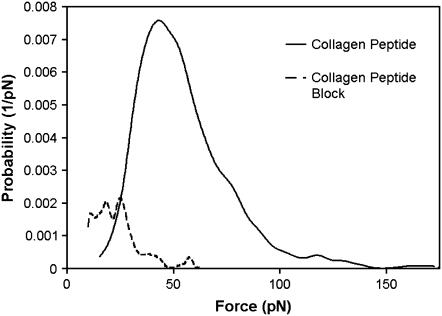
To access the specificity of the collagen-related peptide for Fn, force spectroscopy experiments were carried out with excess peptide present. Fig. 8 shows the force distributions for the collagen-peptide tip interacting with a surface coverage of q2.0%, and the control, where the system is flooded with excess peptide. The binding probability significantly decreases when excess peptide is present, whereas the force distribution without excess peptide present exhibits a distinct shoulder, indicating at least two possible binding sites on Fn for the collagen peptide. Fn has multiple high-affinity binding sites for collagen and gelatin (42,43), which is expected, since Fn is made up of two identical monomers.
FIGURE 8.
Empirical probability density function for collagen peptide force experiments. The solid line represents force spectroscopy experiments with q2.0% and a collagen-related-peptide-functionalized tip. The dashed line represents the same experiment, but the system is flooded with excess peptide. Specificity of the peptide for Fn is shown by the decrease in probability and force when excess peptide is present.
Another study investigating Fn and RGD binding showed that as the Fn film evolves, there is less binding to the RGD site, indicating that it becomes less accessible as the film evolves (44). The collagen binding sites are toward the N-terminus of the molecule, and the RGD site is located closer to the C-terminus end of the molecule (10). Our findings that the measured force of the Fn/collagen-related peptide binding increases with increasing Fn surface coverage, combined with the previously published results showing a decrease in the cell binding ability, suggests that as the coverage of the adsorbed Fn increases, the Fn conformation changes from a state where the collagen binding sites are not exposed to a conformation with the collagen binding sites at the outer surface of the adsorbed Fn film.
The results presented in this work are only for Fn on mica at physiological pH; it is expected that the structure and reactivity of Fn will be dependent on the surface density of Fn for other surfaces, and these changes could be significantly different for other surfaces. Although pH dependence was not investigated in this work, it is expected that there will be a dependence on pH as it is lowered; since the isoelectric point of Fn type I, II, and III modules are different, the pH dependence will depend on the ligand being tested.
CONCLUSIONS
The adsorption of Fn onto mica is initially described by classical diffusion/adsorption equations at low surface coverage. However, due to both the structural and chemical complexities of Fn, the structure of Fn and its reactivity both change with increasing Fn surface coverage. The structural changes were monitored by following how the ToF-SIMS intensities of the leucine/isoleucine, glycine, methione, and cystine amino acids change with Fn surface coverage. Film thickness measurements show that the thickness of the Fn film and amount of Fn on the surface increases after a monolayer is formed, indicating a possible change to a more upright conformation at higher Fn surface coverage. Single-molecule force spectroscopy showed that along with structural changes in the Fn film, there is an increase in the specific binding force between collagen peptides and the Fn film. The increase in the specific binding force with surface concentration is due to the increased presentation of the collagen binding site at the surface of the Fn films.
Acknowledgments
Collagen peptides were generously provided by Donald Kreutzer at the University of Connecticut. The authors acknowledge Lara Gamble, Dan Graham, and Roger Michel for their help in acquiring and interpreting the XPS and ToF-SIMS data.
This work was funded by National ESCA and Surface Analysis Center for Biomedical Problems (National Institutes of Health grant EB-002027), University of Washington Engineered Biomaterials (National Science Foundation grant EEC-9529161), and the Engineered Biomaterials Training Grant (National Institutes of Health grant GM-065098).
Editor: Robert Callender.
References
- 1.Neri, D., and L. Zardi. 1998. Affinity reagents against tumour-associated extracellular molecules and newforming vessels. Adv. Drug Deliv. Rev. 31:43–52. [DOI] [PubMed] [Google Scholar]
- 2.Schmidt, D. R., and W. J. Kao. 2007. The interrelated role of fibronectin and interleukin-1 in biomaterial-modulated macrophage function. Biomaterials. 28:371–382. [DOI] [PubMed] [Google Scholar]
- 3.Tamura, G. S., and C. E. Rubens. 1995. Group-B Streptococci adhere to a variant of fibronectin attached to a solid-phase. Mol. Microbiol. 15:581–589. [DOI] [PubMed] [Google Scholar]
- 4.An, S. S. A., J. Jimenez-Barbero, T. E. Peterson, and M. Llinas. 1992. The two polypeptide chains in fibronectin are joined in antiparallel fashion: NMR structural characterization. Biochemistry. 31:9927–9933. [DOI] [PubMed] [Google Scholar]
- 5.Johnson, K. J., H. Sage, G. Briscoe, and H. P. Erickson. 1999. The compact conformation of fibronectin is determined by intramolecular ionic interaction. J. Biol. Chem. 274:15473–15479. [DOI] [PubMed] [Google Scholar]
- 6.Mosher, D. F., editor. 1989. Fibronectin. Academic Press, San Diego.
- 7.Pelta, J., H. Berry, G. C. Fadda, E. Pauthe, and D. Lairez. 2000. Statistical conformation of human plasma fibronectin. Biochemistry. 39:5146–5154. [DOI] [PubMed] [Google Scholar]
- 8.Emch, R., F. Zenhausern, M. Jobin, M. Taborelli, and P. Descouts. 1992. Morphological difference between fibronectin sprayed on mica and on PMMA. Ultramicroscopy. 42–44:1155–1160. [DOI] [PubMed] [Google Scholar]
- 9.Engel, J., E. Odermatt, and A. Engel. 1981. Shapes, domain organizations and flexibility of laminin and fibronectin, two multifunctional proteins of the extracellular matrix. J. Mol. Biol. 150:97–120. [DOI] [PubMed] [Google Scholar]
- 10.Yamada, K. M. 1989. Fibronectin domains and receptors. In Fibronectin. R. P. Mecham, editor. Academic Press, New York. 47–121.
- 11.Michael, K. E., V. N. Vernekar, B. G. Keselowsky, J. C. Meredith, R. A. Latour, and A. J. Garcia. 2003. Adsorption-induced conformational changes in fibronectin due to interactions with well-defined surface chemistries. Langmuir. 19:8033–8040. [Google Scholar]
- 12.B. G. Keselowsky, D. M. Collard, and A. J. García,. 2003. Surface chemistry modulates fibronectin conformation and directs integrin binding and specificity to control cell adhesion. J. Biomed. Mater. Res. A. 66A:247–259. [DOI] [PubMed] [Google Scholar]
- 13.Han, W., and S. M. Lindsay. 1996. A magnetically driven oscillating probe microscope for operation in liquids. Appl. Phys. Lett. 69:4111–4113. [Google Scholar]
- 14.Kasas, S., B. M. Riederer, S. Catsicas, B. Cappella, and G. Dietler. 2000. Fuzzy logic algorithm to extract specific interaction forces from atomic force microscopy data. Rev. Sci. Instrum. 71:2082–2086. [Google Scholar]
- 15.Baumgartner, W., P. Hinterdorfer, and H. Schindler. 2000. Data analysis of interaction forces measured with the atomic force microscope. Ultramicroscopy. 85:85–95. [DOI] [PubMed] [Google Scholar]
- 16.Ratner, B. D., D. Leach-Scampavia, and D. G. Castner. 1993. ESCA surface characterization of four IUPAC reference polymers. Biomaterials. 14:148–152. [DOI] [PubMed] [Google Scholar]
- 17.Wagner, M. S., and D. G. Castner. 2001. Characterization of adsorbed protein films by time-of-flight secondary ion mass spectrometry with principal component analysis. Langmuir. 17:4649–4660. [DOI] [PubMed] [Google Scholar]
- 18.Hinterdorfer, P., K. Schilcher, W. Baumgartner, H. J. Gruber, and H. Schindler. 1998. A mechanistic study of the dissociation of individual antibody-antigen pairs by atomic force microscopy. Nanobiology. 4:177–188. [Google Scholar]
- 19.Crank, J. 1993. Numerical methods. In The Mathematics of Diffusion. Clarendon Press, Oxford, UK. 28–43.
- 20.Bergkvist, M., J. Carlsson, and S. Oscarsson. 2003. Surface-dependent conformations of human plasma fibronectin adsorbed to silica, mica, and hydrophobic surfaces, studied with use of atomic force microscopy. J. Biomed. Mater. Res. A. 64:349–356. [DOI] [PubMed] [Google Scholar]
- 21.Meadows, P. Y., J. E. Bemis, and G. C. Walker. 2003. Single-molecule force spectroscopy of isolated and aggregated fibronectin proteins on negatively charged surfaces in aqueous liquids. Langmuir. 19:9566–9572. [Google Scholar]
- 22.Ratner, B., and D. Castner. 2000. Surface analysis. In Surface Analysis: The Principal Techniques. J. C. Vickerman, editor. John Wiley & Sons, New York. 43–98.
- 23.Wagner, M. S., S. L. McArthur, M. C. Shen, T. A. Horbett, and D. G. Castner. 2002. Limits of detection for time of flight secondary ion mass spectrometry (ToF-SIMS) and X-ray photoelectron spectroscopy (XPS): detection of low amounts of adsorbed protein. J. Biomater. Sci. Polym. Ed. 13:407–428. [DOI] [PubMed] [Google Scholar]
- 24.Tidwell, C. D., D. G. Castner, S. L. Golledge, B. D. Ratner, K. Meyer, B. Hagenhoff, and A. Benninghoven. 2001. Static time-of-flight secondary ion mass spectrometry and x-ray photoelectron spectroscopy characterization of adsorbed albumin and fibronectin films. Surface and Interface Analysis. 31:724–733. [Google Scholar]
- 25.Xia, N., C. J. May, S. L. McArthur, and D. G. Castner. 2002. Time-of-flight secondary ion mass spectrometry analysis of conformational changes in adsorbed protein films. Langmuir. 18:4090–4097. [Google Scholar]
- 26.Xia, N., and D. G. Castner. 2003. Preserving the structure of adsorbed protein films for time-of-flight secondary ion mass spectrometry analysis. J. Biomed. Mater. Res. A. 67:179–190. [DOI] [PubMed] [Google Scholar]
- 27.Binnig, G., C. Gerber, E. Stoll, T. R. Albrecht, and C. F. Quate. 1987. Atomic resolution with atomic force microscope. Surf. Sci. 189–190:1–6. [Google Scholar]
- 28.Baseelt, D. R., and J. D. Baldeschwieler. 1994. Imaging spectroscopy with the atomic force microscope. J. Appl. Phys. 76:33–38. [Google Scholar]
- 29.Conti, M., G. Donati, G. Cianciolo, S. Stefoni, and B. Samori. 2002. Force spectroscopy study of the adhesion of plasma proteins to the surface of a dialysis membrane: role of the nanoscale surface hydrophobicity and topography. J. Biomed. Mater. Res. 61:370–379. [DOI] [PubMed] [Google Scholar]
- 30.Meadows, P. Y., and G. C. Walker. 2005. Force microscopy studies of fibronectin adsorption and subsequent cellular adhesion to substrates with well-defined surface chemistries. Langmuir. 21:4096–4107. [DOI] [PubMed] [Google Scholar]
- 31.Oberdorfer, Y., H. Fuchs, and A. Janshoff. 2000. Conformational analysis of native fibronectin by means of force spectroscopy. Langmuir. 16:9955–9958. [Google Scholar]
- 32.Oberhauser, A. F., C. Badilla-Fernandez, M. Carrion-Vazquez, and J. M. Fernandez. 2002. The mechanical hierarchies of fibronectin observed with single-molecule AFM. JMB. 319:433–447. [DOI] [PubMed] [Google Scholar]
- 33.Haselgrubler, T., A. Amerstorfer, H. Schindler, and H. J. Gruber. 1995. Synthesis and applications of a new poly(ethylene glycol) derivative for the cross-linking of amines with thiols. Bioconjug. Chem. 6:242–248. [DOI] [PubMed] [Google Scholar]
- 34.Hinterdorfer, P., H. J. Gruber, F. Kienberger, G. Kada, C. Riener, C. Borken, and H. Schindler. 2002. Surface attachment of ligands and receptors for molecular recognition force microscopy. Colloid Surf. B. Biointerfaces. 23:115–123. [Google Scholar]
- 35.Willemsen, O. H., M. M. E. Snel, K. O. v. d. Werf, B. G. deGrooth, J. Greve, P. Hinterdorfer, H. J. Gruber, H. Schindler, Y. v. Kooyk, and C. G. Figdor. 1998. Simultaneous height and adhesion imaging of antibody-antigen interactions by atomic force microscopy. Biophys. J. 75:2220–2228. [DOI] [PMC free article] [PubMed] [Google Scholar]
- 36.Dupres, V., F. D. Menozzi, C. Locht, B. H. Clare, N. L. Abbott, S. Cuenot, C. Bompard, D. Raze, and Y. F. Dufrêne. 2005. Nanoscale mapping and functional analysis of individual adhesins on living bacteria. Nat. Methods. 2:515–520. [DOI] [PubMed] [Google Scholar]
- 37.McCafferty, E., and J. P. Wightman. 1998. Determination of the concentration of surface hydroxyl groups on metal oxide films by a quantitative XPS method. Surf. Interface. Anal. 26:549–564. [Google Scholar]
- 38.Belu, A. M., D. J. Graham, and D. G. Castner. 2003. Time-of-flight secondary ion mass spectrometry: techniques and applications for the characterization of biomaterial surfaces. Biomaterials. 24:3635–3653. [DOI] [PubMed] [Google Scholar]
- 39.Hull, J. R. 2007. The interactions of Group B Streptococci with fibronectin. PhD Thesis. University of Washington, Seattle, WA.
- 40.Cho, Y., and A. Ivanisevic. 2006. Mapping the interaction forces between TAR RNA and TAT peptides on GaAs surfaces using chemical force microscopy. Langmuir. 22:1768–1774. [DOI] [PubMed] [Google Scholar]
- 41.Dzamba, B., and D. Peters. 1991. Arrangement of cellular fibronectin in noncollagenous fibrils in human fibroblast cultures. J. Cell Sci. 100:605–612. [DOI] [PubMed] [Google Scholar]
- 42.Garcia-Pardo, A., and L. I. Gold. 1993. Further characterization of the binding of fibronectin to gelatin reveals the presence of different binding interactions. Arch. Biochem. Biophys. 304:181–188. [DOI] [PubMed] [Google Scholar]
- 43.Gao, X., and M. J. Groves. 1998. Fibronectin-binding peptides. I. Isolation and characterization of two unique fibronectin-binding peptides from gelatin. Eur. J. Pharm. Biopharm. 45:275–284. [DOI] [PubMed] [Google Scholar]
- 44.Wittmer, C. R., and P. R. Van Tassel. 2005. Probing adsorbed fibronectin layer structure by kinetic analysis of monoclonal antibody binding. Colloids Surf. B. Biointerfaces. 41:103–109. [DOI] [PubMed] [Google Scholar]


