Abstract
The “J wave” (also referred to as “the Osborn wave,” “the J deflection,” or “the camel’s hump”) is a distinctive deflection occurring at the QRS-ST junction. In 1953, Dr. John Osborn described the “J wave” as an “injury current” resulting in ventricular fibrillation during experimental hypothermia. Although “J Wave” is supposed to be pathognomonic of hypothermia, it is seen in a host of other conditions such as hypercalcemia, brain injury, subarachnoid hemorrhage, cardiopulmonary arrest from over sedation, the Brugada syndrome, vasospastic angina, and idiopathic ventricular fibrillation. However, there is paucity of literature data as regards to ischemic etiology of “J Wave.” In this article, we present a case where “J waves” were probably induced by ischemia. We also discuss the mechanism of ischemia-induced “J wave” accentuation and its prognostic implications.
Keywords: J wave, acute coronary syndrome, repolarization
Case Report
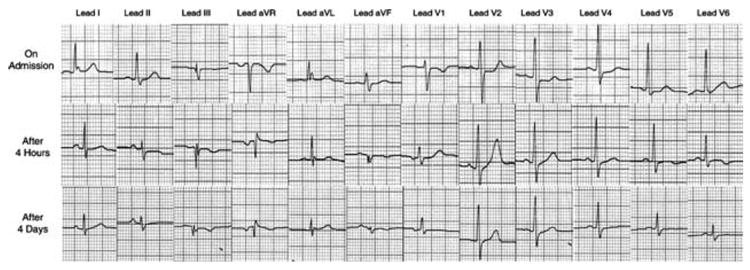
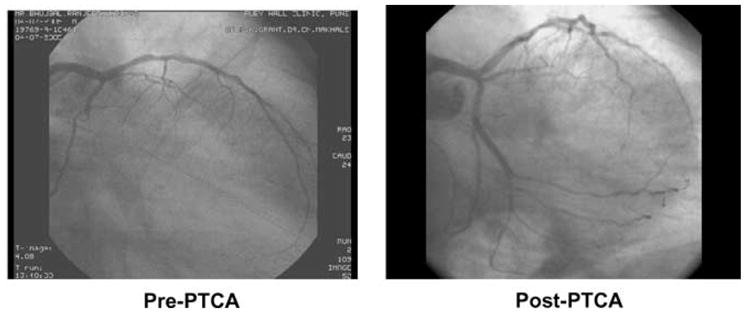
A 28-year-old diabetic man presented with history of severe constricting precordial chest pain for past 3 hours. There was no sweating. His blood pressure was normal and the clinical examination was unremarkable. Electrocardiogram (ECG) recorded during pain was unremarkable except for presence of “J Waves” in leads I and aVL (Fig. 1, top panel). There was no pain thereafter. However, suspecting ischemia, he was kept under observation. Repeat ECG after 12 hours showed no change. However, the ECG after 24 hours showed positive recruitment in R wave voltage in lead V1 along with ST-T changes in inferior and lateral wall leads. The “J Waves” in leads I and aVL were absent (Fig. 1, middle panel). A diagnosis of true posterior wall infarction was made from the ECG. Serum Troponin-T was 3.5 ng/dL (Normal < 0.05 ng/dL). 2D echocardiographic examination of the heart revealed postero-inferior hypokinesia with an ejection fraction of 40%. Subsequently, he underwent coronary angiography, which revealed complete occlusion of left circumflex coronary artery (LCx) after the origin of the first obtuse marginal branch. Successful angioplasty with stent implantation was done and he made uneventful recovery (Fig. 2).
Figure 1.

Serial ECGs - Uppermost strip showing J waves in leads I and aVL, and rS complex in V1. Middle and lower strip showing Rs complex in lead V1 and ST-T changes in inferior and lateral leads with disappearance of J waves.
Figure 2.

Coronary angiography showing totally occluded left circumflex artery in its mid portion, before and after percutaneous coronary angioplasty.
Discussion
It is known that ischemic events in the territory of LCx are likely to be missed as these may not be associated with classical ST segment elevations and that the posterior wall of myocardium is one of the “silent areas” of the routine 12-lead ECG. In the present case, the diagnosis of true posterior wall infarction was made only after the appearance of the classical ECG changes after 24 hours. The J waves seen in the first ECG appear to have represented the “current of injury” and seem to be indicative of severe ischemia in the territory of LCx.
ECG recording of a normal cardiac cycle is composed of depolarization and repolarization. Ventricular depolarization (activation) is denoted by the QRS complex, whereas repolarization is shown by components, which include the J-wave, ST-segment, and T- and U-waves.8 Inscription of “J Wave” on ECG is the result of electrical heterogeneity among ventricular endocardium and epicardium during repolarization.
In 1995, Yan and Antzelevitch9 proposed a potential difference between the epicardium and endocardium during ventricular repolarization phases 1 and 2 as the cellular basis for the J wave. The ventricular epicardium denotes an action potential with a prominent transient outward K+ current (Ito)-mediated notch. The action potential of the endocardium on the other hand shows a much smaller Ito current. This difference gives rise to a transmural voltage gradient during early ventricular repolarization, i.e. the QRS ST junction on surface ECG leading to formation of “J Wave.”
J waves are observed under a wide variety of conditions including hypothermia, hypercalcemia, the Brugada syndrome, and idiopathic ventricular fibrillation associated with J waves in inferior leads.10
There is a paucity of data regarding ischemia as the cause of “J Wave” in the surface ECG in humans. We could find only one case report by Maruyama et al.6 depicting “J Waves” in a case of Vasospastic angina. Similar J waves were also observed by Wellens et al.11 during acute inferior wall myocardial infarction (MI).
Experimental Basis
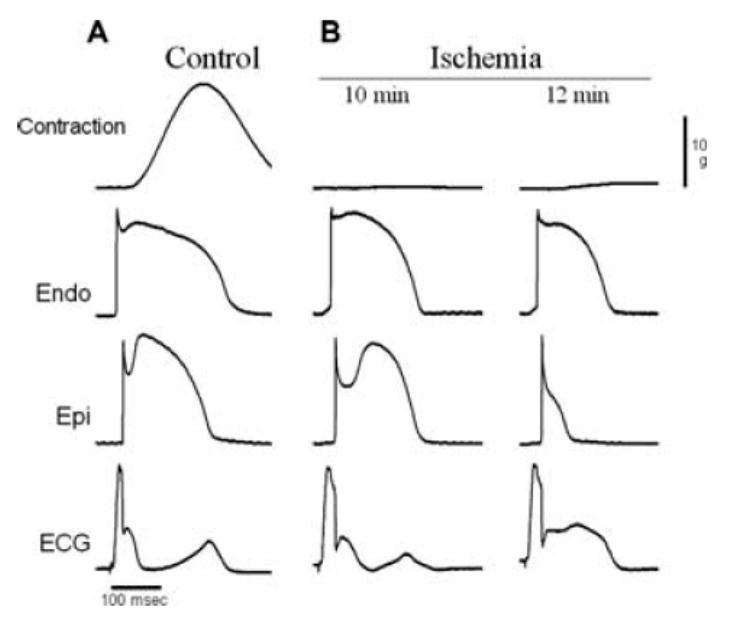
Although there is a experimental data in laboratory animals showing simulated acute ischemia producing similar waves secondary to transmural voltage gradient in the early phases of ischemia, persistence of ischemia further leads to the classical ST elevation and disappearance or amalgamation of the “J Wave” into the elevated ST segment. As shown in Figure 3, ischemia-induced accentuation of the “J Wave” is seen to precede ST segment elevation in the canine ventricular wedge preparation. The ECG trace recorded at 10 minutes after initiation of global ischemia displays an accentuated “J Wave” that, recorded at 12 minutes, leads to classical ST segment elevation in the ECG.12 Acute ischemia may cause opening of KATP channels and reduction of calcium channel current, leading to an increase in the magnitude of the epicardial action potential and this to inscription of the J waves. The ischemic substrate and the electrical heterogeneity across the ventricular wall may lead to increase in Phase 2 reentry and incidence of sustained ventricular arrhythmias.
Figure 3.

Ischemia-induced accentuation of the J wave and ST segment elevation in the ventricular wedge preparation. Each panel shows (from top to bottom) simultaneous recordings of developed tension (Contraction), transmembrane action potentials from endocardium (Endo) and epicardium (Epi), and a transmural ECG. (A) Recordings obtained under control conditions (Control). (B) Recordings obtained after 10 and 12 minutes of ischemia. BCL = 800 ms. At 10 minutes of ischemia (B, 10 minutes), accentuation of the spike and dome morphology in Epi gives rise to a prominent J wave in the ECG. Two minutes later (B, 12 minutes), loss of the Epi action potential dome leads to ST segment elevation in the ECG. (Modified from Fig. 1, Cellular Basis for ST-segment changes observed during Ischemia: Di Diego JM and Antzelevitch C, Journal of Electrocardiology, 2003; Vol. 36 Suppl: 1–5. Reproduced with permission).
There are many ECG criteria of diagnosing a true posterior wall ischemic event. We would like to suggest this “J waves in leads I & aVL” as a new diagnostic criterion for acute occlusion in the LCx region. Such a J wave, in association with clinical history and signs, might constitute an indication for thrombolytic therapy or catheter intervention to such patients, since many of these patients may be at risk for developing sizable myocardial loss leading to left ventricular dysfunction. Taking a clue from the experimental data, the treating physician needs to be on the alert for the occurrence of dangerous ventricular arrhythmias as a result of Phase 2 reentry in such patients.
Conclusions
In summary, we report a case of “Ischemia-induced J Waves,” which heralded an onset of true posterior myocardial infarction in left circumflex artery territory. The concept of “Ischemia-induced J Waves” would help the practicing physicians in following areas:
In the clinical setting of Acute Coronary Syndrome, “J Waves” are likely to be transient, would may indicate a current of injury and impending myocardial infarction and call for possible role of revascularization. Under such circumstances, the J waves would be useful in localizing the infarct related arterial territory.
Since J waves are generally associated with Phase 2 reentrant arrhythmias, the treating physician needs to be on the alert for possible tachyarrhythmia and sudden death.
References
- 1.Osborn JJ. Experimental hypothermia: Respiratory and blood pH changes in relation to cardiac function. Am J Physiol. 1953;175:389–398. doi: 10.1152/ajplegacy.1953.175.3.389. [DOI] [PubMed] [Google Scholar]
- 2.Sridharan MR, Horan LG. Electrocardiographic J wave of hypercalcemia. Am J Cardiol. 1984;54:672–673. doi: 10.1016/0002-9149(84)90273-x. [DOI] [PubMed] [Google Scholar]
- 3.Hersch C. Electrocardiographic changes in head injuries. Circulation. 1961;23:853–860. doi: 10.1161/01.cir.23.6.853. [DOI] [PubMed] [Google Scholar]
- 4.De Sweit J. Changes simulating hypothermia in the electrocardiogram in subarachnoid hemorrhage. J Electrocardiol. 1972;5:93–95. [PubMed] [Google Scholar]
- 5.Jain U, Wallis DE, Shah K, Blakeman BM, Moran JF. Electrocardiographic J waves after resuscitation from cardiac arrest. Chest. 1990;98:1294–1296. doi: 10.1378/chest.98.5.1294. [DOI] [PubMed] [Google Scholar]
- 6.Maruyama M, Atarashi H, Ino T, Kishida H. Osborn waves associated with ventricular fibrillation in a patient with vasospastic angina. J Cardiovasc Electrophysiol. 2002;13:486–489. doi: 10.1046/j.1540-8167.2002.00486.x. [DOI] [PubMed] [Google Scholar]
- 7.Kalla H, Yan GX, Marinchak R. Ventricular fibrillation in a patient with prominent J (Osborn) waves and ST segment elevation in the inferior electrocardiographic leads: A Brugada syndrome variant? J Cardiovasc Electrophysiol. 2000;11:95–98. doi: 10.1111/j.1540-8167.2000.tb00743.x. [DOI] [PubMed] [Google Scholar]
- 8.Yan GX, Lankipalli RS, Burke JF, Musco S, Kowey PR. Ventricular repolarization components on the electrocardiogram: Cellular basis and clinical significance. J Am Coll Cardiol. 2003;42:401–409. doi: 10.1016/s0735-1097(03)00713-7. [DOI] [PubMed] [Google Scholar]
- 9.Yan GX, Antzelevitch C. Cellular basis for the electrocardiographic. J wave Circulation. 1996;93:372–379. doi: 10.1161/01.cir.93.2.372. [DOI] [PubMed] [Google Scholar]
- 10.Hlaing T, DiMino T, Kowey PR, Yan GX. ECG repolarization waves: Their genesis and clinical implications. Ann Noninvasive Electrocardiol. 2005;10:211–223. doi: 10.1111/j.1542-474X.2005.05588.x. [DOI] [PMC free article] [PubMed] [Google Scholar]
- 11.Wellens HJJ, Gorgels AP, Doevendas PA, editors. The ECG. Acute Myocardial Infarction and Unstable Angina: Diagnosis and Risk Stratification. 1. Kluwer Academic Publishers; Amsterdam: The Netherlands: 2003. p. 20. Figure 2.8. [Google Scholar]
- 12.Di Diego JM, Antzelevitch C. Cellular basis for ST-segment changes observed during ischemia. J Electrocardiol. 2003;36(Suppl):1–5. doi: 10.1016/j.jelectrocard.2003.09.001. [DOI] [PubMed] [Google Scholar]


