Abstract
Microdomains of calcium (i.e., areas on the nanometer scale that have qualitatively different calcium concentrations from that in the bulk cytosol) are known to be important in many situations. In cardiac cells, for instance, a calcium microdomain between the L-type channels and the ryanodine receptors, the so-called diadic cleft, is where the majority of the control of calcium release occurs. In other cell types that exhibit calcium oscillations and waves, the importance of microdomains in the vicinity of clusters of inositol trisphosphate receptors, or between the endoplasmic reticulum (ER) and other internal organelles or the plasma membrane, is clear.
Given the limits of computational power, it is not currently realistic to model an entire cellular cytoplasm by incorporating detailed structural information about the ER throughout the entire cytoplasm. Hence, most models use a homogenised approach, assuming that both cytoplasm and ER coexist at each point of the domain. Conversely, microdomain models can be constructed, in which detailed structural information can be incorporated, but, until now, methods have not been developed for linking such a microdomain model to a model at the level of the entire cell.
Using the homogenisation approach we developed in an earlier paper (Goel P., A. Friedman and J. Sneyd. 2006. Homogenization of the cell cytoplasm: the calcium bidomain equations. SIAM J. on Multiscale Modeling and Simulation, in press) we show how a multiscale model of a calcium microdomain can be constructed. In this model a detailed model of the microdomain (in which the ER and the cytoplasm are separate compartments) is coupled to a homogenised model of the entire cell in a rigorous way. Our method is illustrated by a simple model of the diadic cleft of a cardiac half-sarcomere.
Keywords: Calcium microdomains, calcium oscillations, excitation-contraction coupling, homogenisation, effective diffusion coefficients
1 Introduction
The concentration of free intracellular calcium is an important control variable in every type of cell. In many cells, such as secretory epithelial cells, hepatocytes, or smooth muscle cells, the concentration of calcium oscillates, often taking the form of periodic intracellular and intercellular waves, with a period of anywhere from a few seconds to a few minutes. In other cell types such as skeletal and cardiac muscle, a simple rise and fall of calcium concentration is the signal that initiates contraction.
In non-excitable cells, the rise in calcium concentration is caused by the release of calcium from an internal compartment, the endoplasmic reticulum (ER), and thus the oscillations can occur (at least for a time) in the absence of external calcium. In cardiac cells, an initial influx of calcium through L-type channels is the signal that causes the release of more calcium from the sarcoplasmic reticulum (SR).
There are a large number of quantitative models of such oscillations and transients [21, 27, 28]. Until now, these models have always been one of two basic types.
Homogenised models
In these models, the cytoplasm and the SR are assumed to coexist at every point in space. Thus, if we let c denote the concentration of calcium in the cytoplasm, and cs denote the concentration of calcium in the SR, we would have c(x, t) and cs(x, t) defined at each point in space, x. This gives rise to a system of differential equations
| (1) |
| (2) |
where Dc and Ds are effective diffusion coefficients, JSR denotes all the calcium fluxes to and from the SR, and Jother denotes all the other calcium fluxes, either to and from calcium buffers, across the plasma membrane, or to and from other internal organelles. Because these fluxes have units of concentration/time, and because the volume of the SR is different from the volume of the cytoplasm, this formulation requires the term γ, which is the ratio of cytoplasmic to SR volume.
Separated models
In this other class of models, the cytoplasm and the SR are treated as separate domains, connected by common boundary fluxes. Thus, for instance, if Ωc denotes the cytoplasm, Ωs denotes the SR, and ∂Ω denotes their common boundary, we would have
| (3) |
| (4) |
| (5) |
where Jsr is now a boundary flux, with units of moles per unit area per unit time, and Dc and Ds are actual diffusion coefficients, not effective ones.
Separated models are necessary for modeling microdomains, as in such areas the localised calcium fluxes can lead to large local calcium concentrations. However, at the level of the entire cell, only homogenised models are realistic. A separated model for the entire cell requires a huge investment in computing time and model construction, for uncertain benefit.
Nevertheless, calcium in microdomains can have a crucial effect on the calcium concentration in the rest of the cell. In some cells, such as the cardiac cell, the majority of the control of calcium release happens in the microdomain of the diadic cleft, although the contractile proteins can only respond to the macroscopic, cytoplasmic concentrations. In neurons, calcium signalling in microdomains as well as on a larger scale is important for controlling neurotransmitter release [2]. In order to study such phenomena, it is necessary to incorporate both the microdomain and the cytoplasm in a single unified model.
Here we show how such a model can be constructed, using, as a particular example, the half-sarcomere of a cardiac cell. We first present a brief description of the method, followed by a more detailed presentation of the specific half-sarcomere model.
Another of the aims of this project is to use our model of the calcium dynamics in the half sarcomere to help refine compartmental models, which divide the domain into well mixed compartments which contain no spatial gradients (see, for instance, [24]). Typically there will be compartments for the SR, the diadic cleft, the subsarcolemmal space (the region immediately below the SL membrane) and the cytosol. Our model, which includes spatial gradients, can be used to determine if the assumption of no spatial gradients within compartments is justifiable and how the subsarcolemmal space, which is a non-physical compartment, should be modeled. We also reduce the half-sarcomere model presented here into a compartmental model to determine the effect of the loss of spatial information on the model results.
We have also investigated the effect of including a buffering sarcoplasmic/endoplasmic reticulum calcium ATPase (SERCA) pump. When the SERCA pump transports calcium ions from the cytosol to the SR, the ions are first bound to pump proteins on the cytosolic side of the membrane. The protein undergoes a change in conformation which is powered by the energy released from the conversion of adenosine triphosphate (ATP) to adenosine diphosphate (ADP) and the calcium ions are then released on the SR side of the membrane. While the calcium ions are bound to the pump protein they do not contribute to the calcium concentration inside the cytosol or to the calcium concentration inside the SR, so the calcium is being buffered by the SERCA pump. This buffering effect may be significant, as there is a large amount of pump protein present (Bers [4] estimates 15 – 75 μmol/L Cyt in a cardiac ventricular cell).
2 Coupling the Microdomain to the Cytoplasm
2.1 Homogenisation
The homogenisation technique used here is described in detail by [11]. Briefly, we assume the SR in the homogenised region forms a periodic network, where the periodic unit is as given in Fig. 1. This shows an outer cube containing the inner SR network, which has a square cross section. The SR need not have a square cross-section, but can be of any shape, so long as it is periodic in each direction. Since γ, the ratio of cytosolic volume to SR volume, is 18.57 here, this determines the value of k in Fig. 1 as 0.1369. Letting the period of the network tend to zero results in the homogenised equations.
Figure 1.
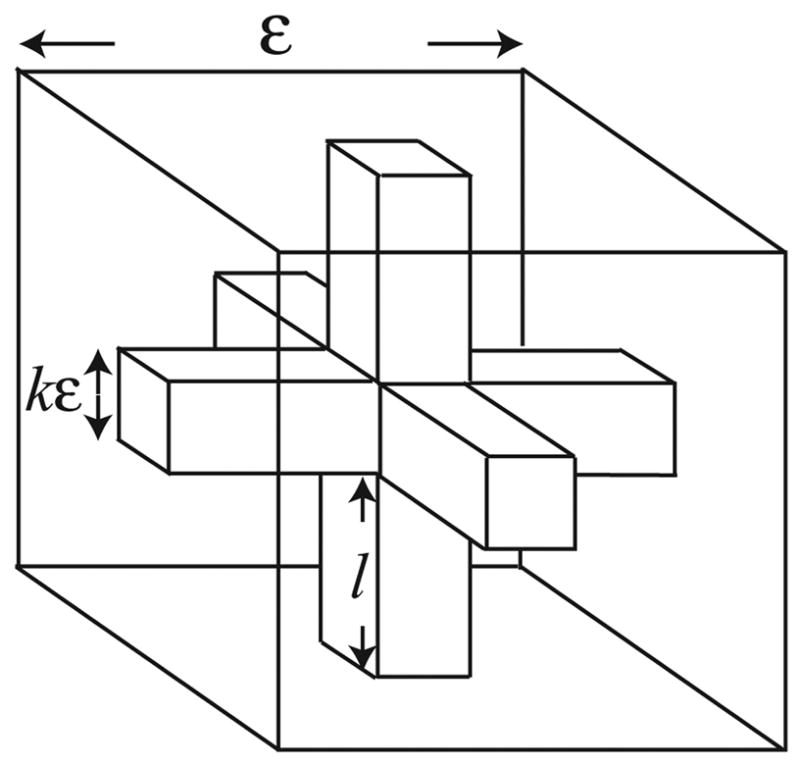
In the homogenised region we assume the structure is given by this periodic unit. The inner network, which has a square cross section, represents the SR, and the remaining space between the SR and the outer cube represents the cytosol. ε is the period of the SR network divided by the assumed length of the homogenised region, and so is dimensionless.
If we ignore the effect of buffering, before homogenisation, the equations for calcium diffusion have the form
with boundary conditions
The functions g1 and g2 model the various pumps and exchangers that allow for calcium transport between the compartments, or into or out of the cell and have units of moles per area per time. Dc and Ds are diagonal matrices of diffusion coefficients.
Letting the period of the network tend to zero, and taking the equations to lowest order in ε, then gives
Here β is the surface area of the SR in one periodic unit after that unit has been scaled to have unit volume, γ c is the fraction of a periodic unit that is occupied by the cytosol and γs is the fraction occupied by the SR. The effective diffusion coefficients, D̃c and D̃s are given by
where
where Ωc is the region in one periodic unit that is occupied by the cytosol and Ωs is the region occupied by the SR. The variable is the small space scale and satisfies 0 ≤ yi ≤ 1 where y = (y1, y2, y3). χc satisfies:
and is periodic in y. χs satisfies analogous conditions.
Plots of the effective diffusion coefficients for a selection of SR geometries can be found in [11]. Similar expressions for the effective diffusion coefficients have been used by [5, 8, 6]. Blum et al. [5] used a different method to derive this expression in the case where the diffusion coefficient is constant, while the work of [6] and [8] is based on the homogenisation methods developed by Bensoussan et al. [3], as is our derivation.
2.2 Connecting homogenised and separated regions
Once the effective diffusion coefficients are derived, it turns out that the boundary condition between the homogenised and separated regions can be written in a natural way. Suppose we have a region as shown in Fig. 2, where one subregion, A, is homogenised, while another subregion, B, is separated into SR (Ωs) and cytoplasm (Ωc).
Figure 2.
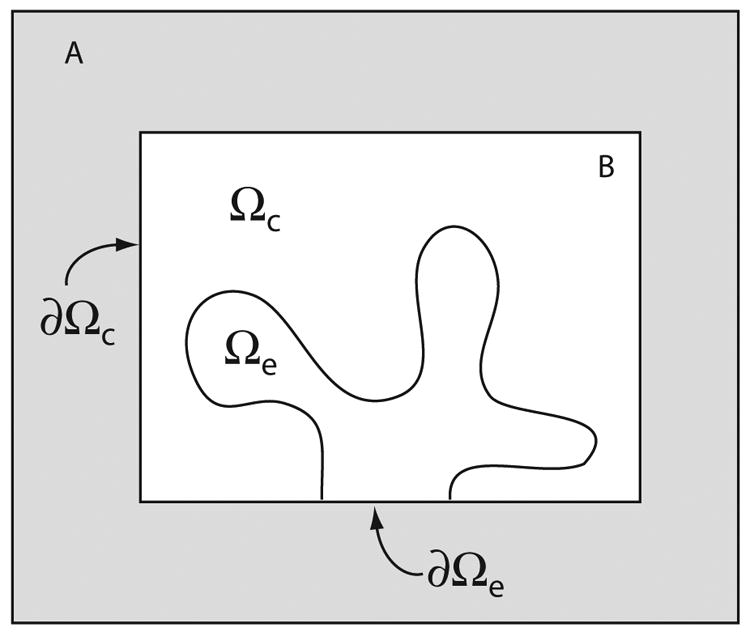
Schematic diagram of a coupled homogenised/separated model.
Between the domains we require boundary conditions that ensure conservation of calcium. If we let c1 and c2 denote the calcium concentrations in the homogenized and separated regions, respectively, then, on ∂Ωc, this condition is
where n is the unit normal on the boundary. This boundary condition is easy to understand. It merely says that the flux out of one region has to equal the flux into the other region, where the fluxes have to be calculated using the appropriate effective diffusion coefficient derived from the homogenisation. Since the SR in the homogenised and separated regions is not connected along ∂Ωc, the correct boundary condition there is ∇cs · n = 0 for the homogenised region.
Similarly, on ∂Ωe we have
and ∇c · n = 0.
3 Model of the Cardiac Half-Sarcomere
We now illustrate our general method with a simple model of the half-sarcomere. This model, quite deliberately, does not include all the myriad complications that have been used in previous models of calcium control in cardiac cells [14, 19, 24]. Instead, we include only those essential elements necessary to illustrate our method. Nevertheless, despite its simplicity the model illustrates some important features of calcium movement through the cell, from microdomain to cytoplasm.
The rise and fall of calcium concentration in cardiac myocytes plays a vital role in excitation-contraction coupling (ECC), which is the process by which electrical excitation of myocytes results in the contraction of the heart. ECC is initiated by depolarization of the SL membrane (see Fig. 3). The depolarization activates L-type calcium channels in the membrane, which allow calcium to enter the cytosol. Alone, the calcium that enters via the L-type channels does not raise the cytosolic calcium concentration enough to result in contraction. Instead, it activates the ryanodine receptors (RyR) on the membrane of the SR, which release a larger amount of calcium from the SR, a process called calcium-induced calcium release (CICR). The SR is a reticulated compartment within the cytosol and serves mainly as a calcium store. The RyR are located on the terminal cisternae (where the SR approaches the SL membrane) and are closely apposed to the L-type channels. The small (about 15 nm) gap between the RyR and the SL membrane is referred to as the diadic cleft, and it is here that CICR takes place.
Figure 3.
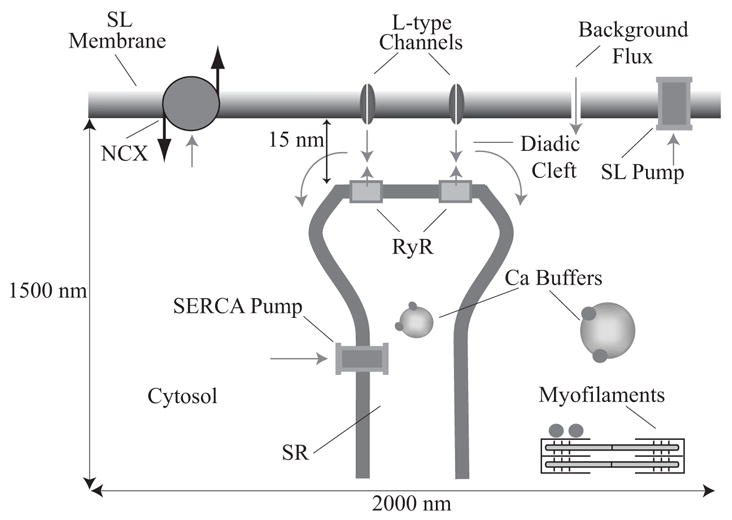
Calcium transport in a half-sarcomere: Calcium enters through the L-type channels, stimulating release from the RyR. Some of the calcium in the cytosol and SR is bound to calcium buffers. The increase in calcium concentration in the cytosol allows calcium to bind to the myofilaments, which activates contraction. Calcium is removed from the cytosol by the SERCA pump, SL calcium pump and the NCX.
Following the release of calcium from the SR, the calcium diffuses out of the cleft, and into the rest of the cytosol, where it binds to the myofilaments and initiates contraction. Calcium is also bound to large proteins (buffers), which slow diffusion and limit the amount of calcium which is free to bind to the myofilaments. To return to its resting state, the cell must now extract the added calcium. The major pathways by which calcium is extracted are the SERCA pump, the sodium-calcium exchanger (NCX) and the SL calcium pump. The SERCA pump uses the chemical energy produced from the conversion of ATP into ADP to transport calcium ions across the membrane from the cytosol to the SR, against a concentration gradient. The sodium-calcium exchanger and SL calcium pump, which are located in the SL membrane, transport calcium into the extracellular space. There is also a background flux of calcium from the extracellular space into the cytosol, and this balances the calcium efflux at rest.
3.1 Model Geometry
The geometry used in the model is shown in Fig. 4. Near the SL membrane the SR and cytosol are two distinct compartments; we refer to this as the non-homogenised region. In the lower region both cytosolic calcium and SR calcium exist at all points in space; we refer to this as the homogenised region. Calculations are performed in cylindrical coordinates on the plane shown in Fig. 4 B, and rotational symmetry is used to form the solution in the three-dimensional geometry shown in Fig. 4 A. Note that as we use rotational symmetry, the L-type channels and RyR are shaped like rings. This is inaccurate, but to break the rotational symmetry would greatly increase the complexity of the model and the computation time required. Construction of a fully three-dimensional model which does not rely on rotational symmetry is in progress.
Figure 4.
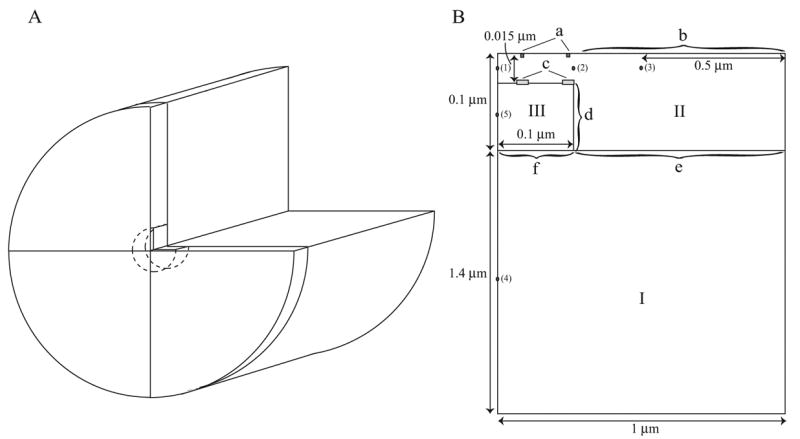
The geometry of the half-sarcomere as used in the model. A. The cylindrical geometry formed by rotating the plane in B. B. Roman numerals denote regions where different model equations are used. I: homogenised region, II: cytosol in the non-homogenised region, III: SR in the non-homogenised region. Lowercase letters denote the boundaries. a: L-type channels, b: NCX, SL pump and background flux, c: RyR, d: SERCA pump, e: Homogenised/non-homogenised cytosolic boundary, f: Homogenised/non-homogenised SR boundary. The numbered points show where readings of calcium concentration were taken (see Results).
3.2 Model Equations
Let c be the concentration of calcium in the cytosol (with units of μmoles per liter cytosol, which we shall write as μmol/L Cyt)), and cs be the concentration of calcium in the SR (with units of μmoles per liter SR, which we shall write as μmol/L SR)). Note that for all our concentrations and fluxes we must be careful to specify the appropriate region in our units. Let bcyt be the concentration of cytosolic buffer and bSR be the concentration of SR buffer.
To present the model equations we discuss in turn each of the regions and boundaries labelled in Fig. 4 B. Detailed expressions for the various pump and exchanger fluxes are derived in the Appendix. The model equations were solved using COMSOL Multiphysics (http://www.comsol.com), which solves such problems using a finite element method.
Region I
In this region we have a homogenised model in which each point represents both calcium in the SR and calcium in the cytosol. There is no release of calcium from the SR into the cytosol, only pumping by the SERCA pump, which pumps calcium from the cytosol into the SR. Calcium diffuses with a constant diffusion coefficient and binds to buffers. Thus,
D̃c and D̃s are the effective diffusion coefficients of calcium in the cytoplasm and SR respectively, and are derived by the process of homogenisation as described above. The values of the effective diffusion coefficients depend on the assumed geometry of the SR, and they can be non-isotropic if the SR is assumed to have a non-symmetrical periodic structure.
The factor γ, which is the ratio of the cytosolic to the SR volumes, incorporates the fact that a flux out of the cytosol (in units of moles per liter cytosol per second) must be multiplied by γ in order to get the correct SR units of moles per liter SR per second.
The total amounts of buffer in the cytosol and SR are denoted by Bc and BSR respectively. Note that although there may be multiple buffers in the cytosol and SR, we have used a single buffer in each, to represent the effect of all the buffers. This simplifies the model, and reduces the amount of computation that needs to be performed in computing buffering dynamics. In the case where the buffering SERCA pump is used, the equations in this region need to be modified, as described in the Appendix.
Region II
Region II is only cytosol (not homogenised with the SR) and so the only reaction terms are those due to buffering. The only influx and efflux terms occur at the boundaries which are treated separately below. Thus,
Region III
Similarly, region III is only SR (not homogenised with the cytosol) and so the only reaction terms are again those due to buffering.
Boundary a
This boundary consists of two line segments, each 0.83 nm long. The line segments begin 0.0333 μm and 0.0975 μm from the left edge in Fig. 4 B. At this boundary we include a calcium influx through the L-type calcium channels. This is assumed to be a given input obtained from experimental measurement (shown in Fig. 17 which was obtained from [19]), and is assumed to occur only at specified locations. Note that we do not model the cell membrane potential in detail by considering all the constitutive ionic currents, but instead assume that the membrane potential is also just a given function of time (Fig. 19). Thus, our model is limited by the fact that we are unable to model feedback from the calcium concentration to the membrane potential. However, this lets us focus more directly on our major interest, the interaction of the calcium dynamics in the microdomain and the cytoplasm, independently of any secondary effects on membrane potential. The specified L-type current is JL-type, and thus
Figure 17.
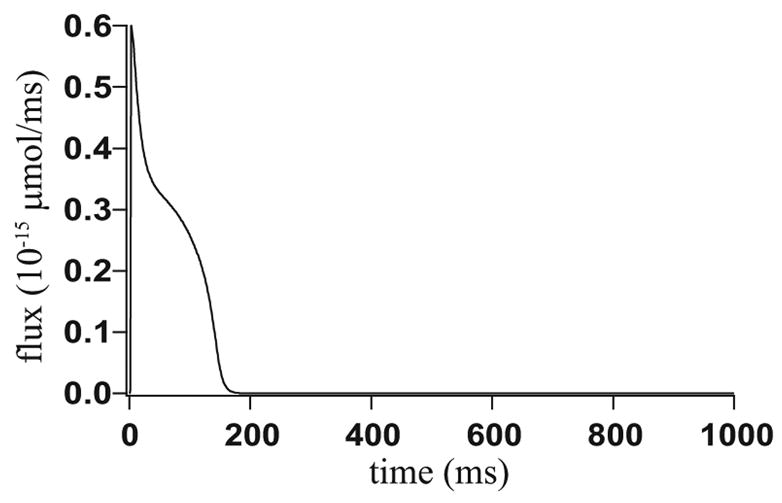
The flux through the L-type calcium channels integrated over boundary a, which is used as an input into the model. The LabHEART model has been used to generate the data. [19].
Figure 19.
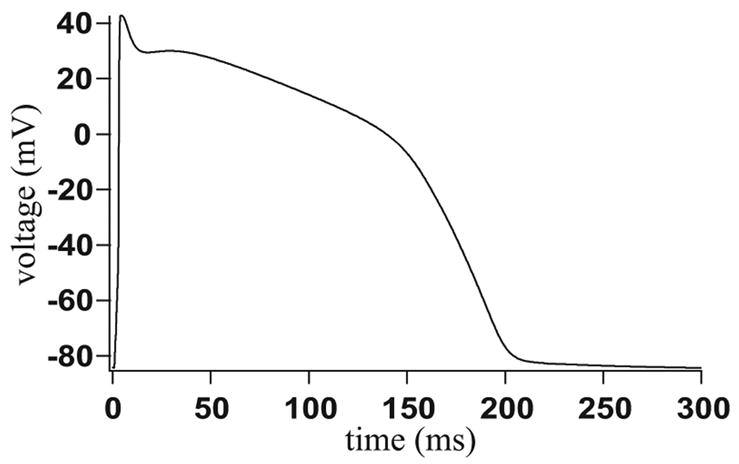
Voltage across the SL membrane, which is used as an input into the model. The NCX current and background flux are dependent upon the membrane voltage. The LabHEART model has been used to generate the data. [19].
at each of the two places where L-type channels are assumed to exist (see Fig. 4 B). Thus the input through the L-type channels is spatially heterogeneous.
Boundary b
Along this boundary we have a small influx of calcium from outside, a small flux due to the SL pumps, and a much larger flux due to the sodium-calcium exchanger. Thus,
Boundary c
This boundary consists of two line segments, each 5 nm long. The line segments begin 0.0292 μm and 0.095 μm from the left edge in Fig. 4 B. This is the boundary that contains the ryanodine receptors which mediate CICR. In reality there are around 25 receptors apposed to about 4 L-type channels, but here we cluster the receptors into two groups. The open probability of the ryanodine receptors is calculated using the four state model of ryanodine receptor given by Shannon et al., [24]. The exact behaviour of the ryanodine receptor is one of the most complex current questions in the study of cardiac calcium dynamics. Ultimately we shall use our model to investigate the behaviour of different receptor models, and incorporate stochastic properties of the receptor, but in this initial study we just use a simple model. On this boundary
Boundary d
Boundary d is the boundary between the cytosol and the SR in the non-homogenised model, and thus the flux across this boundary is just the flux through the SERCA pump:
The pump flux (JSERCA, with units of moles per volume per second) in the homogenised model, and the boundary flux (J̃SERCA, with units of moles per area per second) are related by the ratio of the surface area of the SR to the volume of the cytoplasm in the periodic box used for the homogenisation. Full details are given in the Appendix.
Boundaries e and f
These are the boundaries between the non-homogenised and homogenised versions of the model. On boundary e we have the continuity condition
and the flux continuity condition
Similarly, on boundary f we have the continuity condition
and the flux continuity condition
Here, c+ and c− are the cytosolic calcium concentrations in the non-homogenised and homogenised models respectively, on boundary e, and cs+ and cs− are the analogous SR calcium concentrations.
Other Boundaries
The left hand edge of the plane in Fig. 4 B uses the condition of axial symmetry. The flux across all other boundaries is zero.
3.3 Parameter Values
In any model of this complexity, the issue of how to choose parameter values becomes extremely important. The parameter values are presented in full detail in Tables 2–7. Most of these are taken from previous modeling work (particularly by Shannon et al. [24]) and the remainder were determined by requiring physiologically reasonable behaviour. No detailed fitting procedure was followed, and neither has a full sensitivity analysis been performed. The issue of parameter sensitivity is a crucial one, to be explored in more detail in subsequent publications.
Table 2.
Parameter values for the model equations.
| Parameter | Value (unit) | Parameter | Value (unit) |
|---|---|---|---|
| Dc | 0.25 (μm2 · ms−1) | Ds | 0.25 (μm2 · ms−1) |
| D̃c | 0.2398 (μm2 · ms−1) | D̃s | 0.0978 (μm2 · ms−1) |
| γ | 18.57 | γc | 0.9489 |
| γS | 0.0511 | kc− | 2.456 × 10⁻¹ (ms−1) |
| kc+ | 4.096 × 10⁻¹ ((μmol/L Cyt)−1· ms−1) | Bc | 55 (μmol/L Cyt) |
| kSR− | 1.26 × 10⁻² (ms−1) | kSR+ | 2.0 × 10⁻⁵ ((μmol/L SR)−1 · ms−1) |
| BSR | 6000 (μmol/L SR) |
Table 7.
Parameter values for the RyR model.
| Parameter | Value (unit) | Parameter | Value (unit) |
|---|---|---|---|
| ko | 2.2 × 10⁻⁴ ((μmol/L Cyt)−2ms−1) | ki | 5 × 10⁻⁴ ((μmol/L Cyt)−1ms−1) |
| kom | 0.06 (ms−1) | kim | 3.33 × 10⁻³ (ms−1) |
| ho | 2.2 × 10⁻⁴ ((μmol/L Cyt)−2ms−1) | hi | 5 × 10⁻⁴ ((μmol/L Cyt)−1ms−1) |
| hom | 0.06 (ms−1) | him | 3.33 × 10⁻³ (ms−1) |
| MaxSR | 15 | MinSR | 1 |
| EC | 450 (μmol/L SR) | H | 2.5 |
| kryr | 12 (μm · ms−1) |
The parameters of the sodium-calcium exchanger (Table 6) were determined by fitting the Markov state model of Fig. 16 to the experimental data of [18], in the same way that the model of [34] determined the parameters of the exchanger by fitting to this same data.
Table 6.
Parameter values for the sodium-calcium exchanger.
| Parameter | Value (unit) | Parameter | Value (unit) |
|---|---|---|---|
| kNCX | 1.23 × 10⁻² (μm) | KmCaact | 8.530 × 10⁻² (μmol/L Cyt) |
| nHill | 1.6722 | k1 | 4.072 × 10⁻⁹ ((μmol/L Cyt)−2 · ms−1) |
| k−1 | 2.0211 × 10⁷ (μmol/L Cyt/ms) | k2 | 6.9226 × 10⁷ (μmol/L Cyt/ms) |
| k−2 | 3.6422 × 10⁴ (ms−1) | k̃3 | 4.2357 × 10⁵ (μmol/L Cyt/ms) |
| k̃−3 | 5.1319 × 10⁵ (μmol/L Cyt/ms) | k̃4 | 2.8857 × 10⁵ (μmol/L Cyt/ms) |
| k̃−4 | 2.6458 × 10⁷ (μmol/L Cyt/ms) | k5 | 3.5971 × 10⁴ (μmol/L Cyt/ms) |
| k−5 | 2.3161 × 10⁻¹² ((μmol/L Cyt)−2 · ms−1) | k6 | 8.7734 (ms−1) |
| k−6 | 4.6971 × 10² (μmol/L Cyt/ms) | ni | 7.0 × 10³ (μmol/L Cyt) |
| no | 1.4 × 10⁵ (μmol/L Cyt) | co | 1.8 × 10³ (μmol/L Cyt) |
| T | 302 (K) |
Figure 16.
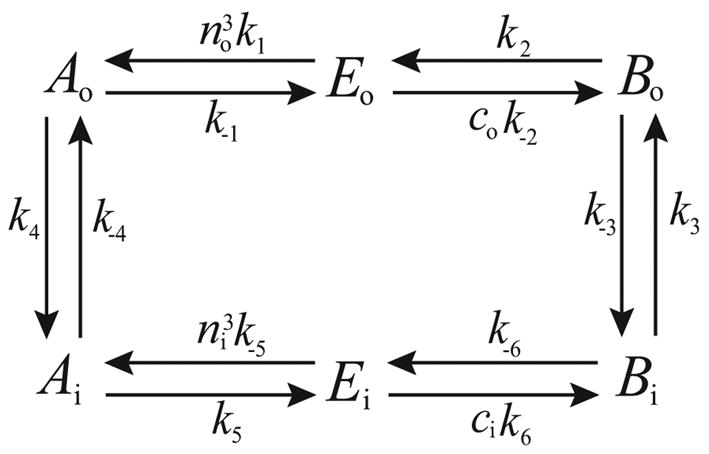
State diagram of the NCX model: E denotes the carrier protein, A denotes the carrier protein with 3 bound sodium ions and B denotes the carrier with 1 bound calcium ion. The subscript o refers to the outside of the cell, and i to the inside.
The parameters of the background flux and SL pumps (Tables 4 and 5) were determined by requiring a resting calcium concentration of around 0.07 μmoles per liter cytosol, and by requiring that only around 1% of the calcium flux during a single transient was carried by the SL pump [4].
Table 4.
Parameter values for the background flux.
| Parameter | Value (unit) | Parameter | Value (unit) |
|---|---|---|---|
| kin | 1.125 × 10⁻⁵ (μm · μmol/L Cyt/ms/mV) | co | 1.8 × 10³ (μmol/L Cyt) |
| T | 302 (K) |
Table 5.
Parameter values for the SL pump.
| Parameter | Value (unit) | Parameter | Value (unit) |
|---|---|---|---|
| VmaxSL | 5.455 × 10⁻⁴ (μm · μmol/L Cyt/ms) | HSL | 2 |
| KSL | 0.5 (μmol/L Cyt) |
The parameters of the SERCA pump (Table 3) were constrained by the Gibbs free energy of hydrolysis of ATP. This condition is explained further in the Appendix.
Table 3.
Parameter values for the SERCA pump.
| Parameter | Value (unit) | Parameter | Value (unit) |
|---|---|---|---|
| P̃c | 52.7 (μmol/L Cyt) | 0.7 ((μmol/L Cyt)2) | |
| K̃2 | 2.22 × 10⁻⁵ ((μmol/L Cyt)−1 · ms−1) | 1.1111 × 10⁻⁵ ((μmol/L SR)−2) | |
| K̃4 | 4.44 × 10⁻² (ms−1) | K̃−4 | 4.44 × 10⁻⁹ ((μmol/L Cyt)−2 · ms−1) |
| [ATP] | 3000 (μmol/L Cyt) | [ADP] | 10 (μmol/L Cyt) |
| [P] | 3000 (μmol/L Cyt) |
Typical values (see, for instance, [4]) are used for the remaining parameters (Table 2).
4 Results
The model equations, with the non-buffering SERCA pump, were solved where the input (the electrical stimulation given in Fig. 19) was pulsed at a frequency of 1 Hz. The results shown give the steady state response to this repetitive input. Fig. 5 shows the calcium concentrations at the points given in Fig. 4 and Fig. 6 shows the fluxes involved in the model, integrated over time.
Figure 5.
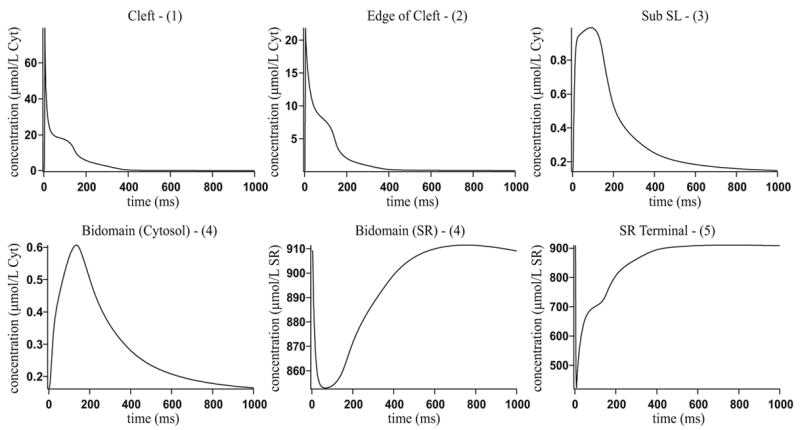
Results when using the non-buffering SERCA pump. The numbers in parentheses in the graph headings refer to the positions given in Fig. 4 B.
Figure 6.
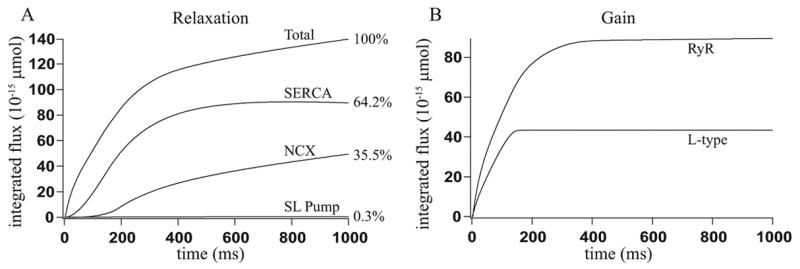
Fluxes integrated over time when using the non-buffering SERCA pump: A: The time integral of the fluxes involved in relaxation, and the percentage they contribute. These are close to the percentages found experimentally from a rabbit, as given in [4]. B: The time integral of the flux through the L-type channels and the flux through the RyR.
Experimental data shows that the concentration of calcium in the cytosol reaches a peak of around 0.7 μmol/L Cyt, after about 30 to 100 ms [4]. Fig. 5 shows how the transient at position 4 in Fig. 4 B reaches a peak of 0.61 μmol/L Cyt after 135 ms. Bers [4] gives experimental results showing the contribution to the decline in calcium of the SERCA pump, sodium-calcium exchanger and SL calcium pump. In rabbit these contributions are given as 70%, 28% and 2% respectively. Fig. 6 A shows our model results are close to these experimental results.
Bers [4] gives the total amount of calcium released through the L-type channels as 9.7 μmol/L Cyt and the total amount of calcium released through the RyR as 37 μmol/L Cyt. The volume of cytosol in our half-sarcomere model is 4.48 ×10⁻¹⁵ L, so we expect 43.5 × 10⁻¹⁵ μmol of calcium to enter through the L-type channels and 165.8 × 10⁻¹⁵ μmol to enter through the RyR. Fig. 6 B shows that in our model, 43.5×10⁻¹⁵ μmol of calcium enters through the L-type channels and 89.5×10⁻¹⁵ μmol enters through the RyR. The L-type flux is in very good agreement with the expected amounts. The gain, which is given by the amount of calcium that enters the cytosol through the RyR, divided by the amount that enters through the L-type channels, is 2.1, which is considerably lower than measured values. Based on the values given by Bers [4], the gain should be 3.8. Using the model of the RyR open probability given by Zahradníková and Zahradník [35], instead of that given by Shannon et al. [24], we were able to attain a higher gain of 2.8 (results not shown). It is not clear why our model has a smaller gain than is measured experimentally; possibly this is due to the simplifications inherent in the model, but it is also possible that a different choice of parameters will increase the gain. However, we were unable to find such a parameter set. At steady state, the model gives a cytosolic calcium concentration of 0.07 μmol/L Cyt, which is in good agreement with the steady state concentrations determined experimentally.
4.1 Calcium Gradients
The major benefit of our model is that it resolves calcium gradients both inside the diadic cleft, as well as outside the cleft in the cytosol. In Fig. 7, A–D we give plots of the calcium concentration along cross sections. The positions of the cross sections are given in Fig. 7 E. Plots of the cross sections numbered 5 and 6 in the cytosol and 1, 4, 9 and 10 in the SR are not given, as the calcium concentration along these lines does not vary significantly (i.e., less than 5%). Note that cross sections 1, 3, 4 and 8 are in both the cytosol and SR as they are in the homogenised region.
Figure 7.
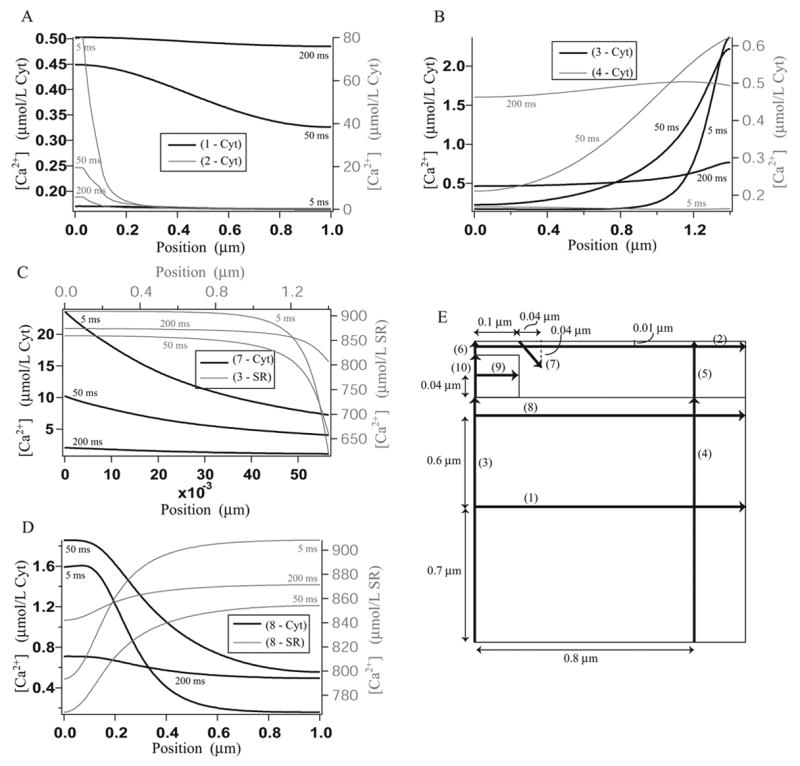
Calcium concentration gradients along the cross sections given in diagram E, after 5 ms, 50 ms and 200 ms. Plots are not given along those cross sections where the calcium concentration does not vary significantly. A: Cytosolic calcium concentration along cross sections 1 and 2. B: Cytosolic calcium concentration along cross sections 3 and 4. C: Cytosolic calcium concentration along cross section 7 and SR calcium concentration along cross section 3. C: Cytosolic calcium concentration along cross section 8 and SR calcium concentration along cross section 8. E: The positions of the cross sections.
The results show that, despite its small size, the diadic cleft is not a well mixed compartment. Along cross section 2 from 0 – 0.1 μm (that is, along the radius of the diadic cleft) there is significant change in the calcium concentration, but along cross section 6 there is very little change. This suggests that modeling the cleft as one-dimensional may be a better approximation than as a well mixed compartment. The same is true for the subsarcolemmal space, i.e., the area directly under the plasma membrane, which is often considered a separate compartment in compartmental models (see, for instance, [24])). Along cross section 2 there is a significant change in the calcium concentration, but along cross section 5 there is not. Because the subsarcolemmal space is not a physical compartment, the height of the compartment is not fixed and may extend to cross sections 3 and 4. As long as the height is chosen to be small there are no significant gradients along these cross sections. The subsarcolemmal space is included as a compartment in compartmental models because it is believed that near the membrane the calcium concentration may be significantly higher than elsewhere in the cytosol, as it is close to the cleft where calcium release occurs. Our results (cross sections 3 and 4) support the idea that the calcium concentration is higher nearer the membrane. The size of the subsarcolemmal space which should be used in a compartmental model depends on the sensitivity to calcium concentration of the membrane channels. Given a limit on the variation in calcium concentration which is considered acceptable, the results from the three-dimensional model can be used to set the depth of the subsarcolemmal compartment.
There are significant calcium gradients in the homogenised region of the cytosol, both vertically and horizontally (along cross sections 1, 3, 4 and 8), and in the homogenised region of the SR (along cross sections 3 and 8). This suggests that the assumptions that the cytosol and SR are well mixed compartments may not be valid. However, since there are no significant spatial gradients in the terminal SR this compartment could be accurately modeled as well-mixed.
4.2 A Compartmental Model
We have reduced the three-dimensional model into a compartmental model to assess the effect of the loss of spatial information. Compartmental models of calcium dynamics in cardiac cells, such as that of Shannon et al. [24], typically contain four compartments. These are the cytosol, the SR, the diadic cleft and the subsarcolemmal space. Our model, which is depicted in Fig. 8, also includes a compartment for the terminal SR, as results from §4.1 show that the calcium concentration in the SR near the RyR is significantly lower than that further from the RyR.
Figure 8.
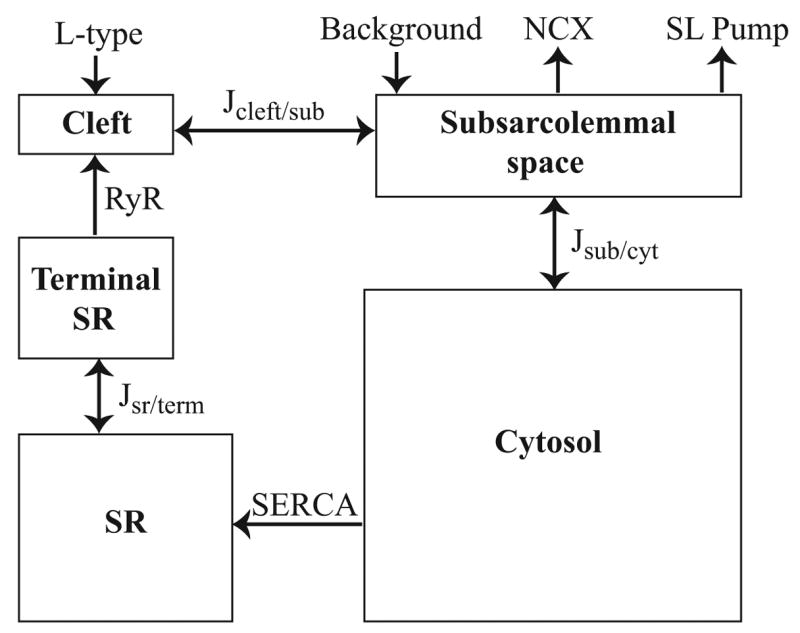
Diagram of the compartments and fluxes in the compartmental model.
The equations governing the calcium concentrations in each compartment, and the buffer concentrations are given by:
The calcium concentrations in the cleft, subsarcolemmal space, cytosol, SR and terminal SR are given by ccf, csub, ccyt, csr and cterm respectively. The buffer concentrations are labelled analogously. Bc gives the buffer concentration in the cytosol and subsarcolemmal space. BSR gives the buffer concentration in the SR and terminal SR. Jx/y gives the diffusion from compartment x to compartment y, and is given by
where cx and cy are the calcium concentrations in compartments x and y.
The volumes of each compartment are calculated from Fig. 4 B, and are given in Table 1. The terminal SR and subsarcolemmal space are both assumed to end where the homogenised region begins. Note that the SERCA pump flux term between the terminal SR and the subsarcolemmal space has not been included in the model, as it is small and has little effect on the results.
Table 1.
Parameters for the compartmental model. The parameters in the lower section are those varied when fitting the model to the results in Fig. 5.
| Parameter | Value (unit) | Parameter | Value (unit) |
|---|---|---|---|
| Vol. Cleft | 1.5 × 10⁻¹⁹π (L) | Vol. Sub | 9.9 × 10⁻¹⁷π (L) |
| Vol. Cyt | 1.328 × 10⁻¹⁵π (L) | Vol. SR | 7.15 × 10⁻¹⁷π (L) |
| Vol. Term | 8.5 × 10⁻¹⁹π (L) | kRyR | 1.5504 × 10⁻¹⁷π (L/ms) |
| kin | 1.114 × 10⁻²⁰π (μmol/ms/mV) | VmaxSL | 5.4 × 10⁻¹⁹π (μmol/ms) |
| kNCX | 1.22 × 10⁻¹⁷π (L) | P̃c | 70 × 10−15π (μmol) |
|
| |||
| rcleft/sub | 4.321 × 10⁻¹⁷ (L/ms) | rsub/cyt | 1.573 × 10⁻¹⁵ (L/ms) |
| rsr/term | 2.301 × 10⁻¹⁸ (L/ms) | ||
The models giving the fluxes through the L-type channels, SERCA pump, NCX, RyR, SL pump and background flux are all the same as those used in the three-dimensional model. The flux terms from the three-dimensional model have been integrated over the area or volume where they occurred, which has resulted in some altered parameter values. These parameter values are given in Table 1. Note that parameter values have different units to those used in the three-dimensional model, as the fluxes now have units of μmol/ms. Apart from these altered parameters, all parameter values in the flux and buffering terms are taken from the three-dimensional model.
Using the compartmental model and only varying the parameters governing the diffusion of calcium between compartments (that is, rcleft/sub, rsub/cyt and rsr/term) we were able to obtain results in good agreement to those from Fig. 5 where the three-dimensional model is used. To perform the fit, we constructed a function which calculates the squared difference between results from the two models, and then used the simplex search method (Matlab’s fminsearch function) to minimise the function. The compartmental model results, along with those from the three-dimensional model, are shown in Fig. 9. The parameter values for the fitted parameters are given in the lower section of Table 1. Note that these parameter values are dependent on the size of the compartments, as well as the locations where we chose to measure and compare the calcium concentration in the three-dimensional model. We also compared the compartmental model to the average values calculated over each region in the 3-d model (computations not shown). The fits were very similar, with the resultant values of rcleft/sub = 5.397 × 10⁻¹⁷ L/ms, rsub/cyt = 2.127 × 10⁻¹⁵ L/ms and rsr/term = 2.362 × 10⁻¹⁸ L/ms.
Figure 9.
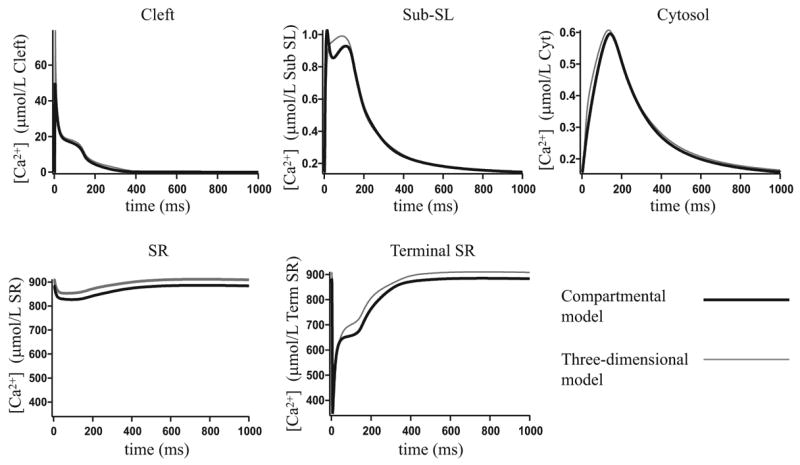
The compartmental model results compared to the three-dimensional model results.
To determine whether the best-fit values of the transport coefficients depend on the type of stimulus, we redid the fits for a variety of L-type channel fluxes and membrane voltage transients. These inputs are not of physiological type, being designed only to test the robustness of the fit to different inputs. We then compared the results from the compartmental model and the three-dimensional model, using the values of rcleft/sub, rsub/cyt and rsr/term given in Table 1. The results are shown in Fig. 10–12. In Fig. 10 and Fig. 12 changing the input has had little impact on the agreement between the two models. In Fig. 11 the changed input has significantly affected the agreement. In the original fit in Fig. 9 the compartmental model has less total calcium than in the three-dimensional model. Pulsing the input at a higher frequency as in Fig. 11 has amplified the loss of calcium.
Figure 10.
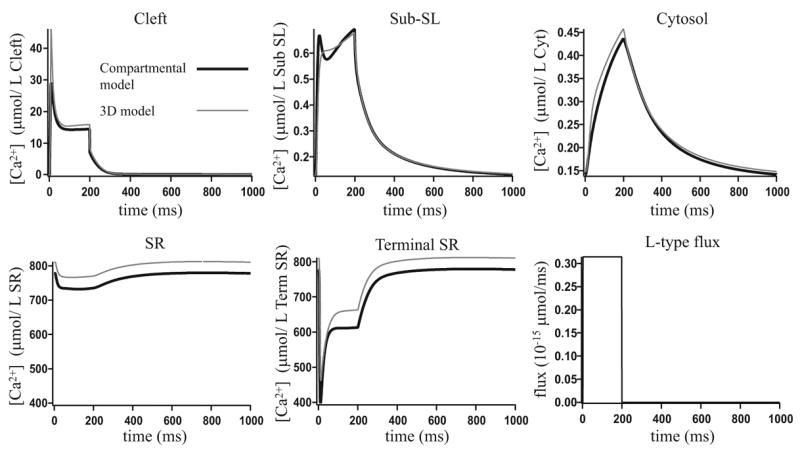
A comparison of the compartmental model results and the three-dimensional model results, where the membrane voltage is fixed at −84.39 mV and the L-type flux is as given in the figure.
Figure 12.
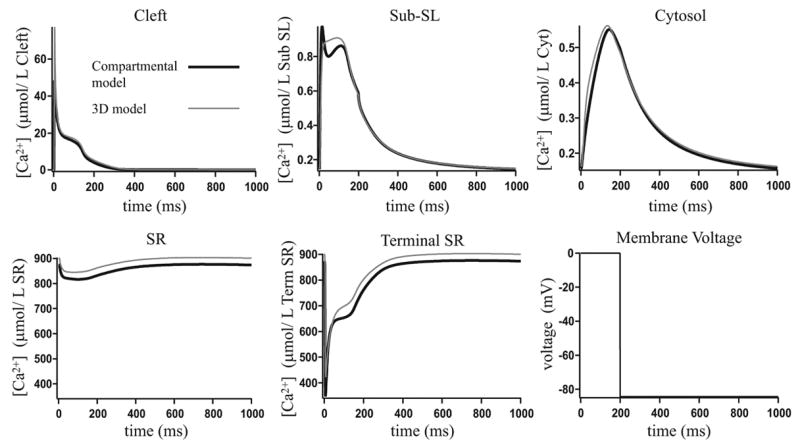
A comparison of the compartmental model results and the three-dimensional model results, where the L-type flux is as given in Fig. 17 and the membrane voltage is as given in the figure.
Figure 11.
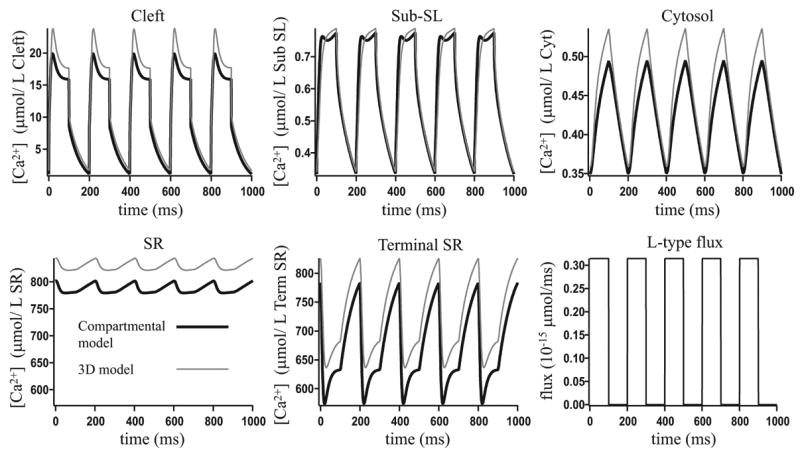
A comparison of the compartmental model results and the three-dimensional model results, where the membrane voltage is fixed at −84.39 mV and the L-type flux is as given in the figure.
The performance of the compartmental model is dependent on sensitivity to spatial gradients. If the RyR channel distribution is very different to the L-type channel distribution, as in Fig. 13, then the radial gradients in the cleft become more important. The compartmental model results, with the original fit parameters, are no longer in such good agreement with the three-dimensional model results. To try and improve this fit, we divided the cleft into two compartments, adding a sixth compartment to the compartmental model, and refitted the model using the transfer rates from the inner to the outer cleft and from the outer cleft to the subsarcolemmal space as fit parameters. However we were not able to improve significantly upon the results from when the cleft was modeled as one compartment. The radial calcium gradients in the terminal SR are very shallow, even with the RyR positioned as in Fig. 13, and so modeling the terminal SR as two compartments does not improve upon the fit to the three-dimensional model.
Figure 13.
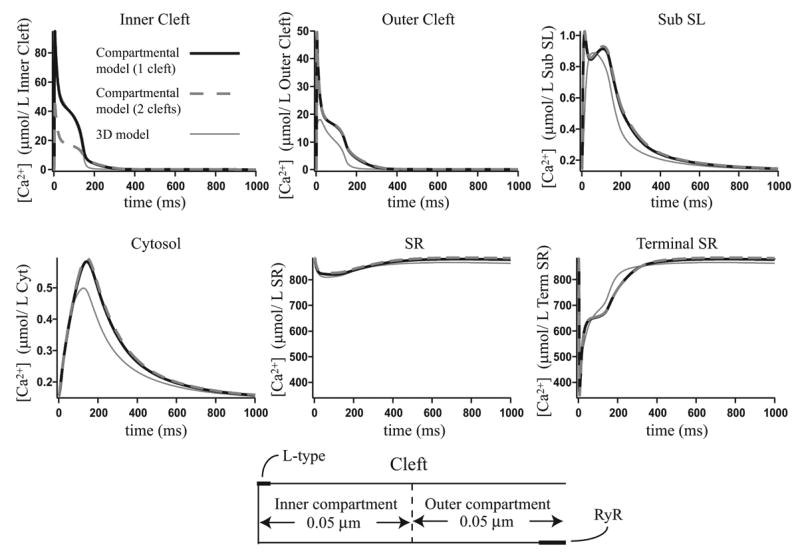
The three-dimensional model results with the RyR and L-type channels shifted as shown in the figure, compared to the compartmental model results from Fig. 9 and compartmental model results where the cleft is modeled as two separate compartments.
4.3 The Buffering SERCA Pump
In Fig 14 we show the effect of switching from the non-buffering to the buffering SERCA pump with the concentration of pump protein kept constant at Pc = 52.7 μmol/L Cyt, and then increasing the concentration of pump protein used in the buffering pump to 105.4 μmol/L Cyt. When we increase Pc we decrease the pump speed s so that their product remains constant, as explained in SERCA Pump in the Appendix. Note that the SERCA pump flux across boundary d in Fig. 4 is given by the non-buffering SERCA pump as this boundary is small and has little effect on the results. When Pc = 52.7 μmol/L Cyt, s = 1, and when Pc = 105.4 μmol/L Cyt, s = 0.5. The electrical stimulation is pulsed at 1 Hz and we give the steady state response to this input. Switching from the non-buffering SERCA pump to the buffering SERCA pump has resulted in a large decrease in the amplitude of the calcium transient in the cytosol and SR, as some of the free calcium is now bound to the pump protein. Increasing the concentration of pump protein used in the buffering pump has caused a further decrease in the calcium transient, as the pump is able to buffer more calcium.
Figure 14.
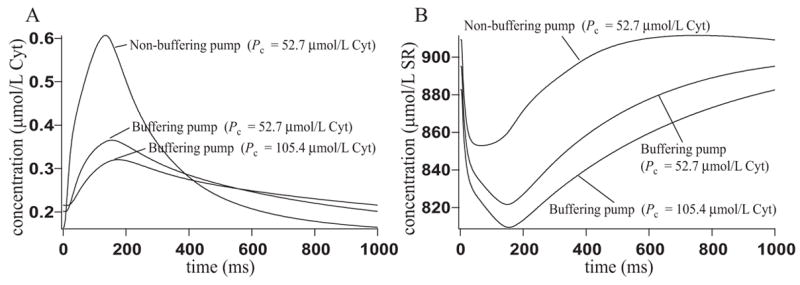
Results when using the non-buffering SERCA pump, the buffering SERCA pump with Pc = 52.7 μmol/L Cyt and the buffering SERCA pump with Pc = 105.4 μmol/L Cyt. The calcium concentration has been measured at position 4 in Fig. 4 B. A: Cytosolic calcium concentration. B: SR calcium concentration.
If we reduce the turnover rate of the pump (that is, if we further reduce s) and compensate by increasing Pc in the same manner as above, then the pump has a greater buffering capacity and the amplitude of the calcium transients is further reduced. Reducing the turnover while keeping Pc constant also results in lower amplitude transients in the cytosol and SR. The total flux through the SERCA pumps is reduced, and this results in reduced RyR flux and increased NCX flux. Hence, the decrease in the calcium transient is due to loss of calcium to the cell exterior.
Previously to doing this work, we predicted that using the buffering SERCA pump in place of the non-buffering SERCA pump would reduce the rate at which the SR calcium concentration dropped at the beginning of the transient, because calcium ions would be released from the pump into the SR as the SR emptied. If this were a significant effect it would help prevent depletion of the SR, and increase the overall rate of calcium release from the SR. However, although such an effect certainly exists (computations not shown) we saw no evidence that this was occurring to any significant extent. The difference caused by a buffering calcium pump in the rate of calcium release from the SR is too small to be physiologically significant, even at high pump densities.
5 Discussion
Using a model that combines both homogenised and non-homogenised regions, we have shown how a model of a calcium microdomain can be coupled to a homogenised model of the cytoplasm. This allows for the incorporation of microdomains into whole-cell models, and detailed investigations of how the dynamics inside a microdomain can affect whole-cell behavior. To our knowledge, this is the first construction of a joint homogenised/non-homogenised model of a calcium microdomain.
We illustrated our technique with a simple model of a cardiac half-sarcomere in which the diadic cleft is coupled to the rest of the cytoplasm. We chose this example as the diadic cleft is one of the best understood calcium microdomains with a clearly defined role in the overall cellular response. Although our model of the diadic cleft is highly simplified with respect to many of the biophysical mechanisms (such as control of the membrane potential, or diffusion of other ions such as sodium) nevertheless it demonstrates some important features of calcium microdomains. Once we know how to construct unified models that include a calcium microdomain, incorporation of additional biophysical complexity is a relatively simple matter (although, of course, fitting it to data is not!).
In summary, we showed how
neither the microdomain nor the cytoplasm is well-mixed. Despite its small size, significant gradients exist within the microdomain, and significant gradients also exist in the cytoplasm.
for a given physiological input the unified model can be well approximated by a simpler compartmental model, in which the cell is approximated by a series of connected compartments. By careful selection of the intercompartmental transport coefficients (with no changes to any other model parameters), the average cytoplasmic transient remains almost unchanged.
although the simpler compartmental model can provide an excellent fit to the full 3-dimensional model for a given input, it does not agree well with the full model for a wider variety of inputs.
We conclude that, at least in the present context, compartmental models can be used to model microdomains only with considerable care. Given a careful choice of the intercompartmental transport coefficients the compartmental model can reproduce the behavior of the full model with considerable accuracy, but can do so only for a given input. If the input is changed (for instance, if the frequency of the input is changed from 1 Hz to 5 Hz) there is no guarantee that the compartmental model will continue to be a close approximation of the full model.
Soeller and Cannell [30] discuss three classes of models of cardiac calcium dynamics. These are common pool models, local control models and integrated local control models. Common pool models, such as that of Snyder et al. [27], are characterized by having a single well mixed compartment where calcium from the L-type channels and RyR is released. These models are unable to reproduce both high gain as well as graded release, which are properties of ECC that have been identified by experimentalists [32]. Gain is given by the ratio of RyR flux to L-type channel flux and graded release means that SR calcium release is under tight control by the L-type current, rather than exhibiting all-or-none behaviour as the L-type current is varied.
Local control models [29, 31] are based on the idea that rather than the whole cell RyR release being controlled by the whole cell L-type channel current, calcium induced calcium release takes place at individual diadic clefts. The whole cell behaviour is then given by the collective behaviour over many functional release units (FRUs). Integrative local control models contain a large number of FRUs, which collectively should exhibit the calcium dynamics associated with ECC, in particular, high gain and graded release.
A variety of approaches have been taken when constructing integrative local control models. Both Rice et al. [21] and Greenstein and Winslow [10] ignored spatial gradients in the diadic cleft, whereas the model of Stern et al. [33] incorporated diffusion inside the cleft. Rice et al. modeled the ensemble behaviour with uncoupled FRUs. Greenstein and Winslow coupled FRUs by using average cytosolic calcium metabolism and membrane currents and Stern et al. used the aggregate calcium fluxes produced by the FRUs as input to a lumped-compartment model of global cytosolic and SR calcium dynamics. In all such models, however, the spatial relationship between the FRUs has not been taken into consideration. As a result, the models cannot be used to study the progression from non-regenerative behaviour to calcium wave propagation which results from SR calcium overload [30].
Here we model calcium-induced calcium release in a FRU, including the spatial gradients within the diadic cleft. This is coupled to the spatial and temporal dynamics in the rest of the half sarcomere, so that the behaviour in the space between FRUs is also considered. The combination of homogenised and non-homogenised schemes has allowed us to model the structure of the terminal SR and subsarcolemmal space, without needing to model the structure elsewhere. This is useful, as the SR forms a complicated network, the precise geometry of which is unknown and would be difficult to implement in comparison to our homogenised scheme. We have not yet coupled multiple FRUs to model cell wide behaviour. Neither do we take the stochastic nature of each ryanodine receptor into account, and thus our model cannot give graded release by recruitment of release sites. Incorporation of both these features will rely on the construction of simpler models from the one shown here. Once the complete numerical solution is known, simplified models can be constructed with greater confidence that they do indeed incorporate the essential behaviours of the complete model.
Following proposals that there exist micro-domains of calcium inside the cell, many groups began constructing compartmental models of myocytes [20]. Jafri et al. [14] modeled the intracellular space and the diadic cleft as separate compartments, and Shannon and Bers [23] added a subsarcolemmal space based on experimental evidence that membrane channels see a higher calcium concentration than that elsewhere in the cytosol. These compartmental models are based on the assumption that there are not significant calcium gradients within each compartment, so they can be treated as well mixed.
Our results indicate that there are significant gradients within the compartments. The diadic cleft contains gradients in the radial direction, but does not have significant gradients longitudinally, so it may be appropriate to model this region in one-dimension. Any longitudinal gradients have a greater effect on the solution than do the radial gradients, since the RyR are separated longitudinally from the L-type channels. In our model the longitudinal calcium gradients in the cleft are small, as most of the RyR calcium release occurs after the L-type channels close, allowing the sharp gradients in the longitudinal direction to collapse. Thus, since the most important spatial gradients are small, the compartmental model agrees well with the full model. The subsarcolemmal space also does not contain significant longitudinal gradients, provided it is narrow enough, but as with the cleft, it does contain significant radial gradients. The SR and cytosol contain significant spatial gradients both longitudinally and radially.
Our model agrees with the experimental evidence that there is a higher calcium concentration near the membrane than elsewhere in the cytosol. The size of the subsarcolemmal space in a compartmental model will depend on the importance of the spatial gradients in the specific problem being investigated. For example, if channels on the SL membrane are highly sensitive to the calcium concentration, then the subsarcolemmal space should be modeled as being narrow.
We have reduced the three-dimensional model of the calcium transients in a half-sarcomere of a cardiac cell, into a compartmental model. We showed that significant calcium gradients occur in all compartments used in our compartmental model, apart from the terminal SR. This suggests that making the assumption that compartments are well mixed may not be a valid approach. However, by modifying only the parameters governing diffusion between compartments, we were able to find a good fit to the results from the three-dimensional model. This shows that despite the fact that spatial variation in calcium concentration is present within compartments, compartmental models are capable of producing results very similar to those from more complex models that take into account this spatial variation.
However, such agreement is not robust to changes in the input. In Fig. 11 we increased the frequency of the L-type channel current, and compared the three-dimensional and compartmental model results using the original fit parameters, and found the agreement between the two models had been significantly reduced. Also, in Fig. 13 we shifted the RyR and L-type channels so they were no longer aligned, and this reduced the agreement between the two models. This shows that care needs to be taken when using compartmental models as their accuracy can be affected when model components are modified.
We determined the parameters governing diffusion between compartments in the compartmental model by fitting to the results of the three-dimensional model. We can estimate these parameters using the formula rx/y = DA/L from Keener and Sneyd [15], where D is the diffusion coefficient, A is the area through which diffusion occurs and L is the distance which the substance diffuses across. These estimated values are rcleft/sub = 4.71 × 10⁻¹⁸ L/ms, rsub/cyt = 7.61 × 10⁻¹⁶ L/ms and rsr/term = 2.19 × 10⁻¹⁹ L/ms. These estimates are smaller than the values found by fitting to the three-dimensional model. This is because the estimates assume that there are no calcium gradients in the compartments. In the three-dimensional model there are significant calcium gradients, and these help to drive the diffusion of calcium between compartments. The steep calcium gradients that occur across the cleft to the subsarcolemmal space and across the SR to the terminal SR cause the estimates for rcleft/sub and rsr/term to differ from the fitted values by approximately a factor of ten. The gradients between the subsarcolemmal space and the cytosol are shallower, and so the estimate for rsub/cyt differs from the fitted value by only a factor of approximately two.
Peskoff and Langer [17] developed a model of calcium movement within a half sarcomere, which is also based on a cylindrical geometry, simplified by assuming rotational symmetry. Inside the diadic cleft, they assume calcium is only dependent on the radial coordinate, because diffusion in the radial direction is orders of magnitude slower than diffusion in the longitudinal direction. The cleft is modeled as a small cylinder, located at the top center of the larger cylinder, which represents the cytosol. The concentration of calcium inside the SR is not modeled. Our model includes spatial information in the longitudinal direction inside the cleft. We have included a compartment inside the half-sarcomere which represents the SR, and have modeled the calcium concentration inside it. Release of calcium from the SR in the model of Peskoff and Langer is fixed, and is given by the amount estimated to achieve near maximum force. In our model, SR calcium release is dependent on the calcium concentrations in the SR and the cleft, as well as the open probability of the receptor.
Rice et al. [21] include stochastic models of the flux through the RyR. This is achieved by assigning transitional probabilities between the states of the RyR model, and running Monte Carlo simulations. This enables the model to reproduce calcium sparks, which are localized releases of calcium from the SR. Inclusion of a stochastic model of the RyR within our model is intended for future work.
Bers [4] shows that at a concentration of 15 μmol/L Cyt, there is, on average, only 1 free calcium ion inside the diadic cleft. This suggests that rather than modeling calcium in the cleft as a continuous quantity, as we have done, the stochastic behaviour of individual ions should be modeled. Soeller and Cannell [28] have constructed a Monte Carlo model of calcium movement and bindings inside the diadic cleft, along with a stochastic model of the RyR, to study variability in the time course of calcium sparks. Because such computations are extremely time-consuming, we shall compare the results of our model to the results of the full Monte-Carlo simulation to determine how well the discrete reality can be approximated by a continuous model. One possibility is to construct coupled discrete/continuous homogenised/non-homogenised models, in which the calcium concentration in the cleft is modeled discretely, the calcium in the cytosol is modeled continuously, while the homogenised/non-homogenised nature of the present model is retained.
In the past the model of the SERCA pump has frequently been a simple Hill equation [7, 16, 22], or the Hill equation with modifications to account for modulation by SR (or endoplasmic reticulum (ER) in non-excitable cells) calcium concentration [9, 26]. Higgins et al [12] have used a four state model of the SERCA pump, and have investigated the effect of including the buffering effect of the pump, in a compartmental model of a non-excitable cell. When the pump transports calcium ions between the cytosol and the SR/ER, some of the ions are bound to the pump protein. They are neither in the cytosol or the SR/ER, so are being buffered by the pump. Higgins et al [12] found that the buffering SERCA pump slowed calcium oscillations and significantly reduced their amplitude. Here we have included the same buffering SERCA pump in our three-dimensional model of a half-sarcomere in a cardiac cell. Again we see that using the buffering SERCA pump in place of the non-buffering SERCA pump, with the same concentration of pump protein, has resulted in a large decrease in the amplitude of the transient. Increasing the concentration of pump protein has resulted in a further decrease. Note that here the oscillation frequency is not affected as it is controlled by the electrical stimulation. Further exploration of a buffering SERCA pump model can be found in [12].
In our model of the NCX, the allosteric effect of calcium is assumed to act instantaneously. To be more accurate, it should contain a kinetic delay. We found that adding a delay to the allosteric factor had almost no effect on the results, because the value of KmCaact used here is small compared to the calcium concentration attained during a transient (computations not shown). We increased KmCaact to 0.2 μmol/L Cyt and then found that adding a delay to the allosteric factor caused the peak in NCX current to be reduced, provided the delay was not small compared to the time to peak of the calcium transient. This is because the NCX were not able to react immediately to the increase in cytosolic calcium concentration. Note that the value of KmCaact used depends on the positioning of the NCX. For example, Hilgemann et al. [13] use a much higher value, which may be more appropriate if the NCX are located primarily in the diadic cleft, where higher calcium concentrations are attained.
Acknowledgments
The authors thank Tom Shannon and Christian Soeller for help and useful discussions.
E.R.H. was supported by the Tertiary Education Commission’s Top Achiever Doctoral Scholarship. P.G. was supported by the National Science Foundation under Agreement No. 0112050. J.L.P and D.M.B were supported by NIH grant HL30077 (to DB). M.B.C. was supported by the Health Research Council of New Zealand. J.S. was supported by the Marsden Fund of the Royal Society of New Zealand.
Appendix: Fluxes used in the Model Equations
A.1 SERCA Pump
To derive the model for the flux through the buffering SERCA pump, we begin with the diagram in Fig 15 A, which gives the state diagram for the SERCA pump. We use this to write down the equations for the pump states and the boundary condition across the SR membrane. We use a quasi-steady state approximation to reduce the pump model to a two-state system, and then apply the homogenisation method given by [11] to form the equations in the homogenised region.
Figure 15.
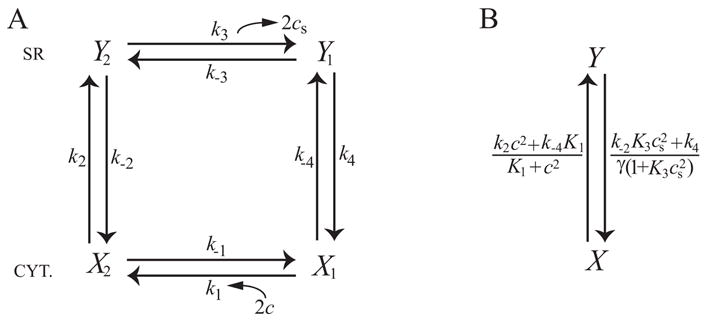
A: State diagram of the SERCA pump. X1 gives the surface density of pump protein on the cytosolic side with no calcium bound, X2 gives the surface density of pump protein on the cytosolic side with 2 calcium ions bound and Y1 and Y2 are analogous on the SR side. B: Reduced state diagram of the SERCA pump, formed by assuming the rate constants k1, k−1, k3 and k−3 are fast. X gives the surface density of pump protein on the cytosolic side, and Y gives the surface density on the SR side.
Using Fig. 15 A, the equations for the pump states and the SR boundary condition are given by:
| (6) |
| (7) |
where . Pε gives the concentration of pump protein in a cube with side length ε as shown in Fig. 1. gives the ratio of volume to SR surface area in the cube in Fig. 1. then gives the surface density of pump protein on the SR membrane. Using our geometry, σ = 12k(1 − k).
This system of equations models a SERCA pump which is able to buffer calcium. We know the transitions between X1 and X2 and between Y1 and Y2 are fast, and we can use this knowledge to simplify the system. Because the transitions are fast, we use a quasi-steady state approximation. We assume k1c2X1 = k−1X2 and and let X = X1 + X2, Y = Y1 + Y2, and . The state diagram for the new system is shown in Fig 15 B.
The differential equation for the pump variable X is derived in the following way:
The boundary condition on the cytosolic side is derived by writing Eq. 6 as the pump flux at steady state, minus the rate at which cytosolic calcium is bound to the pump. That is, if the pump did not buffer calcium and therefore each of the four transitions in the cycle took place at the same rate, then the flux into the cytosol could be written as 2k−2Y2 − 2k2X2. However, because we wish to model a pump which buffers calcium, we subtract from this term the rate at which cytosolic calcium is buffered by pump, namely . Here, the four transitions do not in general take place at the same rate, and so calcium is able to accumulate on the pump. We give the final form of the boundary condition with the factor of ε multiplying the right hand side. This is so it is in the correct form for applying the homogenisation technique given by [11]. Here .
Similarly, the boundary condition on the SR side is derived by writing Eq. 7 as the pump flux at steady state, minus the rate at which SR calcium is bound to the pump.
We now use the homogenisation technique given by [11] to give the SERCA flux in the homogenised region. Here f(c, cs) and F (c, cs) denote all the other reactions in the cytosol and SR respectively, namely diffusion and buffering. The diffusion coefficients in the homogenised region are given by D̃c and D̃s and are calculated from the diffusion coefficients in the non-homogenised region. After homogenisation, the differential equation for c is:
| (8) |
Where β gives the surface area of the SR in the cube in Fig. 1, after it has been scaled to have unit volume. Therefore β = σ. γc gives the fraction of the cube in Fig. 1 that is occupied by the cytosol.
We now use and (so Pc and Xc are cytosolic concentrations) to rewrite Eq. 8 as:
Similarly, after homogenisation, the differential equation for cs is:
which we rewrite as:
where γs gives the fraction of the cube in Fig. 1 that is occupied by the SR and γ=γc/γs. The differential equations in the homogenised region are then:
To derive the model for the non-buffering SERCA pump, we take the limit as the rate constants k2, k−2, k4 and k−4 tend to infinity, while the concentration of pump protein, Pc, tends to zero. The details are given by Higgins et al [12]. The non-buffering SERCA pump model is given by:
in the homogenised region. To calculate the boundary flux on the SR boundary (boundary d in Fig. 4) in the non-homogenised region, we need to assume a value for ε. We choose length l in Fig. 1 to be the height of the terminal SR in the non-homogenised region (that is, the length of boundary d in Fig. 4), which is 0.085 μm. Psd is then given by where and the boundary flux for the non-buffering SERCA pump is given by:
Note that when the buffering SERCA pump is used in the model, the flux across the SR boundary in the non-homogenised region (boundary d in Fig. 4) is given by the non-buffering SERCA pump as this boundary is small and has little effect on the results.
The SERCA pump rate constants are determined as follows:
The dimensionless parameter s represents the speed of the buffering SERCA pump. The SERCA pump rate constants k2, k−2, k4 and k−4 are each proportional to s. We keep the pumping capacity, which we define as the product of s with Pc, constant. When Pc is given a value, this determines the value of s, which in turn determines the value of the rate constants. The flux though the non-buffering SERCA pump is not affected by the value of s. [ATP] is the concentration of adenosine triphosphate, [ADP] is the concentration of adenosine diphosphate and [P] is the concentration of phosphate.
We have used the Gibbs free energy of hydrolysis of ATP to constrain the SERCA pump rate constants, and this results in the expression for k−2 given above. The constraint is given by:
where is Gibbs Free Energy for the hydrolysis of ATP, R is the universal gas constant, T is temperature, K2 = k−2/k2 and K4 = k−4/k4. We use , R = 8.314 × 10⁻³ KJ/(mol°K) and T = 310 °K, so the condition becomes:
k−2 is then k̃−2s.
A.2 Background Flux
The background flux is assumed to be a simple linear function of the potential difference across the cell membrane, and is given by:
where
is the Nernst potential of calcium. co is the extracellular calcium concentration, R is the universal gas constant, T is temperature, F is Faraday’s constant and V is voltage (see Membrane Voltage).
A.3 SL pump
Because the SL calcium pump is of so little importance, pumping at most around 2% of the total calcium during a transient, we just model it with a simple Hill equation, with Hill coefficient HSL:
A.4 Sodium-Calcium Exchanger
We use a Markov state model for the sodium-calcium exchanger (NCX), similar to widely used models of the sodium-potassium exchanger [1, 25]. The flux through the NCX is derived from Fig. 16 by assuming the system is in steady-state. We have included the allosteric factor (Allo), which is given in [34] and models the allosteric regulation of the exchanger current by cytosolic calcium. The flux is given by:
where
co is the extracellular calcium concentration and ni and no are the cytosolic and extracellular sodium concentrations respectively, which are assumed to be fixed and known.
A conformational change (i.e. a change from the inside to the outside, or vice versa) of the protein requires that a free energy barrier be crossed. Therefore, the rate constants k3, k−3, k4 and k−4, are dependent on the membrane potential, V. The dependence is as given in [15].
F is Faraday’s constant, R is the universal gas constant and T is temperature. The membrane potential, V, is given in Membrane Voltage.
A.5 L-type Channel Current
This is given as input and is shown in Fig. 17, which gives the combined flux through all L-type channels. That is, it gives the L-type flux integrated over boundary a in Fig. 4 B.
A.6 Ryanodine Receptors
The model of the RyR open probability is based on the gating scheme given by Shannon et al. [24] shown in Fig. 18, where
Figure 18.
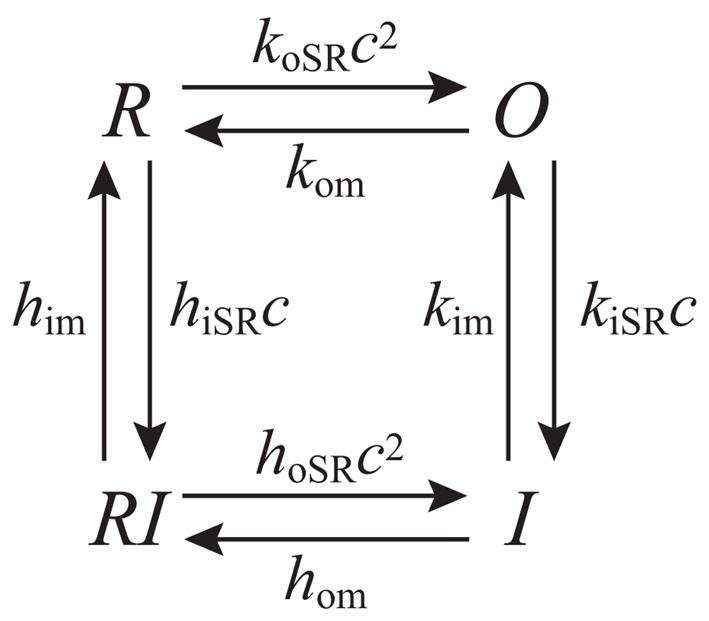
The RyR gating scheme given by Shannon et al. [24]. O gives the open probability of the RyR and there is no calcium release in the other three states. c gives the calcium concentration in the cleft.
The gating scheme is used to form the following system of equations, which governs the RyR dynamics:
O gives the RyR open probability, and the flux through the RyR is given by:
A.7 Membrane Voltage
The sodium-calcium exchanger and the background flux both depend on the voltage across the membrane. This is given as a fixed input, which is shown in Fig. 19.
A.8 Parameter Values
Tables 2–7 give the parameter values used in the model equations and the flux terms.
Footnotes
Publisher's Disclaimer: This is a PDF file of an unedited manuscript that has been accepted for publication. As a service to our customers we are providing this early version of the manuscript. The manuscript will undergo copyediting, typesetting, and review of the resulting proof before it is published in its final citable form. Please note that during the production process errors may be discovered which could affect the content, and all legal disclaimers that apply to the journal pertain.
References
- 1.Apell HJ. Electrogenic properties of the Na,K pump. J Membr Biol. 1989;110:103–114. doi: 10.1007/BF01869466. [DOI] [PubMed] [Google Scholar]
- 2.Augustine GJ, Santamaria F, Tanaka K. Local Calcium Signaling in Neurons. Neuron. 2003;40:331–346. doi: 10.1016/s0896-6273(03)00639-1. [DOI] [PubMed] [Google Scholar]
- 3.Bensoussan A, Lions JL, Papanicolaou G. Asymptotic Analysis for Periodic Structures. North Holland Science Publishers; New York: 1978. [Google Scholar]
- 4.Bers DM. Excitation-Contraction Coupling and Cardiac Contractile Force. 2. Kluwer Academic Publishers; 2001. [Google Scholar]
- 5.Blum JJ, Lawler G, Reed M, Shin I. Effect of cytoskeletal geometry on intracellular diffusion. Biophys J. 1989;56:995–1005. doi: 10.1016/S0006-3495(89)82744-4. [DOI] [PMC free article] [PubMed] [Google Scholar]
- 6.Chen KC, Nicholson C. Changes in brain cell shape create residual extracellular space volume and explain tortuosity behavior during osmotic challenge. Proc Natl Acad Sci (USA) 2000;97:8306–8311. doi: 10.1073/pnas.150338197. [DOI] [PMC free article] [PubMed] [Google Scholar]
- 7.Dupont G, Goldbeter A. One-pool model for Ca2+ oscillations involving Ca2+ and inositol 1,4,5-trisphosphate as co-agonists for Ca2+ release. Cell Calcium. 1993;14:311–322. doi: 10.1016/0143-4160(93)90052-8. [DOI] [PubMed] [Google Scholar]
- 8.el-Kareh AW, Braunstein SL, Secomb TW. Effect of cell arrangement and interstitial volume fraction on the diffusivity of monoclonal antibodies in tissue. Biophys J. 1993;64:1638–1646. doi: 10.1016/S0006-3495(93)81532-7. [DOI] [PMC free article] [PubMed] [Google Scholar]
- 9.Favre CJ, Schrenzel J, Jacquet J, Lew DP, Krause KH. Highly supralinear feedback inhibition of Ca2+ uptake by the Ca2+ load of intracellular stores. J Biol Chem. 1996;271:14925–14930. doi: 10.1074/jbc.271.25.14925. [DOI] [PubMed] [Google Scholar]
- 10.Greenstein JL, Winslow RL. An integrative model of the cardiac ventricular myocyte incorporating local control of Ca2+ release. Biophys J. 2002;83:2918–2945. doi: 10.1016/S0006-3495(02)75301-0. [DOI] [PMC free article] [PubMed] [Google Scholar]
- 11.Goel P, Friedman A, Sneyd J. Homogenization of the cell cytoplasm: the calcium bidomain equations. SIAM J on Multiscale Modeling and Simulation. 2006 in press. [Google Scholar]
- 12.Higgins ER, Cannell MB, Sneyd J. A Buffering SERCA Pump in Models of Calcium Dynamics. Biophys J. 2006;91:151–163. doi: 10.1529/biophysj.105.075747. [DOI] [PMC free article] [PubMed] [Google Scholar]
- 13.Hilgemann DW, Collins A, Matsuoka S. Steady-State and Dynamic Properties of Cardiac Sodium-Calcium Exchange: Secondary Modulation by Cytoplasmic Calcium and ATP. J Gen Physiol. 1992;100:933–961. doi: 10.1085/jgp.100.6.933. [DOI] [PMC free article] [PubMed] [Google Scholar]
- 14.Jafri MS, Rice JJ, Winslow RL. Cardiac Ca2+ Dynamics: The Roles of Ryanodine and Sarcoplasmic Reticulum Load. Biophys J. 1998;74:1149–1168. doi: 10.1016/S0006-3495(98)77832-4. [DOI] [PMC free article] [PubMed] [Google Scholar]
- 15.Keener JP, Sneyd J. Mathematical Physiology. Springer-Verlag; 1998. [Google Scholar]
- 16.LeBeau AP, Yule DI, Groblewski GE, Sneyd J. Agonist-dependent Phosphorylation of the Inositol 1,4,5-Trisphosphate Receptor: A Possible Mechanism for Agonist-specific Calcium Oscillations in Pancreatic Acinar Cells. J Gen Physiol. 1999;113:851–871. doi: 10.1085/jgp.113.6.851. [DOI] [PMC free article] [PubMed] [Google Scholar]
- 17.Peskoff A, Langer GA. Calcium Concentration and Movement in the Ventricular Cardiac Cell during an Excitation-Contraction Cycle. Biophys J. 1998;74:153–174. doi: 10.1016/S0006-3495(98)77776-8. [DOI] [PMC free article] [PubMed] [Google Scholar]
- 18.Pogwizd SM, Qi M, Yuan WL, Samarel AM, Bers DM. Upregulation of Na/Ca exchanger expression and function in an arrhythmogenic rabbit model of heart failure. Circ Res. 1999;85:1009–1019. doi: 10.1161/01.res.85.11.1009. [DOI] [PubMed] [Google Scholar]
- 19.Puglisi JL, Bers DM. LabHEART: an interactive computer model of rabbit ventricular myocyte ion channels and Ca transport. Am J Physiol. 2001;281:C2049–C2060. doi: 10.1152/ajpcell.2001.281.6.C2049. [DOI] [PubMed] [Google Scholar]
- 20.Puglisi JL, Wang F, Bers DM. Modeling the isolated cardiac myocyte. Prog Biophys Mol Biol. 2004;85:163–178. doi: 10.1016/j.pbiomolbio.2003.12.003. [DOI] [PubMed] [Google Scholar]
- 21.Rice JJ, Jafri MS, Winslow RL. Modeling gain and gradedness of Ca2+ release in the functional unit of the cardiac diadic space. Biophys J. 1999;77:1871–1884. doi: 10.1016/s0006-3495(99)77030-x. [DOI] [PMC free article] [PubMed] [Google Scholar]
- 22.Schuster S, Marhl M, Hofer T. Modelling of simple and complex calcium oscillations. From single-cell responses to intercellular signalling. Eur J Biochem. 2002;269:1333–1355. doi: 10.1046/j.0014-2956.2001.02720.x. [DOI] [PubMed] [Google Scholar]
- 23.Shannon TR, Bers DM. A mathematical model describes the SR load-dependence of Ca dynamics in cardiac myocytes. Biophys J. 2001;80:594a. [Google Scholar]
- 24.Shannon TR, Weber C, Puglisi J, Wang F, Bers DM. A Mathematical Treatment of Integrated Ca Dynamics within the Ventricular Myocyte. Biophys J. 2004;87:3351–3371. doi: 10.1529/biophysj.104.047449. [DOI] [PMC free article] [PubMed] [Google Scholar]
- 25.Smith NP, Crampin EJ. Development of models of active ion transport for whole-cell modelling: cardiac sodium-potassium pump as a case study. Prog Biophys Mol Biol. 2004;85:387–405. doi: 10.1016/j.pbiomolbio.2004.01.010. [DOI] [PubMed] [Google Scholar]
- 26.Sneyd J, Tsaneva-Atanasova K, Bruce JIE, Straub SV, Giovannucci DR, Yule DI. A Model of Calcium Waves in Pancreatic and Parotid Acinar Cells. Biophys J. 2003;85:1392–1405. doi: 10.1016/S0006-3495(03)74572-X. [DOI] [PMC free article] [PubMed] [Google Scholar]
- 27.Snyder SM, Palmer BM, Moore RL. A mathematical model of cardiocyte Ca2+ dynamics with a novel representation of sarcoplasmic reticular Ca2+ control. Biophys J. 2000;79:94–115. doi: 10.1016/S0006-3495(00)76276-X. [DOI] [PMC free article] [PubMed] [Google Scholar]
- 28.Soeller C, Cannell MB. A Monte Carlo Model of Ryanodine Receptor Gating in the Diadic Cleft of Cardiac Muscle. Biophys J. 82:76a. [Google Scholar]
- 29.Soeller C, Cannell MB. Numerical simulation of local calcium movements during L-type calcium channel gating in the cardiac diad. Biophys J. 1997;73:97–111. doi: 10.1016/S0006-3495(97)78051-2. [DOI] [PMC free article] [PubMed] [Google Scholar]
- 30.Soeller C, Cannell MB. Analysing cardiac excitation-contraction coupling with mathematical models of local control. Prog Biophys Mol Biol. 2004;85:141–162. doi: 10.1016/j.pbiomolbio.2003.12.006. [DOI] [PubMed] [Google Scholar]
- 31.Stern MD. Theory of excitation-contraction coupling in cardiac muscle. Biophys J. 1992;63:497–517. doi: 10.1016/S0006-3495(92)81615-6. [DOI] [PMC free article] [PubMed] [Google Scholar]
- 32.Stern MD. The Model of Snyder et al. Does Not Simulate Graded Ca2+ Release from the Cardiac Sarcoplasmic Reticulum in Intact Cells. Biophys J. 2000;79:3353–3354. doi: 10.1016/S0006-3495(00)76567-2. [DOI] [PMC free article] [PubMed] [Google Scholar]
- 33.Stern MD, Song L, Cheng H, Sham JSK, Yang HT, Boheler KR, Ríos E. Local Control Models of Cardiac Excitation-Contraction Coupling: A Possible Role for Allosteric Interactions between Ryanodine Receptors. J Gen Physiol. 1999;113:469–489. doi: 10.1085/jgp.113.3.469. [DOI] [PMC free article] [PubMed] [Google Scholar]
- 34.Weber CR, Ginsburg KS, Philipson KD, Shannon TR, Bers DM. Allosteric Regulation of Na/Ca Exchange Current by Cytosolic Ca in Intact Cardiac Myocytes. J Gen Physiol. 2001;117:119–131. doi: 10.1085/jgp.117.2.119. [DOI] [PMC free article] [PubMed] [Google Scholar]
- 35.Zahradníková A, Zahradník I. A Minimal Gating Model for the Cardiac Calcium Release Channel. Biophys J. 1996;71:2996–3012. doi: 10.1016/S0006-3495(96)79492-4. [DOI] [PMC free article] [PubMed] [Google Scholar]


