

Abstract
If surfaces in a scene are to be distinguished by their color, their neural representation at some level should ideally vary little with the color of the illumination. Four possible neural codes were considered: von-Kries-scaled cone responses from single points in a scene, spatial ratios of cone responses produced by light reflected from pairs of points, and these quantities obtained with sharpened (opponent-cone) responses. The effectiveness of these codes in identifying surfaces was quantified by information-theoretic measures. Data were drawn from a sample of 25 rural and urban scenes imaged with a hyperspectral camera, which provided estimates of surface reflectance at 10-nm intervals at each of 1344 × 1024 pixels for each scene. In computer simulations, scenes were illuminated separately by daylights of correlated color temperatures 4000 K, 6500 K, and 25,000 K. Points were sampled randomly in each scene and identified according to each of the codes. It was found that the maximum information preserved under illuminant changes varied with the code, but for a particular code it was remarkably stable across the different scenes. The standard deviation over the 25 scenes was, on average, approximately 1 bit, suggesting that the neural coding of surface color can be optimized independent of location for any particular range of illuminants.
Keywords: Information capacity, Natural scenes, Color constancy, Color vision, Spectral sharpening, Cone opponency
Introduction
What limits our ability to identify surfaces by their color despite changes in the color of the light on the scene? The answer to this deceptively simple question depends on several factors, including how many differently colored surfaces there are in a scene, how surface colors are coded neurally, and how well such codings serve to label uniquely objects under different lights. It is clear that if just two surfaces are sampled from a variegated scene, there is very little risk of confusion: in general, their spectral reflectances will be different; their codings under a given illuminant will be different; and this difference will persist when the illuminant is changed. But, as the number of samples increases, the risk of confusion increases. This is because the chance of similar spectral reflectances being selected increases, and, as surface-color codings are not perfectly invariant under illuminant changes, they are increasingly unlikely to preserve the smaller differences between some samples. These are, of course, physically determined limits on identification, and, in practice, performance will also depend on a variety of procedural, cognitive, and other factors.
The aim of this study was to obtain an estimate of the upper limits on neural identification performance with some representative natural scenes. To this end, points were sampled from rural and urban scenes under different daylights and the reflected light at each point given one of four approximately illuminant-invariant neural codes, based on von-Kries adaptation, spatial ratios of cone responses, and these quantities obtained with sharpened (opponent-cone) responses (see e.g. Wandell, 1995; Maloney, 1999; Hurlbert &Wolf, 2004). The success of each code in allowing these samples or pairs of samples to be identified under different illuminants was quantified by information-theoretic methods. The principal measure of performance was the information capacity, which represents how much information in bits is preserved across the illuminant change. As explained later, information capacity has certain advantages over a measure such as the proportion of correct identifications, used in an earlier analysis of a different set of images (Nascimento et al., 2002).
It was found that for each scene tested, the maximum information preserved under illuminant changes varied with the code, but for any particular code the variation over the scenes tested was small, with a standard deviation of approximately 1 bit. A possible implication of this result for the optimization of visual performance in natural scenes is briefly considered.
Methods
Image acquisition
A high-spatial-resolution hyperspectral imaging system was used to acquire data from 25 rural and urban scenes in the Minho region of Portugal, which has a temperate climate and variety of vegetation and natural rock formations. Details of an earlier version of this system have been given in Nascimento et al. (2002). The present system used a low-noise Peltier-cooled digital camera providing a spatial resolution of 1344 ×1024 pixels (Hamamatsu, model C4742-95-12ER, Hamamatsu Photonics K.K., Japan) with a fast tunable liquid-crystal filter (VariSpec, model VS-VIS2-10-HC- 35-SQ, Cambridge Research & Instrumentation, Inc., MA) mounted in front of the lens, together with an infrared blocking filter. Focal length was typically set to 75 mm and aperture to f/16 or f/22 to achieve a large depth of focus. The line-spread function of the system was close to Gaussian with standard deviation approx. 1.3 pixels at 550 nm. The intensity response at each pixel, recorded with 12-bit precision, was linear over the entire dynamic range. The peak-transmission wavelength was varied in 10-nm steps over 400–720 nm and the bandwidth (FWHM) was 10 nm at 550 nm, decreasing to 7 nm at 400 nm and increasing to 16 nm at 720 nm. Spectral calibration was verified against test samples in a similar way to that described in Nascimento et al. (2002).
Images of scenes were obtained during the summers of 2002 and 2003, almost always under a clear sky. Particular care was taken to avoid scenes containing movement. Before image acquisition, the exposure at each wavelength was determined by an automatic routine so that maximum pixel output was within 86– 90% of saturation. Immediately after acquisition, the reflected spectrum from a small flat gray (Munsell N5 or N7) reference surface in the scene was recorded with a telespectroradiometer (SpectraColorimeter, PR-650, Photo Research Inc., Chatsworth, CA), the calibration of which was traceable to the National Physical Laboratory. Images were corrected for dark noise, spatial nonuniformities (mainly off-axis vignetting), stray light, and any wavelength-dependent variations in magnification or registration. Spectral-reflectance functions at each pixel were estimated by normalizing the corrected signal against that obtained from the gray reference surface. Initially, the illumination was assumed to be spatially uniform in all scenes; the effect of indirect illumination is considered later.
Color pictures (reconstructed from reflectance data) of some typical scenes are shown in Fig. 1.
Fig. 1.

Examples of color pictures obtained from a sample of 25 hyperspectral images of rural and urban scenes.
Cone responses
Responses of long-, medium-, and short-wavelength-sensitive cones at each point (pixel) in each scene were calculated from the Smith and Pokorny set of fundamentals (Smith & Pokorny, 1972, 1975) for daylight illuminants with correlated color temperatures 25,000 K, 6500 K, and 4000 K. Thus, if the illuminant spectrum is E(λ) and the spectral reflectance at a point is R(λ), then the activity in long-, medium-, and short-wavelength-sensitive cones with spectral sensitivities Q(λ) = L(λ), M(λ), and S(λ), respectively, is given by q = ∫ E(λ)R(λ)Q(λ) dλ, evaluated over the wavelength range 400 nm ≤ λ ≤ 720 nm. To control for the effect of direct and indirect illumination, calculations were performed with and without cropping of shadows in the scenes (Nascimento et al., 2002).
Surface-color codes
Four possible codes for surface color were tested: (1) a “gray-world” von-Kries code in which each cone signal qi at a point i in the scene was divided by the mean for that cone class over all points sampled in the scene (Buchsbaum, 1980; West & Brill, 1982); (2) a spatial ratio of cone responses in which the cone excitation qi at a point i was divided by the cone excitation qj from the same cone class at another randomly chosen point j in the scene (Foster & Nascimento, 1994; Nascimento et al., 2002); (3) a spectrally sharpened version of (1) in which the cone spectral sensitivities Q were replaced by those from opponent combinations of cone responses (Buchsbaum & Gottschalk, 1983; Foster & Snelgar, 1983a; Finlayson et al., 1994), as detailed later; and (4) an analogous spectrally sharpened version of (2). To avoid extreme values of ratios in (2) and (4) distorting variance estimates, pairs of points (i, j) were omitted when the divisors qj were less than a threshold value α max(qi) with α = 0.01 (other values of α were also tested).
The codes in (1) and (3) provide information about the color of single surfaces and the codes in (2) and (4) provide information about the relationship of surface colors, corresponding to the perceptual phenomena of color constancy and relational color constancy (Foster & Nascimento, 1994; Nascimento & Foster, 1997). Despite the sample points i and j in (2), and in (4), being chosen randomly, spatial ratios of cone excitations (and their post-receptoral combinations) are almost invariant under changes in illuminant (Foster & Nascimento, 1994; Nascimento et al., 2002). They have been argued to underlie the constancy of perceived color relations under illuminant changes in complex scenes (Craven & Foster, 1992; Foster & Nascimento, 1994; Nascimento & Foster, 1997), and used to explain performance in asymmetric color matching (Tiplitz Blackwell & Buchsbaum, 1988; Nascimento et al., 2004), as well as the spatially parallel detection of violations in color constancy (Foster et al., 2001) and the judgment of transparency (Westland & Ripamonti, 2000; Ripamonti &Westland, 2003). They provide a compelling cue for distinguishing between illuminant and reflectance changes in scenes with multiple surfaces (Nascimento & Foster, 1997).
The invariance to illuminant changes produced by von-Kries scaling is incomplete (West & Brill, 1982; D'Zmura & Lennie, 1986), as is that by spatial ratios (Foster & Nascimento, 1994; Nascimento et al., 2002), but the effectiveness of each can be improved (Finlayson et al., 1994) by applying them to sharpened sensor spectral sensitivities L#, M#, and S# derived from opponent interactions, mainly between long- and medium-wavelength-sensitive cones with little involvement of short-wavelength-sensitive cones (Sperling & Harwerth, 1971; Foster, 1981; Foster & Snelgar, 1983b). These interactions can be modeled linearly, both at the neural level in macaque monkeys (e.g. Shapley et al., 1981; Lee et al., 1993) and behaviorally in rhesus monkeys (Sperling & Harwerth, 1971) and humans (Foster & Snelgar, 1983a). On theoretical grounds, optimum weights for sensor sharpening have been calculated by Finlayson et al. (1994) as L# = 2.5L − 2.0M + 0.1S for long-wavelength-sensitive mechanisms, M# = 1.6M − 0.7L − 0.1S for medium-wavelength-sensitive mechanisms, and S# = 1.0S − 0.1M + 0.1L for short-wavelength-sensitive mechanisms. Their peaks coincide with those observed psychophysically (Foster & Snelgar, 1983b), and these weights were the ones used here. Receptoral and post-receptoral components of adaptation were not distinguished (Webster & Mollon, 1995).
These codes are neither exhaustive nor necessarily optimal (nor do they involve the spatial domain (cf. Ruderman et al., 1998)), but they are broadly representative (Maloney, 1999; Hurlbert & Wolf, 2004). Although (1) and (3) refer to single points and (2) and (4) refer to pairs of points, both depend on scaling cone signals. That is, in von-Kries coding each cone's response is normalized by the responses across all the points sampled in the scene, whereas in spatial-ratio coding each cone's response is normalized by the response at another, single, randomly selected point. These two models therefore represent two extremes of the spatial extent over which cone responses are normalized. Without averaging, color-code values from spatial ratios might therefore be expected to be more variable than those from von-Kries scaling.
Information-theoretic measures
First consider the following simple representation of identification performance. Suppose that for a fixed pair of illuminants E1 and E2 (e.g. 25,000 K and 6500 K) and surface-color code (e.g. von-Kries-scaled responses), n points (pixels) are drawn at random, without replacement, from a selected scene. Suppose that each point under illuminant E2 is paired with a point under illuminant E1 having the closest color-code value. Depending on several factors, this identification may or may not be correct. In an earlier analysis of spatial ratios of cone excitations (Nascimento et al., 2002, p. 1488), the probability p of making a correct identification of pairs of regions (pixels) within scenes was estimated for just two sizes of samples, n = 100 and n = 1000, but larger, limiting values of n were not tested (nor was the separate question of the probability of making a correct identification of single rather than pairs of regions). Critically, this measure of performance does not fully summarize the information preserved; for the probability of making an error can have the same value whether the error is small or large (i.e. whether the incorrectly identified point is close to or far from the correct point). But if the error is small, more information is preserved than when the error is large. In other words, estimates of the probabilities p(i, j) of identifying point j under illuminant E2 with point i under illuminant E1 are required for all points 1 ≤ i, j ≤ n, and not just the single value p = p(i, i) averaged over all i.
A more comprehensive measure of identification performance across illuminants E1 and E2 is provided by the mutual information I(E1; E2) from information theory (e.g. Cover & Thomas, 1991; MacKay, 2003). Informally, I(E1; E2) represents the reduction in uncertainty about the n sample points under illuminant E1 given knowledge about the points under illuminant E2. More formally, it is defined as follows. If p(i, j) is the probability of identifying point j under illuminant E2 with point i under illuminant E1, then
| (1) |
where and . If the base of the logarithm is 2, then I(E1; E2) is expressed in bits. Numerical estimates will be given later, but for comparison upper limits on the information used by observers have been estimated as 29–58 bits in some attentive-detection tasks (Verghese & Pelli, 1992) and 36–49 bits in a partial-report task (Sperling, 1960).
As the number of sample points n increases, so generally does the mutual information. But difficulties with evaluating the form of the estimate given in eqn. (1) can arise when n is large and the probabilities p(i, j) are small (Brillinger, 2002). Fortunately, when n is so large that the distribution of color-code values may be treated as continuous, an estimate of an upper bound C on I(E1: E2) can be taken from an analysis of the capacity of an additive noise channel, where the noise between input and output corresponds to the differences in code values under illuminants E1 and E2. Suppose for the moment that the noise is distributed normally. Then the capacity of a Gaussian channel has a simple formulation in terms of the quotient of the variances (more generally covariances) of the code values and of the noise (Cover & Thomas, 1991). This quotient corresponds in effect to the number of distinguishable code values.
Suppose, more precisely, that each point in the scene is coded, say, as a triple of scaled cone responses (l1, m1, s1) under illuminant E1, and that under illuminant E2 this triple becomes (l1 + Δl, m1 + Δm, s1 + Δs), so that (Δl, Δm, Δs) is the difference in code values. Let K1 be the covariance of (l1, m1, s1) and KΔ the covariance of (Δl, Δm, Δs), evaluated over the 1,376,256 (1344 × 1024) pixels in the scene. Then the information capacity of the channel is given (Cover & Thomas, 1991) by
| (2) |
where |K| denotes the determinant of K. It is emphasized that eqn. (2) represents an upper bound for a particular color code: if the code values are not distributed normally, then the mutual information is less than C. This formulation involves no contribution from receptoral or neural noise (Vorobyev & Osorio, 1998; Simoncelli & Olshausen, 2001).
If the noise is not distributed normally, then it may still be shown that eqn. (2) cannot be exceeded with normally distributed code values and nearest-neighbor identification (Lapidoth, 1996). In the present analysis, a nonlinear compression of code values was assumed to occur before identification. A logarithmic nonlinearity (Ruderman et al., 1998) and a Naka-Rushton nonlinearity (Naka & Rushton, 1966) produced almost identical decreases in the kurtosis of code values from a mean of 27.7 to −0.1 and of differences in code values (the estimated noise) from a mean of 90.2 to 1.75. Interestingly, this improvement in the normality of the distributions had only a moderate effect on values of C: those obtained with von-Kries scaling actually decreased on average by 0.8 bits, and those with spatial ratios increased on average by 1.4 bits.
Results
Fig. 2 shows the information capacity C in bits for surface identification in scenes under changes in daylight illuminant from a correlated color temperature of 25,000 K to 6500 K. Mean values of C over the 25 scenes are shown for von-Kries scaling of cone responses, the spatial ratio of unscaled cone responses, and those codes with optimally sharpened cone spectral sensitivities, all with logarithmic compression. Table 1 gives the corresponding numerical values for all three illuminant changes, that is, 25,000 K to 6500 K, 4000 K to 6500 K, and 25,000 K to 4000 K. Both sample means and sample standard deviations are shown. The sample standard deviations indicated by an asterisk are inflated owing to the influence of one scene, a close-up of a red rose, which produced low values of C with spatial ratios of sharpened spectra, particularly with the illuminant change 4000 K to 6500 K (where C = 8.2 bits).
Fig. 2.
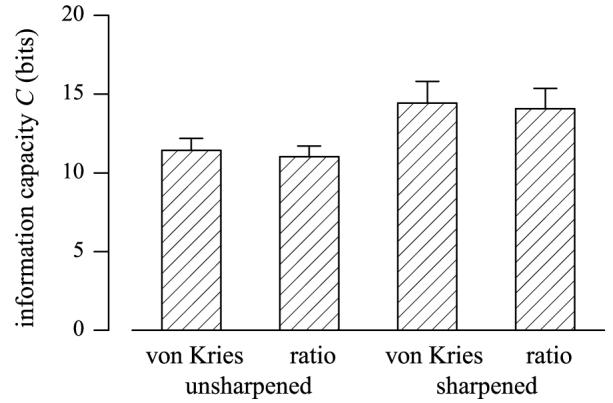
Mean information capacity C, in bits, for surface identification in scenes under daylight changes of correlated color temperature 25,000 K to 6500 K. Coding is by von-Kries scaling of cone responses, the spatial ratio of unscaled cone responses, and those codes with optimally sharpened cone spectral sensitivities. Data based on a sample of 25 rural and urban scenes. Error bars show sample standard deviation.
Table 1.
Information capacity C, in bits, preserved in natural scenes under various changes in daylighta
| Codes with LMS spectra |
Codes with sharpened spectra |
||||
|---|---|---|---|---|---|
| Illuminant change |
von Kries | Spatial ratio | von Kries | Spatial ratio | |
| 25,000 K – 6500 K | Mean C | 11.43 | 11.02 | 14.44 | 14.08 |
| S.D. C | 0.76 | 0.69 | 1.36 | 1.28 | |
| 4000 K – 6500 K | Mean C | 11.78 | 11.37 | 13.90 | 13.40 |
| S.D. C | 0.72 | 0.69 | 1.71* | 1.84* | |
| 25,000 K – 4000 K | Mean C | 8.62 | 8.19 | 11.34 | 10.83 |
| S.D. C | 0.73 | 0.67 | 1.42 | 1.55 | |
Entries show means and sample standard deviations of C for von-Kries scaling of cone responses, the spatial ratio of unscaled cone responses, and those codes with optimally sharpened cone spectral sensitivities. Correlated color temperature of the illuminant changed from 25,000 K to 6500 K, 4000 K to 6500 K, and 25,000 K to 4000K. Data based on a sample of 25 rural and urban scenes each of size 1344 × 1024 pixels.
S.D. ≤ 1.53 if one scene omitted (see text).
For comparison, Table 2 shows the corresponding proportion p of correct identifications for a fixed number of samples n = 100 drawn repeatedly from the 1,376,256 pixels available in each scene. Included in this table are values of p for raw, unscaled cone responses, but still with logarithmic compression (estimates of C provided by eqn. (2) cannot be used with raw responses because the estimated noise does not have zero mean). These values differ from those given in Nascimento et al. (2002), where long-, medium- and short-wavelength-sensitive samples were treated independently. As n increased, the value of p decreased; for example, for an illuminant change of 25,000 K to 6500 K and von-Kries scaling with sharpened spectra, p = 0.96 with n = 100 (penultimate column Table 2), whereas p = 0.52 when n = 10000.
Table 2.
Proportion p of correct identifications of 100 surfaces or pairs of surfaces in natural scenes under various changes in daylighta
| Codes with LMS spectra |
Codes with sharpened spectra |
|||||
|---|---|---|---|---|---|---|
| Illuminant change |
von Kries | Spatial ratio | Raw | von Kries | Spatial ratio | |
| 25,000 K – 6500 K | ||||||
| Mean p | 0.92 | 0.79 | 0.07 | 0.96 | 0.85 | |
| S.D. p | 0.07 | 0.09 | 0.02 | 0.07 | 0.07 | |
| 4000 K – 6500 K | ||||||
| Mean p | 0.91 | 0.79 | 0.05 | 0.93 | 0.80 | |
| S.D. p | 0.08 | 0.10 | 0.02 | 0.11 | 0.09 | |
| 25,000 K – 4000 K | ||||||
| Mean p | 0.75 | 0.59 | 0.04 | 0.85 | 0.67 | |
| S.D. p | 0.13 | 0.13 | 0.01 | 0.13 | 0.11 | |
Entries show means and sample standard deviations of p. Other details are as in Table 1, but with additional data on raw unscaled cone responses with logarithmic compression.
Similar results, not shown here, were obtained with scenes cropped to minimize the effects of shadows (as in Nascimento et al., 2002). Decreasing the threshold α for division in the calculation of cone-excitation ratios from 0.01 to 0.005 (Methods) produced a decrease in the largest value of C for ratios from 14.1 (last column Table 1) to 13.8.
As might be anticipated, a formal repeated-measures analysis of variance of the data summarized in Table 1 showed highly significant effects of spectral sharpening [F(1,24) = 119, P < 0.001], von-Kries scaling versus spatial ratios [F(1,24) = 54.0, P < 0.001], and illuminant change [F(2,48) = 622, P < 0.001]. There was, however, no significant difference between the effects of spectral sharpening on von-Kries scaling and spatial ratios (F(1,24) = 0.67, P = 0.4).
Discussion
Surface color provides a highly reliable signal by which surfaces can be identified despite changes in the illuminant. But there are physical factors limiting neural performance. Expressed in information-theoretic terms, the maximum level of information preserved by von-Kries scaling under changes in daylight was approximately 14 bits for a shift in correlated color temperature of 25,000 K to 6500 K and 4000 K to 6500 K, and 11 bits for a shift of 25,000 K to 4000 K, all with sharpened cone spectral sensitivities. Contrary to expectation, the potentially larger variance associated with spatial ratios of cone excitations produced an only slightly less effective code, by 0.4–0.5 bits, with both sharpened and unsharpened spectra.
Despite the variety in the population of scenes analyzed, the maximum information preserved by any particular surface-color code was remarkably stable over those scenes. For all codes and illuminant changes, the standard deviation in information capacity over scenes varied between 0.7 and 1.5 bits (excluding the close-up rose scene), suggesting an approximate invariance of natural scenes that might be exploited by the visual system. That is, under a particular illuminant change, the amount of information that can be preserved by a particular neural coding of a scene is likely to be within approximately 1 bit of the amount of information that can be preserved by the same coding of any other scene under the same illuminant change.
These results have yet to be confirmed with a larger population of scenes, illuminant changes, and illuminant-invariant codes. Moreover, they represent physical limits on visual performance set by the spectral sensitivities of cone receptors, the spectral reflectances of natural surfaces, and changes in natural illuminant spectra. When noise within the visual pathway and the limitations of memory are taken into account, these limits are likely to decrease. Nevertheless, the present data suggest the possibility that, in general, performance in using color information to identify surfaces within a scene is sufficiently stable that it can be optimized independent of location for any particular range of illuminants.
Acknowledgments
We thank D. J. C. MacKay and S. Panzeri for useful discussions and P. D. Pinto for experimental assistance. This work was supported by the Engineering and Physical Sciences Research Council, UK, and by the Centro de Física da Universidade do Minho, Braga, Portugal.
References
- Brillinger DR. Second-order moments and mutual information in the analysis of time series. In: Chaubey YP, editor. Recent Advances in Statistical Methods; Proceedings of Statistics 2001 Canada: The 4th Conference in Applied Statistics; Montreal, Canada. July 2001; London: Imperial College Press; 2002. pp. 64–76. [Google Scholar]
- Buchsbaum G. A spatial processor model for object colour perception. Journal of the Franklin Institute. 1980;310:1–26. [Google Scholar]
- Buchsbaum G, Gottschalk A. Trichromacy, opponent colours coding and optimum colour information transmission in the retina. Proceedings of the Royal Society B (London) 1983;220:89–113. doi: 10.1098/rspb.1983.0090. [DOI] [PubMed] [Google Scholar]
- Cover TM, Thomas JA. Elements of Information Theory. New York: John Wiley & Sons, Inc.; 1991. [Google Scholar]
- Craven BJ, Foster DH. An operational approach to colour constancy. Vision Research. 1992;32:1359–1366. doi: 10.1016/0042-6989(92)90228-b. [DOI] [PubMed] [Google Scholar]
- D'Zmura M, Lennie P. Mechanisms of color constancy. Journal of the Optical Society of America A. 1986;3:1662–1672. doi: 10.1364/josaa.3.001662. [DOI] [PubMed] [Google Scholar]
- Finlayson GD, Drew MS, Funt BV. Spectral sharpening: Sensor transformations for improved color constancy. Journal of the Optical Society of America A. 1994;11:1553–1563. doi: 10.1364/josaa.11.001553. [DOI] [PubMed] [Google Scholar]
- Foster DH. Changes in field spectral sensitivities of red-, green- and blue-sensitive colour mechanisms obtained on small background fields. Vision Research. 1981;21:1433–1455. doi: 10.1016/0042-6989(81)90215-7. [DOI] [PubMed] [Google Scholar]
- Foster DH, Snelgar RS. Initial analysis of opponent-colour interactions revealed in sharpened field spectral sensitivities. In: Mollon JD, Sharpe LT, editors. Colour Vision: Physiology and Psychophysics. London: Academic Press; 1983a. pp. 303–311. [Google Scholar]
- Foster DH, Snelgar RS. Test and field spectral sensitivities of colour mechanisms obtained on small white backgrounds: action of unitary opponent-colour processes? Vision Research. 1983b;23:787–797. doi: 10.1016/0042-6989(83)90201-8. [DOI] [PubMed] [Google Scholar]
- Foster DH, Nascimento SMC. Relational colour constancy from invariant cone-excitation ratios. Proceedings of the Royal Society B (London) 1994;257:115–121. doi: 10.1098/rspb.1994.0103. [DOI] [PubMed] [Google Scholar]
- Foster DH, Nascimento SMC, Amano K, Arend L, Linnell KJ, Nieves JL, Plet S, Foster JS. Parallel detection of violations of color constancy. Proceedings of the National Academy of Sciences of the U.S.A. 2001;98:8151–8156. doi: 10.1073/pnas.141505198. [DOI] [PMC free article] [PubMed] [Google Scholar]
- Hurlbert A, Wolf K. Color contrast: a contributory mechanism to color constancy. Progress in Brain Research. 2004;144:147–160. doi: 10.1016/s0079-6123(03)14410-x. [DOI] [PubMed] [Google Scholar]
- Lapidoth A. Nearest neighbor decoding for additive non-Gaussian noise channels. IEEE Transactions on Information Theory. 1996;42:1520–1529. [Google Scholar]
- Lee BB, Martin PR, Valberg A, Kremers J. Physiological mechanisms underlying psychophysical sensitivity to combined luminance and chromatic modulation. Journal of the Optical Society of America A. 1993;10:1403–1412. doi: 10.1364/josaa.10.001403. [DOI] [PubMed] [Google Scholar]
- MacKay DJC. Information Theory, Inference, and Learning Algorithms. Cambridge: Cambridge University Press; 2003. [Google Scholar]
- Maloney LT. Physics-based approaches to modeling surface color perception. In: Gegenfurtner KR, Sharpe LT, editors. Color Vision: From Genes to Perception. Cambridge: Cambridge University Press; 1999. pp. 387–416. [Google Scholar]
- Naka KI, Rushton WAH. S-potentials from colour units in the retina of fish (Cyprinidae) Journal of Physiology. 1966;185:536–555. doi: 10.1113/jphysiol.1966.sp008001. [DOI] [PMC free article] [PubMed] [Google Scholar]
- Nascimento SMC, Foster DH. Detecting natural changes of cone-excitation ratios in simple and complex coloured images. Proceedings of the Royal Society B (London) 1997;264:1395–1402. doi: 10.1098/rspb.1997.0194. [DOI] [PMC free article] [PubMed] [Google Scholar]
- Nascimento SMC, Ferreira FP, Foster DH. Statistics of spatial cone-excitation ratios in natural scenes. Journal of the Optical Society of America A. 2002;19:1484–1490. doi: 10.1364/josaa.19.001484. [DOI] [PMC free article] [PubMed] [Google Scholar]
- Nascimento SMC, de Almeida VMN, Fiadeiro PT, Foster DH. Minimum-variance cone-excitation ratios and the limits of relational color constancy. Visual Neuroscience. 2004;21:337–340. doi: 10.1017/s095252380421327x. [DOI] [PubMed] [Google Scholar]
- Ripamonti C, Westland S. Prediction of transparency perception based on cone-excitation ratios. Journal of the Optical Society of America A. 2003;20:1673–1680. doi: 10.1364/josaa.20.001673. [DOI] [PubMed] [Google Scholar]
- Ruderman DL, Cronin TW, Chiao C-C. Statistics of cone responses to natural images: implications for visual coding. Journal of the Optical Society of America A. 1998;15:2036–2045. [Google Scholar]
- Shapley R, Kaplan E, Soodak R. Spatial summation and contrast sensitivity of X and Y cells in the lateral geniculate nucleus of the macaque. Nature. 1981;292:543–545. doi: 10.1038/292543a0. [DOI] [PubMed] [Google Scholar]
- Simoncelli EP, Olshausen BA. Natural image statistics and neural representation. Annual Review of Neuroscience. 2001;24:1193–1216. doi: 10.1146/annurev.neuro.24.1.1193. [DOI] [PubMed] [Google Scholar]
- Smith VC, Pokorny J. Spectral sensitivity of color-blind observers and the cone photopigments. Vision Research. 1972;12:2059–2071. doi: 10.1016/0042-6989(72)90058-2. [DOI] [PubMed] [Google Scholar]
- Smith VC, Pokorny J. Spectral sensitivity of the foveal cone photopigments between 400 and 500 nm. Vision Research. 1975;15:161–171. doi: 10.1016/0042-6989(75)90203-5. [DOI] [PubMed] [Google Scholar]
- Sperling G. The information available in brief visual presentations. Psychological Monographs: General and Applied. 1960;74:1–29. [Google Scholar]
- Sperling HG, Harwerth RS. Red-green cone interactions in the increment-threshold spectral sensitivity of primates. Science. 1971;172:180–184. doi: 10.1126/science.172.3979.180. [DOI] [PubMed] [Google Scholar]
- Tiplitz Blackwell K, Buchsbaum G. Quantitative studies of color constancy. Journal of the Optical Society of America A. 1988;5:1772–1780. doi: 10.1364/josaa.5.001772. [DOI] [PubMed] [Google Scholar]
- Verghese P, Pelli DG. The information capacity of visual attention. Vision Research. 1992;32:983–995. doi: 10.1016/0042-6989(92)90040-p. [DOI] [PubMed] [Google Scholar]
- Vorobyev M, Osorio D. Receptor noise as a determinant of colour thresholds. Proceedings of the Royal Society B (London) 1998;265:351–358. doi: 10.1098/rspb.1998.0302. [DOI] [PMC free article] [PubMed] [Google Scholar]
- Wandell BA. Foundations of Vision. Sunderland, Massachusetts: Sinauer Associates, Inc.; 1995. [Google Scholar]
- Webster MA, Mollon JD. Colour constancy influenced by contrast adaptation. Nature. 1995;373:694–698. doi: 10.1038/373694a0. [DOI] [PubMed] [Google Scholar]
- West G, Brill MH. Necessary and sufficient conditions for Von Kries chromatic adaptation to give color constancy. Journal of Mathematical Biology. 1982;15:249–258. doi: 10.1007/BF00275077. [DOI] [PubMed] [Google Scholar]
- Westland S, Ripamonti C. Invariant cone-excitation ratios may predict transparency. Journal of the Optical Society of America A. 2000;17:255–264. doi: 10.1364/josaa.17.000255. [DOI] [PubMed] [Google Scholar]