

Summary
We report initial characterization of a synthetic family of more than 3,000 cytochrome P450s made by SCHEMA recombination of three bacterial CYP102s. Sixteen heme domains and their holoenzyme fusions with each of the three parental reductase domains were tested for activity on 11 different substrates. The results show that the chimeric enzymes have acquired significant functional diversity, including the ability to accept substrates not accepted by the parent enzymes. K-means clustering analysis of the activity data allowed the enzymes to be classified into five distinct groups based on substrate specificity. The substrates can also be grouped, such that one can be a ‘surrogate’ for others in the group. Fusion of a functional chimeric heme domain with a parental reductase domain always reconstituted a functional holoenzyme, indicating that key interdomain interactions are conserved upon reductase swapping.
Introduction
Enzymes with altered activities and specificities can be generated in the laboratory by processes that mimic mechanisms of natural evolution. Directed evolution combining recombination and random point mutation (e.g. DNA shuffling) is effective in generating both genotypic and phenotypic novelty [1–7]. Although recombination can make many mutations with relatively little structural disruption [8], we do not know the degree of functional diversity that is accessible to a process which only explores combinations of mutations already accepted during natural evolution.
We recently reported construction of a synthetic family of more than 3,000 properly-folded cytochrome P450 heme domains [9]. Assembled by structure-guided recombination of the heme domains of CYP102A1 from Bacillus megaterium (A1) and its homologs CYP102A2 (A2) and CYP102A3 (A3) that exhibit ~65% amino acid identity, the chimeric proteins differ from the parent sequences by 72 out of 463–466 amino acids on average. Our current goal is to understand how this sequence diversification relates to diversification of function. Initial studies [9, 10] demonstrated that recombination, in the absence of point mutations, can generate functional features outside the range exhibited by the parental P450s. For example, a chimeric heme domain significantly more thermostable than any of the parents was identified (T50 = 62°C versus 55°C for the most stable parent) [9]; subsequent analysis of more than 200 chimeric heme domains identified many thermostable proteins [Yougen Li et al. unpublished data]. Our previous study of selected chimeras of the A1 and A2 heme domains showed that chimeragenesis could also generate activities not exhibited by the parents [10], as has also been reported for recombination of mammalian P450s [11, 12].
The biological functions of cytochrome P450s include key roles in drug metabolism, breakdown of xenobiotics, and steroid and secondary metabolite biosynthesis [13]; members of the P450 superfamily catalyze hydroxylation and demethylation reactions on a vast array of substrates [14]. Enzymes from the synthetic P450 family could be useful catalysts for synthesis of biologically-active compounds if they have acquired the ability to accept substrates not accepted by the parent enzymes (which are all fatty acid hydroxylases). Identifying particular desired products, however, usually requires protein purification and HPLC and/or MS analysis, methods that are cumbersome when testing hundreds of biocatalysts. Thus, in addition to exploring the range of catalytic activities in the chimeric P450 family, a second goal of the current study is to determine to what extent ‘surrogate’ substrates can be used to identify likely catalyst candidates for a particular reaction in a high-throughput screening mode. Can substrates be grouped in such a way that activity towards one member of a group can be used to predict activity towards another?
Enzymes of the CYP102 family are comprised of a reductase domain and a heme domain connected by a flexible linker [15, 16]. With a single amino acid substitution (F87A in A1 and F88A in A2 and A3), the heme domains can function alone as peroxygenases, catalyzing oxygen insertion in the presence of hydrogen peroxide [17]. The synthetic CYP102A family was constructed from parental sequences containing this mutation; all of the chimeric proteins can therefore potentially function as peroxygenases. We are also interested in their ability to be reconstituted into functional monooxygenases, utilizing NADPH and molecular oxygen for catalysis, by fusion to a reductase domain. The reductase domain of CYP102A1 (R1) spans ~585 amino acids and encodes a ~20 amino acid linker and the binding domains for the FMN, FAD and NADPH cofactors [16]. The reductases from CYP102A2 and CYP102A3 (R2 and R3) share 52–55% sequence identity with R1 and are comparable in size, the only notable difference being a linker region that is extended in R2 by seven amino acids [18]. Because the chimeric heme domains comprise sequences from three different parents, it is not obvious that fusion to wildtype reductase will generate a catalytically active holoenzyme, nor is it clear which reductase, R1, R2 or R3, should be used. For this initial characterization we therefore selected a set of 14 chimeric heme domains, reconstituted them with all three parental reductase domains, and determined peroxygenase and monooxygenase activities on eleven substrates. These activities have been analyzed to 1) assess the functional diversity of the chimeric enzymes, 2) determine whether substrates fall into groups for the purposes of predicting activities and 3) compare the activities and specificities of the chimeric peroxygenases with those of their reconstituted monooxygenases.
Results
Cloning and expression of P450 heme domains and holoenzymes
Seventeen proteins, including the three parent heme domains, were chosen for holoenzyme construction by fusion to a wildtype CYP102A reductase domain. For each sequence, four proteins were examined—the heme domain and its fusion to each of the three reductase domains—for a total of 68 constructs. Heme domains contain the first 463 amino acids for A1 and the first 466 amino acids for A2 and A3. The reductase domains start at amino acid E464 for R1, K467 for R2 and D467 for R3 and encode the linker region of the corresponding reductase. A3 and its fusions with R1 and R2 expressed very poorly, yielding only a very small amount of protein after purification, and were therefore not analyzed further.
The chimeric sequences are reported in terms of the parent from which each of the eight sequence blocks is inherited (Supplemental Table 1). Twelve of the fourteen chimeras were selected because they displayed relatively high activities on substrates in preliminary studies (data not shown). Chimera 23132233 was chosen because it displayed low peroxygenase activity, while 22312333 was selected because it is more thermostable than any of the parents (T50 = 62 °C) [9]. For the constructs studied here, the reductase identity is indicated as the ninth sequence element, with R0 referring to no reductase (i.e., heme domain peroxygenase).
Activity assays
To assess the functional diversity of the chimeric P450s, we measured their activities on the eleven substrates shown in Figure 1. Propranolol (PR), tolbutamide (TB) and chlorzoxazone (CH) are drugs that are metabolized by human P450s [3, 19, 20]. 12-p-nitrophenoxycarboxylic acid (PN) is a long-chain fatty acid surrogate; parent A1-R1 holoenzyme and the A1 heme domain (with the F87A mutation) both show high activity on this substrate. Previous work showed that A1 has weak peroxygenase activity on some of the aromatic substrates [10]. Aromatic hydroxylation products of all substrates can be detected quantitatively using the 4-amino antipyrine assay [21]. PN hydroxylation can be monitored spectrophometrically [22].
Figure 1.
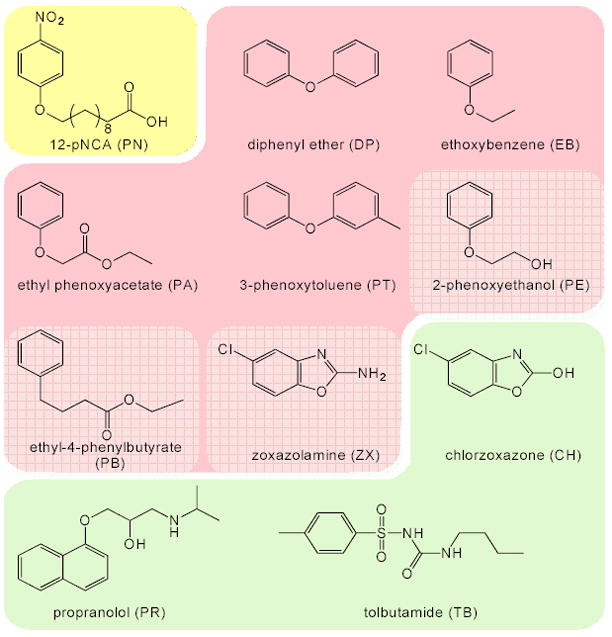
Chemical structures and abbreviations. Substrates are grouped according to the pairwise correlations (see text for details). Members of a group are highly correlated; intergroup correlations are low.
Peroxygenase activities of the 16 heme domains (all except A3) were determined by assaying for product formation after a fixed reaction time in 96-well plates (see Experimental). Similar assays were used to determine monooxygenase activities for each of the fusion proteins. Final enzyme concentrations were fixed to 1 μM in order to reduce large errors associated with low expression and to allow us to compare chimera activities using absorbance values directly. Protein concentrations were re-assayed in 96-well format and determined to be 0.88 μM +/− 13% (SD/average). All samples were prepared and analyzed in triplicate, and outlier data points were eliminated. Supplemental Tables 2 and 3 report the averages and standard deviations for each of the assays. More than 85% of the data for each substrate was retained, and more than 95% was retained for 6 of the 11 substrates (Supplemental Table 4).
Because extinction coefficients are not known for the reaction products, we do not report absolute enzyme activities, nor do we report substrate specificities, which are ratios of enzyme activity on one substrate to activity on another. Our data nonetheless allow us to compare the chimeras with respect to their activities on a given substrate and also to compare their activity profiles and therefore their specificities. Chimeras having a similar profile form the same relative amounts of products from all substrates and are therefore likely to have similar specificities. To better visualize differences among chimeras, the highest average absorbance value for a given substrate was set to 100%, and all other absorbances for the same substrate, but different chimeras, were normalized to this. Figure 2 is a heat plot of the complete data set of normalized absorbances, while Supplemental Figure 2 shows the substrate-activity profiles in the form of bar plots.
Figure 2.
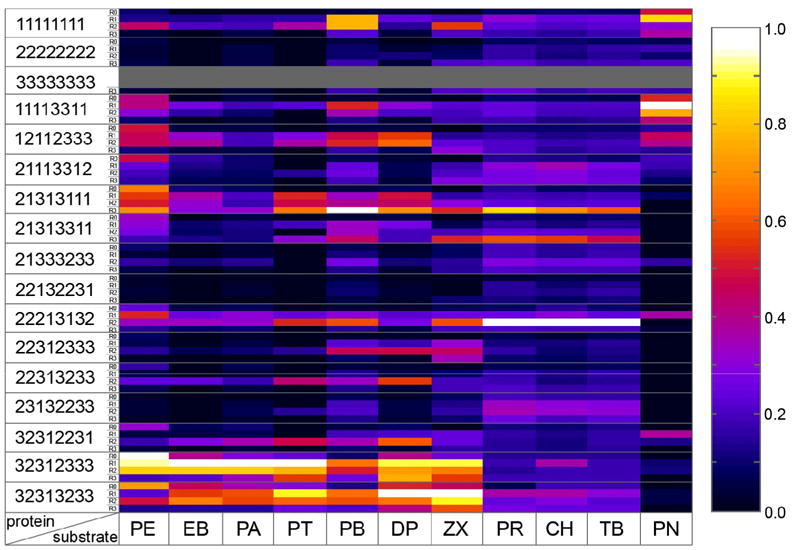
Summary of normalized activities for all 56 enzymes acting on 11 substrates. Activities are shown using a color scale (white indicating highest and black lowest activity), with columns representing substrates and rows representing proteins. Not-analyzed A3, A3-R1 and A3-R2 proteins are shown in grey. Protein rows are ordered by their chimeric sequence first, and then by heme domain (R0) and R1-, R2- and R3-fusions.
Activities of parent enzymes
Figure 3A shows the normalized substrate-activity profiles of the A1 and A2 peroxygenases. Both have relatively low or no activity on any of the substrates except PN, where A1 makes about an order of magnitude more product than does A2. Profiles for the reconstituted parent holoenzymes are shown in Figure 3B. Fusion of A1 and R1 generated an enzyme with profile peaks on ethyl 4-phenylbutyrate (PB) and PN. A1 is in fact the second-best-performing enzyme on PB. The A1 peroxygenase activity on this substrate, however, is among the worst, showing that peroxygenase specificity does not necessarily predict that of the monooxygenase. Fusion of A2 to R2 slightly increased activity relative to A2, but did not alter the profile. The A3-R3 holoenzyme exhibits some activity on the drug-like substrates (PR, TB, CH) as well as PN and PB.
Figure 3.
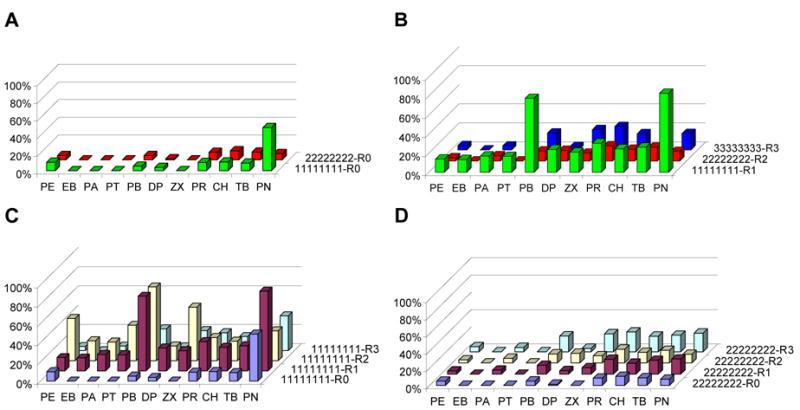
Substrate-activity profiles for parent heme domain mono- and peroxygenases. Panel (A) shows parent peroxygenases, panel (B) parent holoenzyme monooxygenases profiles, panel (C) the A1 protein set and panel (D) the A2 protein set. In (A) and (B) the color indicates the origin of the heme domain (Green =A1/Red= A2/Blue= A3). The protein set in panel (C) includes the heme domain A1 (blue) or its R1- (purple), R2-(yellow) or R3-fusion (turquoise) protein. Panel (D) depicts the A2 protein set.
Fusion of the A1 and A2 heme domains to other reductase domains yields holoenzymes that are active on some substrates (Figure 3C and 3D). The A2 fusions have relatively low activities. A1 fusions with R1 and R2, on the other hand, created highly active enzymes with different specificities: the A1-R1 profile has peaks on PN and PB, while that of A1-R2 has peaks on PB, phenoxyethanol (PE) and zoxazolamine (ZX). The A1-R3 fusion is less active on nearly all substrates.
Activities of chimeras and identification of chimera clusters
The 14 chimeric heme domains generated 56 chimeric peroxygenases and monooxygenases. Nearly all the chimera fusions outperformed even the best parent holoenzyme, and chimeric peroxygenases consistently outperformed the parent peroxygenases (Figure 2 and Supplemental Figure 2). The best enzyme for each substrate is listed in Supplemental Table 5. All the best enzymes are chimeras. Most of the best enzymes are also holoenzymes—only PE has a peroxygenase as the best catalyst.
We now show that there exists a discrete set of characteristic substrate-activity profiles to which each chimera can be uniquely assigned. A k-means clustering analysis was applied to the normalized absorbance data to better understand the functional diversity. K-means clustering, a statistical algorithm that partitions data into clusters based on data similarity [23], has been used by Mannervik and coworkers to identify groups of mutants exhibiting similar substrate specificities [24] and by others to identify protein fragments (4–7 residues) of similar structure [25] and interacting nucleotide pairs with similar 3D structures [26]. For our analysis, the normalized data were used to ensure that each of the 11 dimensions is given equal weight by the clustering algorithm. The clustering was performed over values of k (number of clusters) ranging from k=2 to k=8. The highest silhouette value (see Experimental) was observed at k=5.
The cluster composition for k=5 is depicted in Figure 4. Cluster 1, consisting of chimeras 32312333-R1/R2 and 32313233-R1/R2 (Figure 4B), is characterized by low relative activities on CH, TB, PR and PN and high relative activities on all other substrates. In fact, two of these chimeras are the best enzymes on all the remaining substrates except PB and PE.
Figure 4.
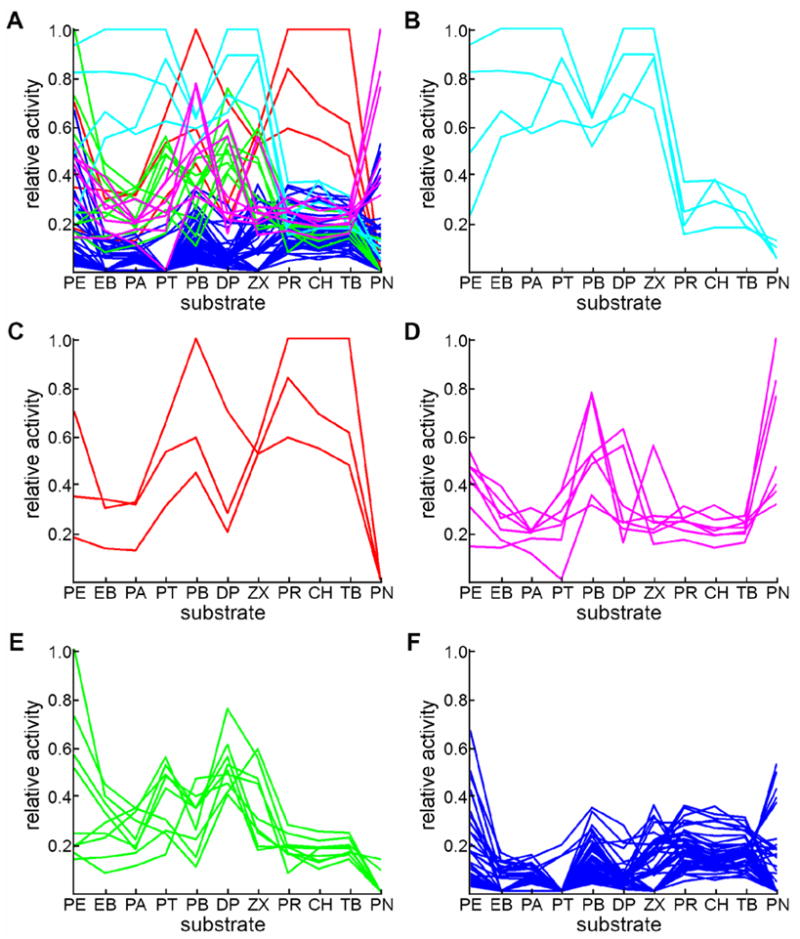
K-means clustering analysis separates chimeras into five clusters. All protein-activity profiles are depicted in (A), where the color identifies the cluster. Panels (B) through (F) show profiles for sequences within each cluster. Panel (B) depicts 32312333-R1/R2, 32313233-R1/R2. Panel (C) depicts 22213132-R2, 21313111-R3, 21313311-R3. Panel (D) depicts A1-R1/R2, 12112333-R1/R2, 11113311-R1/R2 and 22213132-R1. Panel (E) depicts 21313111-R1/R2, 22313233-R2, 22312333-R2, 32312231-R2, 32312333-R0, 32312333-R3, 32313233-R0, and 32313233-R3. Panel (F) depicts the remaining sequences.
Cluster 2 is made up of 22213132-R2, 21313111-R3, 21313311-R3, which are the most active enzymes on TB, CH and PR (Figure 4C). Cluster 2 enzymes are entirely inactive on PN and show low activity on most of the substrates that cluster 1 enzymes accept (PE, DP, PA and EB). Relative activities on the remaining substrates (i.e. PB, ZX and PT) are moderate (although lower than cluster 1 chimeras). An exception is 21313111-R3, which is the best enzyme for PB and also fairly good on PE and DP.
Cluster 3 contains chimeras A1-R1/R2, 12112333-R1/R2, 11113311-R1/R2 and 22213132-R1 (Figure 4D). The A1-like sequences are characterized by high relative activity on PN (on which 11113311-R1/R2 and A1-R1 are the three top-ranking enzymes), and moderate to high relative activity on PB and moderate activity on PE.
Cluster 4 contains 21313111-R1/R2, 22313233-R2, 22312333-R2, 32312231-R2, 32312333-R0, 32312333-R3, 32313233-R0, and 32313233-R3 (Figure 4E). This cluster is characterized by having the highest relative activity on PE, in addition to moderate activities on PT, DP and ZX. The remaining chimeras appear in a fifth cluster with relatively low activity on everything except PN and PE (Figure 4F). This cluster contains parental sequences A1-R0, A1-R3, A2-R0, A2-R1/R2/R3 and A3-R3. Native sequences are thus only found in two of the clusters. The remaining clusters (1, 2 and 4) are made up of highly active chimeras that have acquired novel profiles.
The partition created by the clustering algorithm shows that the presence and identity of the reductase can alter the activity profile and thus the specificity of a heme domain sequence. For example, the R1 and R2 fusions of 32312333 and 32313233 appear in cluster 1, whereas their R0 and R3 counterparts are in cluster 4. Sequences 22213132 and 21313111 also behave differently when fused to different reductases. 22213132-R2, for example, displays pronounced peaks on substrates TB, CH and PR that are not present in the corresponding peroxygenase and R1/R3 profiles (Supplemental Figure 2E) and is thus the only member with this heme domain sequence appearing in cluster 2. 21313111-R3 and 21313111-R2/R1 have nearly opposite profiles (Supplemental Figure 2J) and consequently appear in different clusters. Thus the best choice of reductase depends on both the substrate and the chimera sequence.
Peroxygenase vs. monooxygenase activities
As shown in Figure 2, each of the 14 chimeric heme domains can be fused to a parental reductase to generate a functional monooxygenase. The resulting monooxygenases are generally more active under these conditions than the corresponding peroxygenases (see Supplemental Figure 2). The R1 and R2 fusions tend to outperform R3 fusions. While altering reductase identity never completely deactivates the protein, it does affect specificity in some cases. To quantify the differences between the profiles of the four different enzymes that can be made from a given chimera, the pairwise linear coefficients (R2) of the R0/R1, R0/R2, R0/R3, R1/R2, R1/R3 and R2/R3 profiles were determined for each heme domain sequence (with the exception of A3). The results are shown in Supplemental Table 1. High correlations represent enzyme pairs with similar specificities. The results show that peroxygenase and monooxygenase specificities are usually different, R1/R2 fusions of a chimera are often very similar (five pairs have R2 values above 0.9), and the R1 and R2 fusions are less similar to the R3 enzymes.
Identification of substrate groups
To understand whether a chimera’s activity on one substrate predicts activity on another, the pairwise correlations of the absorbances of all the possible substrate pairs were determined (Supplemental Table 5). Mannervik and coworkers used correlations between activities on substrate pairs to identify enzyme variants with novel substrate specificities [7]. Here we use these correlations instead to identify substrates having similar chimera profiles. This analysis led to the identification of three substrate clusters characterized by high values of the correlation coefficients. Members of different clusters are poorly correlated. DP, PT, PA and EB all exhibit high correlations with each other (R2 = 0.71–0.92, see Supplemental Figure 1A for an example) and were grouped into the core of substrate group A. Group B consists of CH, TB and PR. The categorization of this group is clearly defined: its members show high correlations with each other (R2 above 0.9, see Supplemental Figure 1B for an example), but correlate very poorly with the other substrates (R2 = 0.01–0.37). PN does not correlate significantly with any of the other substrates tested (R2 = 0.00–0.08) and is its own substrate group C.
ZX, PB and PE show moderate correlation to members of the group A core (R2 = 0.56–0.66, 0.39–0.56 and 0.35–0.61, respectively). These substrates are considered loosely associated with group A since they do not belong to any other group due to poor correlation with each other and the remaining substrates.
There exists a correspondence between the chimera clusters and the substrate groups. Group A core substrates have cluster 1 chimeras as their top-performing enzymes, whereas substrates of group B have cluster 2 chimeras as their top-performing enzymes. The top catalysts for group C are three of the cluster 3 chimeras. Members of a substrate group thus share the same best-performing enzymes.
Discussion
SCHEMA recombination creates a family of functionally diverse enzymes
We have begun to characterize the functional diversity in a synthetic P450 family created by structured-guided recombination of bacterial fatty acid hydroxylases. The folded P450s, which make up almost 50% of the 6,561 sequences in the SCHEMA library, contain an average of 72 mutations from their closest parent. A large fraction of the folded P450s were shown to be catalytically active [9], but they had been systematically studied on only a single substrate (PN). We therefore selected 11 substrates for this initial characterization of 14 of the active chimeric heme domains and their fusions with each of the three parental reductase domains. Although most of the parental enzyme constructs are poorly active on the selected substrates, many of the chimeras are significantly more active. In fact, for every single substrate, including one widely used to assay CYP102A1 (PN), the top-performing enzyme is a chimera. Recombining mutations already accepted in natural homologs thus leads to a family of highly active enzymes that accept a broader range of substrates.
Chimeras can be clustered by substrate specificity
We further showed that the chimeric enzymes exhibit distinct specificities and that they can be partitioned into clusters based on their specificity. One cluster contains parent A1-R1 and all chimeras with A1-like profiles. Another cluster contains low activity chimeras and includes all remaining parental sequences. The remaining clusters represent highly active chimeras that have acquired new specificities. Members of a cluster are likely to exhibit common structural, physical or chemical features that account for their similar catalytic properties. If the library is large enough, statistical techniques can be used to determine how sequence elements relate to the observed profiles. In particular, if there are sufficient numbers of chimeras in each cluster, then powerful tools such as logistic regression or machine learning can be used to predict which cluster an untested sequence belongs to [9]. This type of analysis would enable the prediction of substrate profiles of untested chimeras based on sequence information alone. The functionally diverse enzymes generated by SCHEMA-guided recombination can therefore be used to probe the sequence and structural basis of enzyme specificity. We recently reported the success of such an approach in predicting the thermostabilities of untested chimeras [Yougen Li, et al. unpublished data]. Although the current data set does not contain enough sequences for a comprehensive analysis of sequence-function relationships, anecdotal observations can be used to generate hypotheses for further testing. For example, the chimeras in the library with parent A1 in blocks 1, 3 and 4 are all among the best enzymes for PN. These same enzymes display low relative activity on all the remaining substrates except for PB. This suggests that having parent A1 sequence at one or more of these blocks improves PN activity and specificity.
Substrates fall into groups that correlate with chimera clusters
We were also able to partition the substrates into groups based on the linear correlations of substrate pairs. An enzyme active on one member of a substrate group is therefore likely to be active on another member of the same group. One group consists of the drug-like substrates TB, PR and CH (Figure 1). Another consists of PT, PA, EB and DP. If these correlations hold for the larger library of chimeric enzymes, we should be able to predict with reasonable accuracy the relative activities of a chimera on all the substrates in a group by testing activity on only one. This type of analysis can be expanded to a larger collection of substrates to identify additional groups or additional members of an existing group.
The observed correspondence between the three substrate groups and chimera clusters 1, 2 and 3 illustrates that each group can be associated with a cluster made up of or containing the top-performing enzymes for the substrates in that group. Some degree of correspondence can be expected, given how the partitions were constructed. However, because intra-group correlations are not one and inter-group correlations are not zero, the correspondence is not perfect. For this reason there exist chimeras whose profiles exhibit peaks on only certain members of a group (cluster 4) and others that exhibit peaks on members of different groups (cluster 2 and 3 chimeras). Cluster 4 chimeras have peaks on only certain members of group A and are thus responsible for the lower correlations among group A substrates. Some cluster 2 and cluster 3 chimeras exhibit peaks on PB (on the edge of group A) as well as group B and C, respectively. In fact although PB correlates mostly with group A core substrates it shares its top-performing enzymes with groups B and C and thus displays a hybrid behavior. This is why PB correlates less with group A than core substrates do and why it has higher correlations with group B and C members than any other substrate not belonging to these groups.
Because chimeras displaying high relative activity have more weight in determining the correlation coefficients, the top enzymes for one member of a substrate group will usually be among the top ones for all members of that group. The clearer the definition of the substrate groups, the more likely this is to hold. Given the many important applications of P450s in medicine and biocatalysis, and the lack of high-throughput screens for many compounds of interest, an approach to screening that is based on carefully chosen ‘surrogate’ substrates could significantly enhance our ability to identify useful catalysts. Clearly, any member of a well-defined substrate group can be a surrogate for other members of that group. Further analysis may also help to identify the critical physical, structural or chemical properties of substrates belonging to a known group. This will make it possible to predict which chimeras will be most active on a new, untested substrate.
Swapping reductase domains consistently yields active monooxygenases and conserves key P450-reductase FMN domain interactions
The literature reports multiple cases in which functional P450s have been reconstituted with new reductase domains. In several studies, swapping reductases improved mammalian P450 activity [27–29]. A self-sufficient chimeric mammalian P450 2E1 enzyme was constructed by fusing the 2E1 heme domain to the CYP102A1 reductase [30]. Functional chimeras of CYP102A1 and the flavocytochrome nitric oxide synthase (nNOS) have been generated [31]. Another study reported the functional expression of CYP153A genes by incorporating them into a framework consisting of the N- and C- termini of homolog CYP153A13a and fusion to the reductase domain of CYP116B2 [32].
Reconstitution of the chimeric CYP102A heme domains with the three parental reductases generated functional monooxygenases in all cases. Although their specificities were often different (particularly when fused to R3), fusion to a reductase was never detrimental to activity, and swapping the reductase never completely inactivated the enzyme (Supplemental Figure 2). Subtle changes in the structure and coupling behavior that affect total product formation may account for specificity differences. The fact that the parental reductase domains are accepted without loss of function, however, suggests that key domain-domain interactions are conserved upon reductase swapping.
Although a complete crystal structure of a CYP102A holoenzyme is not available, a partial CYP102A1 structure (1BVY) includes the interface between the heme and the reductase FMN domains. Only a few direct contacts, including one hydrogen bond, one salt bridge and several water-mediated contacts, make up this A1-R1 interface [33]. We aligned the parental sequences using ClustalW [34] and found that the interactions depicted in the 1BVY crystal structure involve amino acids that are mostly conserved in the parent proteins. Figure 5 displays the interface between the heme and reductase domains of CYP102A1 and highlights the amino acids involved in key interactions. The salt bridge is formed between reductase residue E494 and heme domain residue H100, both of which are conserved in all three parents. Thus this key interaction would be retained upon reductase swapping that conserves the orientation of the two domains.
Figure 5.
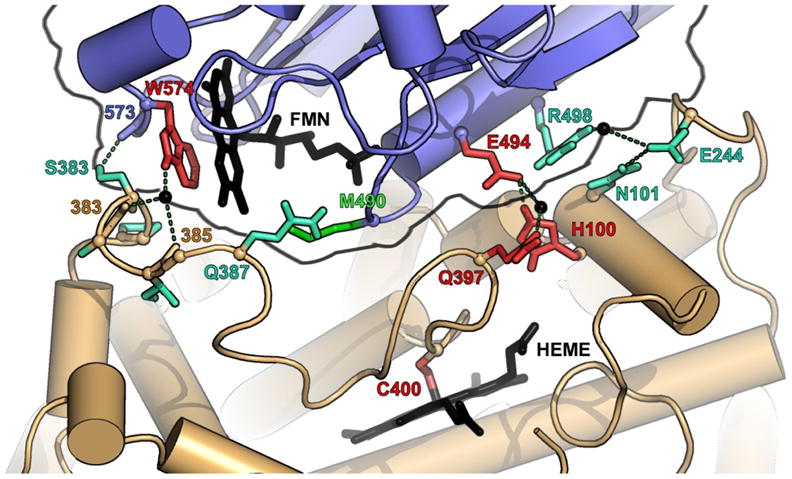
Interface between the FMN (blue backbone) and heme domain (brown backbone) based on the 1BVY structure redrawn according to Sevrioukova et al.[33]. Residue colors indicate the degree of conservation: red (three parents), turquoise (two parents) and green (not conserved). Hydrogen bonds are shown as dashed lines. The amino acids correspond to CYP102A1 numbering. PyMOL was used to create this figure [43].
The direct hydrogen bond occurs between the reductase backbone carbonyl of N573 and the side-chain hydroxyl group of heme domain residue S383. N573 is only conserved in R1 and R2, but because the interaction involves the backbone oxygen, the reductase side of the interface is not affected by changes in the side-chain identity. S383 is only conserved in parents A1 and A3. However, the corresponding residue in A2, D385, may also be capable of forming the hydrogen bond. This interaction may therefore be present in all the chimeras.
There are two water-mediated hydrogen bonds between the hydrogen of the indole nitrogen of reductase residue W574 and the backbone carbonyl of S383 and I385. W574 was earlier shown to be crucial for electron transfer from the FMN to the heme [35] and is conserved in R1, R2 and R3. S383 and I385 are conserved in A1 and A3 but not A2, where the corresponding residues are D385 and V387. Because the hydrogen bonds involve the backbone oxygens of these residues, these interactions may be retained upon domain substitution. Also, all possible pairwise interactions that can be formed at these positions by domain swapping already exist in at least one of the parental sequences and are thus likely not to be destabilizing. Finally, the substitutions that do occur are conservative, replacing a hydrophilic residue with another hydrophilic residue and a hydrophobic residue with another hydrophobic residue. The third water-mediated hydrogen bond between the side chains of reductase residue R498 and heme domain residue E244 (block 5) is conserved in A1-R1, A2-R2 but not A3-R3, where the corresponding residues are G501 and V246. A3-R3 thus cannot form this interaction nor can any chimera that inherits A3 sequence at block 5 and/or is fused to R3.
In summary, it appears that the direct hydrogen bond, two of the three water-mediated hydrogen bonds and the salt bridge are all conserved in the chimera-reductase fusions. The third-water mediated hydrogen bond is conserved only in R1/R2 fusions that do not have parent A3 in block 5 (8 out of 17 sequences). Thus the activities of the reconstituted monooxygenases are consistent with their sequences, the domain-domain interactions identified in the 1BVY structure and the assumption that the overall structures and orientations are conserved upon reductase swapping. These results demonstrate the highly conservative nature of mutation by recombination of protein domains: as long as key interactions are retained, the remaining sequences can vary extensively.
Significance
The evolvable cytochrome P450 scaffold has diversified over millions of years of mutation and natural selection to exhibit the myriad activities of the natural enzyme family, of which more than 4,500 sequences are known [36]. We constructed a large synthetic P450 family by recombining sequence elements from three bacterial P450s [9]. We have now shown that members of this synthetic family exhibit diverse activities and specificities, including activities towards substrates that are not accepted by the parent P450s and drug-like compounds that are substrates of human P450s. Thus enzymes in this family have acquired the ability to mimic important reactions in human drug metabolism. The grouping of substrates according to likelihood that a given chimera will accept them, as has been demonstrated here, will aid in the identification of useful catalysts from this synthetic family by high-throughput screening of substrate ‘surrogates’. We anticipate that these enzymes will be useful for synthesis of drug metabolites [19], as needed for toxicity testing and drug discovery.
Experimental Procedures
Nomenclature and construction of holoenzymes from chimeric heme domains
Details of chimera construction have been reported previously [9]. Sequences are given an 8-digit number, where each digit indicates the parent from which each of the eight blocks was inherited. The identity of the reductase is indicated by R0 (for no reductase) or R1, R2 or R3 for the CYP102A1, A2, or A3 reductases, respectively.
To construct the holoenzymes, the chimeric heme domains were fused to each of the three wildtype reductase domains after amino acid residue 463 when the last block originates from CYP102A1 and 466 for CYP102A2 and CYP102A3. The holoenzymes were constructed by overlap extension PCR [37] and/or ligation and cloned into the pCWori expression vector [38]. All constructs were confirmed by sequencing.
Protein expression and purification
Proteins were expressed in E. coli as described previously and purified by anion exchange on Toyopearl SuperQ-650M from Tosoh [39]. After binding of the proteins, the matrix was washed with a 30 mM NaCl buffer, and proteins were eluted with 150 mM NaCl (all buffers used for purification contained 25 mM phosphate buffer pH 8.0). Proteins were rebuffered into 100 mM phosphate buffer and concentrated using 30,000 MWCO Amicon Ultra centrifugal filter devices (Millipore). Proteins were stored at −20°C in 50% glycerol.
Protein concentration was measured by CO absorption at 450 nm as described [40]. A protein concentration of 1 μM was chosen for the activity assays. Protein concentrations were re-assayed in 96-well format and determined to be 0.88 μM +/− 13% (SD/average).
Functional assays
Proteins were assayed for mono- or peroxygenase activities in 96-well plates as described [9, 41]. Heme domains were assayed for peroxygenase activity using hydrogen peroxide as the oxygen and electron source. Reductase domain fusion proteins were assayed for monooxygenase activity, using molecular oxygen and NADPH. Reactions were carried out in 100 mM EPPS buffer pH 8, 1% acetone, 1% DMSO, 1 μM protein in 120 μl volumes. Substrate concentrations depended on their solubility under the assay conditions. Final concentrations were: 2-phenoxyethanol (PE), 100 mM; ethoxybenzene (EB), 50 mM; ethyl phenoxyacetate (PA), 10 mM; 3-phenoxytoluene (PT), 10 mM; ethyl 4-phenylbutyrate (PB), 5 mM; diphenyl ether (DP), 10 mM; zoxazolamine (ZX), 5 mM; propranolol (PR), 4 mM; chlorzoxazone (CH), 5 mM; tolbutamide (TB), 10 mM; 12-p-nitrophenoxycarboxylic acid (PN), 0.25 mM. The reaction was initiated by the addition of NADPH or hydrogen peroxide stock solution (final concentration of 500 μM NADPH or 2 mM hydrogen peroxide) and mixed briefly. After 2 hrs at room temperature, reactions with substrates 1–10 were quenched with 120 μl of 0.1 M NaOH and 4 M urea. Thirty-six μl of 0.6% (w/v) 4-aminoantipyrine (4-AAP) was then added. The 96-well plate reader was zeroed at 500 nm and 36 μl of 0.6% (w/v) potassium persulfate was added. After 20 min, the absorbance at 500 nm was read [21]. Reactions on PN were monitored directly at 410 nm by the absorption of accumulated 4-nitrophenol. All experiments were performed in triplicate, and the absorption data were averaged.
Data analysis
The background absorbance (BG) was subtracted from the raw data. BG reactions contained buffer, cofactor and substrate in the absence of protein sample and were done in triplicates. All absorbance measurements were done once on three separate samples (triplicate sampling). Data points with a SD/average ≥ 20% that did not lie within the average ± 1.1*SD were eliminated. 1.1*SD was chosen so that for each substrate at least 85% of the points were retained. This never resulted in the elimination of more than one point from each triplicate set of measurements. All points with an average absorbance < BG were set to zero, because they are assumed to belong to inactive proteins. The absorbance matrix thus obtained for all 68 proteins on all 11 substrates is displayed in Supplemental Table 2. The SD/average matrix is displayed in Supplemental Table 3. SD/average was calculated ignoring values for inactive enzymes.
Cluster analysis
K-means clustering is a partitioning method that divides a set of observations into k mutually exclusive clusters. K-means treats each data point as an object having a location in m-dimensional space (m=11 in this analysis) [23]. It then finds a partition such that members of the same cluster are as close as possible to each other and as far as possible to members of other clusters. For this reason, a measure of the meaningfulness of a partition is given by the silhouette value , where a(i) is the average distance of point i to all other points in its cluster and b (i) is the average distance of point i to all points in the closest cluster. It is evident that −1≤s≤1 and the quality of the clustering increases as s -> 1 [42]. Distances are measured by the square of the Euclidean distance.
Supplementary Material
Acknowledgments
This work is supported by the National Institutes of Health (R01 GM068664-0) and a Naional Science Foundation Predoctoral Fellowship (to MC). The authors thank Sally A. Kim for critically reading the manuscript, Daniela C. Dieterich for help with Figures 2 and 4 and Christopher Snow for Figure 5. ML, CRO and FHA designed and planned the project, ML, MC, CRO and YL performed the experiments. MC, ML and CRO analyzed the data. ML, MC and FHA prepared the manuscript.
Abbreviations (additional footnotes)
- A1
Parent CYP102A1 heme domain
- A2
parent CYP102A2 heme domain
- A3
parent CYP102A3 heme domain
- SD
standard deviation
- BG
background
- PE
2-phenoxyethanol
- EB
ethoxybenzene
- PA
ethyl phenoxyacetate
- PT
3-phenoxytoluene
- PB
ethyl 4-phenylbutyrate
- DP
diphenyl ether
- ZX
zoxazolamine
- PR
propranolol
- CH
chlorzoxazone
- TB
tolbutamide
- PN
12-p-nitrophenoxycarboxylic acid
Footnotes
Publisher's Disclaimer: This is a PDF file of an unedited manuscript that has been accepted for publication. As a service to our customers we are providing this early version of the manuscript. The manuscript will undergo copyediting, typesetting, and review of the resulting proof before it is published in its final citable form. Please note that during the production process errors may be discovered which could affect the content, and all legal disclaimers that apply to the journal pertain.
References
- 1.Taly V, Urban P, Truan G, Pompon D. A combinatorial approach to substrate discrimination in the P450 CYP1A subfamily. Biochim Biophys Acta. 2006 doi: 10.1016/j.bbagen.2006.08.005. [DOI] [PubMed] [Google Scholar]
- 2.Raillard S, Krebber A, Chen Y, Ness JE, Bermudez E, Trinidad R, Fullem R, Davis C, Welch M, Seffernick J, Wackett LP, Stemmer WP, Minshull J. Novel enzyme activities and functional plasticity revealed by recombining highly homologous enzymes. Chem Biol. 2001;8:891–898. doi: 10.1016/s1074-5521(01)00061-8. [DOI] [PubMed] [Google Scholar]
- 3.Ernstgard L, Warholm M, Johanson G. Robustness of chlorzoxazone as an in vivo measure of cytochrome P450 2E1 activity. Br J Clin Pharmacol. 2004;58:190–200. doi: 10.1111/j.1365-2125.2004.02132.x. [DOI] [PMC free article] [PubMed] [Google Scholar]
- 4.Hansson LO, Bolton-Grob R, Massoud T, Mannervik B. Evolution of differential substrate specificities in Mu class glutathione transferases probed by DNA shuffling. J Mol Biol. 1999;287:265–276. doi: 10.1006/jmbi.1999.2607. [DOI] [PubMed] [Google Scholar]
- 5.Christians FC, Scapozza L, Crameri A, Folkers G, Stemmer WP. Directed evolution of thymidine kinase for AZT phosphorylation using DNA family shuffling. Nat Biotechnol. 1999;17:259–264. doi: 10.1038/7003. [DOI] [PubMed] [Google Scholar]
- 6.Griswold KE, Kawarasaki Y, Ghoneim N, Benkovic SJ, Iverson BL, Georgiou G. Evolution of highly active enzymes by homology-independent recombination. Proc Natl Acad Sci USA. 2005;102:10082–10087. doi: 10.1073/pnas.0504556102. [DOI] [PMC free article] [PubMed] [Google Scholar]
- 7.Broo K, Larsson AK, Jemth P, Mannervik B. An ensemble of theta class glutathione transferases with novel catalytic properties generated by stochastic recombination of fragments of two mammalian enzymes. J Mol Biol. 2002;318:59–70. doi: 10.1016/S0022-2836(02)00032-3. [DOI] [PubMed] [Google Scholar]
- 8.Drummond DA, Silberg JJ, Meyer MM, Wilke CO, Arnold FH. On the conservative nature of intragenic recombination. Proc Natl Acad Sci USA. 2005;102:5380–5385. doi: 10.1073/pnas.0500729102. [DOI] [PMC free article] [PubMed] [Google Scholar]
- 9.Otey CR, Landwehr M, Endelman JB, Hiraga K, Bloom JD, Arnold FH. Structure-guided recombination creates an artificial family of cytochromes p450. PLoS Biol. 2006;4:e112. doi: 10.1371/journal.pbio.0040112. [DOI] [PMC free article] [PubMed] [Google Scholar]
- 10.Otey CR, Silberg JJ, Voigt CA, Endelman JB, Bandara G, Arnold FH. Functional evolution and structural conservation in chimeric cytochromes p450: calibrating a structure-guided approach. Chem Biol. 2004;11:309–318. doi: 10.1016/j.chembiol.2004.02.018. [DOI] [PubMed] [Google Scholar]
- 11.Brock BJ, Waterman MR. The use of random chimeragenesis to study structure/function properties of rat and human P450c17. Arch Biochem Biophys. 2000;373:401–408. doi: 10.1006/abbi.1999.1557. [DOI] [PubMed] [Google Scholar]
- 12.Ramarao MK, Straub P, Kemper B. Identification by in vitro mutagenesis of the interaction of two segments of C2MstC1, a chimera of cytochromes P450 2C2 and P450 2C1. J Biol Chem. 1995;270:1873–1880. doi: 10.1074/jbc.270.4.1873. [DOI] [PubMed] [Google Scholar]
- 13.Lewis DFV. Guide to cytochromes P450: structure and function. London; New York: Taylor & Francis; 2001. [Google Scholar]
- 14.Mansuy D. The great diversity of reactions catalyzed by cytochromes P450. Comp Biochem Physiol C-Pharmacol Toxicol Endocrinol. 1998;121:5–14. doi: 10.1016/s0742-8413(98)10026-9. [DOI] [PubMed] [Google Scholar]
- 15.Ruettinger RT, Wen LP, Fulco AJ. Coding nucleotide, 5′ regulatory, and deduced amino-acid sequences of P-450BM-3, a single peptide cytochrome P-3′450-NADPH-P-450 reductase from Bacillus-megaterium. J Biol Chem. 1989;264:10987–10995. [PubMed] [Google Scholar]
- 16.Ortiz de Montellano PR. Cytochrome P450: Structure, Mechanism, and Biochemistry. New York: Plenum Press; 1995. [Google Scholar]
- 17.Cirino PC, Arnold FH. Regioselectivity and activity of cytochrome P450BM-3 and mutant F87A in reactions driven by hydrogen peroxide. Adv Synth Catal. 2002;344:932–937. [Google Scholar]
- 18.Gustafsson MC, Roitel O, Marshall KR, Noble MA, Chapman SK, Pessegueiro A, Fulco AJ, Cheesman MR, von Wachenfeldt C, Munro AW. Expression, purification, and characterization of bacillus subtilis cytochromes P450 CYP102A2 and CYP102A3: flavocytochrome homologues of P450 BM3 from Bacillus megaterium. Biochemistry. 2004;43:5474–5487. doi: 10.1021/bi035904m. [DOI] [PubMed] [Google Scholar]
- 19.Otey CR, Bandara B, Lalonde J, Takahashi K, Arnold FH. Preparation of human metabolites of propranolol using laboratory-evolved bacterial cytochromes P450. Biotechnol Bioeng. 2006;93:494–499. doi: 10.1002/bit.20744. [DOI] [PubMed] [Google Scholar]
- 20.Lee CR, Pieper JA, Frye RF, Hinderliter AL, Blaisdell JA, Goldstein JA. Tolbutamide, flurbiprofen, and losartan as probes of CYP2C9 activity in humans. J Clin Pharmacol. 2003;43:84–91. doi: 10.1177/0091270002239710. [DOI] [PubMed] [Google Scholar]
- 21.Otey CR, Joern JM. High-throughput screen for aromatic hydroxylation. Methods Mol Biol. 2003;230:141–148. doi: 10.1385/1-59259-396-8:141. [DOI] [PubMed] [Google Scholar]
- 22.Schwaneberg U, Schmidt-Dannert C, Schmitt J, Schmid RD. A continuous spectrophotometric assay for P450 BM-3, a fatty acid hydroxylating enzyme, and its mutant F87A. Anal Biochem. 1999;269:359–366. doi: 10.1006/abio.1999.4047. [DOI] [PubMed] [Google Scholar]
- 23.McQueen J. Some methods for classification and analysis of multivariate observations. 5th Berkeley Symposium on mathematics, Statistics and Probability. 1967:281–297. [Google Scholar]
- 24.Larsson AK, Emren LO, Bardsley WG, Mannervik B. Directed enzyme evolution guided by multidimensional analysis of substrate-activity space. Protein Eng Des Sel. 2004;17:49–55. doi: 10.1093/protein/gzh005. [DOI] [PubMed] [Google Scholar]
- 25.Kolodny R, Koehl P, Guibas L, Levitt M. Small libraries of protein fragments model native protein structures accurately. J Mol Biol. 2002;323:297–307. doi: 10.1016/s0022-2836(02)00942-7. [DOI] [PubMed] [Google Scholar]
- 26.Sykes MT, Levitt M. Describing RNA structure by libraries of clustered nucleotide doublets. J Mol Biol. 2005;351:26–38. doi: 10.1016/j.jmb.2005.06.024. [DOI] [PMC free article] [PubMed] [Google Scholar]
- 27.Shet MS, Fisher CW, Holmans PL, Estabrook RW. Human cytochrome P450 3A4: enzymatic properties of a purified recombinant fusion protein containing NADPH-P450 reductase. Proc Natl Acad Sci USA. 1993;90:11748–11752. doi: 10.1073/pnas.90.24.11748. [DOI] [PMC free article] [PubMed] [Google Scholar]
- 28.Shet MS, Fisher CW, Arlotto MP, Shackleton CH, Holmans PL, Martin-Wixtrom CA, Saeki Y, Estabrook RW. Purification and enzymatic properties of a recombinant fusion protein expressed in Escherichia coli containing the domains of bovine P450 17A and rat NADPH-P450 reductase. Arch Biochem Biophys. 1994;311:402–417. doi: 10.1006/abbi.1994.1255. [DOI] [PubMed] [Google Scholar]
- 29.Harlow GR, Halpert JR. Mutagenesis study of Asp-290 in cytochrome P450 2B11 using a fusion protein with rat NADPH-cytochrome P450 reductase. Arch Biochem Biophys. 1996;326:85–92. doi: 10.1006/abbi.1996.0050. [DOI] [PubMed] [Google Scholar]
- 30.Fairhead M, Giannini S, Gillam EM, Gilardi G. Functional characterisation of an engineered multidomain human P450 2E1 by molecular Lego. J Biol Inorg Chem. 2005;10:842–853. doi: 10.1007/s00775-005-0033-1. [DOI] [PubMed] [Google Scholar]
- 31.Fuziwara S, Sagami I, Rozhkova E, Craig D, Noble MA, Munro AW, Chapman SK, Shimizu T. Catalytically functional flavocytochrome chimeras of P450 BM3 and nitric oxide synthase. J Inorg Biochem. 2002;91:515–526. doi: 10.1016/s0162-0134(02)00478-6. [DOI] [PubMed] [Google Scholar]
- 32.Kubota M, Nodate M, Yasumoto-Hirose M, Uchiyama T, Kagami O, Shizuri Y, Misawa N. Isolation and functional analysis of cytochrome P450 CYP153A genes from various environments. Biosci Biotechnol Biochem. 2005;69:2421–2430. doi: 10.1271/bbb.69.2421. [DOI] [PubMed] [Google Scholar]
- 33.Sevrioukova IF, Li H, Zhang H, Peterson JA, Poulos TL. Structure of a cytochrome P450-redox partner electron-transfer complex. Proc Natl Acad Sci USA. 1999;96:1863–1868. doi: 10.1073/pnas.96.5.1863. [DOI] [PMC free article] [PubMed] [Google Scholar]
- 34.Chenna R, Sugawara H, Koike T, Lopez R, Gibson TJ, Higgins DG, Thompson JD. Multiple sequence alignment with the Clustal series of programs. Nuc Acids Res. 2003;31:3497–3500. doi: 10.1093/nar/gkg500. [DOI] [PMC free article] [PubMed] [Google Scholar]
- 35.Klein ML, Fulco AJ. Critical residues involved in FMN binding and catalytic activity in cytochrome P450BM-3. J Biol Chem. 1993;268:7553–7561. [PubMed] [Google Scholar]
- 36.Nelson D. 2006 Cytochrome P450 Homepage - http://drnelson.utmem.edu/CytochromeP450.html.
- 37.Higuchi R, Krummel B, Saiki RK. A General-Method of Invitro Preparation and Specific Mutagenesis of DNA Fragments - Study of Protein and DNA Interactions. Nuc Acids Res. 1988;16:7351–7367. doi: 10.1093/nar/16.15.7351. [DOI] [PMC free article] [PubMed] [Google Scholar]
- 38.Barnes HJ, Arlotto MP, Waterman MR. Expression and Enzymatic-Activity of Recombinant Cytochrome- P450 17-Alpha-Hydroxylase in Escherichia-Coli. Proc Natl Acad Sci USA. 1991;88:5597–5601. doi: 10.1073/pnas.88.13.5597. [DOI] [PMC free article] [PubMed] [Google Scholar]
- 39.Schwaneberg U, Sprauer A, Schmidt-Dannert C, Schmid RD. P450 monooxygenase in biotechnology I: Single-step, large-scale purification method for cytochrome P450 BM-3 by anion-exchange chromatography. J Chromatogr A. 1999;848:149–159. doi: 10.1016/s0021-9673(99)00457-4. [DOI] [PubMed] [Google Scholar]
- 40.Otey CR. High-throughput carbon monoxide binding assay for cytochromes P450. In: Arnold FH, Georgiou G, editors. Directed Enzyme Evolution: Screening and Selection Methods. Totowa, NJ: Humana Press; 2003. pp. 137–139. [DOI] [PubMed] [Google Scholar]
- 41.Cirino PC, Arnold FH. A self-sufficient peroxide-driven hydroxylation biocatalyst. Angew Chem Int Ed Engl. 2003;42:3299–3301. doi: 10.1002/anie.200351434. [DOI] [PubMed] [Google Scholar]
- 42.Rousseeuw PJ. Silhouettes: A graphical aid to the interpretation and validation of cluster analysis. J Comput Appl Math. 1987;20:53–65. [Google Scholar]
- 43.DeLano WL. 2002 The PyMOL Molecular Graphics System- http://www.pymol.org.
Associated Data
This section collects any data citations, data availability statements, or supplementary materials included in this article.