

Abstract
Postprandial glucagon-like peptide-1 (GLP-1) secretion can act as a meal termination signal in animals and humans. We tested the hypothesis that the postprandial changes in plasma GLP-1 concentrations are associated with changes in the human brain activity in response to satiety by performing a post-hoc analysis of a cross-sectional study of neuroanatomical correlates of hunger and satiation using 15O-water positron-emission tomography (PET). Forty-two subjects (22M/20F, age 31±8 years) spanning a wide range of adiposity (body fat: 7–44%) were included in this analysis. Outcome measures included changes in PET-measured regional cerebral blood flow (rCBF) and plasma concentrations of GLP-1, glucose, insulin, and free-fatty acids (FFA), elicited by the administration of a satiating amount of a liquid formula meal. The peak postprandial increases in plasma GLP-1 concentrations were correlated with increases in rCBF in the left dorsolateral prefrontal cortex (including the left middle and inferior frontal gyri), previously implicated in PET studies of human satiation, and the hypothalamus, previously implicated in the regulation of food intake in animal and human studies, both before and after adjustment for sex, age, body fat, and changes in plasma glucose, insulin, and serum FFA concentrations. The postprandial GLP-1 response is associated with activation of areas of the human brain previously implicated in satiation and food intake regulation.
Introduction
Glucagon-like peptide-1 (GLP-1) is a hormone derived from tissue-specific post-translational processing of the proglucagon gene in the intestinal L cells and exerts effects on glucose-dependent insulin secretion, insulin biosynthesis, islet beta-cell neo-genesis, gastrointestinal motility, neuronal plasticity, energy homeostasis, and food intake (Drucker, 2001). GLP-1 concentrations in the plasma rise rapidly after food ingestion, indicating that both the presence of nutrients in the gut lumen and neural mechanisms have a role in this early response (Deacon, 2005).
Postprandial GLP-1 secretion can act as a meal termination signal in animals and humans (Kreymann et al., 1987). GLP-1 receptor (GLP-1R) null mice have delayed satiation indicating impaired early postprandial satiety, even though these animals do not become obese (Scrocchi et al., 2000). Short-term GLP-1 administration is associated with increased feelings of fullness paralleled by decreased appetite in humans (Flint et al., 1998). This effect is due to both a direct central action of GLP-1 and a delay in gastric emptying.
A direct action of intestinal GLP-1 on the central nervous system (CNS) is possible since this peptide can enter the CNS via the subfornical organ and area postrema, which lack a typical blood–brain barrier (Orskov et al., 1996). GLP-1R gene is expressed in the brain as a protein with binding properties similar to those of the peripheral GLP-1R (Alvarez et al., 2005). While in rats GLP-1R is mostly concentrated in the hypothalamus, thalamus, and basal nuclei (Wei and Mojsov, 1995), GLP-1R expression in the human brain is widespread and has been reported in several areas including the frontal, parietal, temporal, and occipital cortices, the basal ganglia, and the hypothalamus (Alvarez et al., 2005).
Neuroimaging studies have shown that the human brain has a central role in the control of eating behaviour. Neural regulators of hunger and satiety are numerous and their interaction complex. Several functional neuroimaging studies have implicated the dorsolateral prefrontal (Gautier et al., 2000, 2001; Le et al., 2006; Tataranni et al., 1999) and orbitofrontal cortices (Gottfried et al., 2003; Hinton et al., 2004; Morris and Dolan, 2001; O’Doherty et al., 2000; Small et al., 2001), the amygdala (Gottfried et al., 2003; LaBar et al., 2001; Morris and Dolan, 2001), the parahippocampal gyrus (LaBar et al., 2001), the insula (Small et al., 2001; Tataranni et al., 1999; Uher et al., 2006), the anterior cingulate (Gottfried et al., 2003), the fusiform gyrus (LaBar et al., 2001), the striatum (Hinton et al., 2004; Tataranni et al., 1999), and the hypothalamus (Hinton et al., 2004; Tataranni et al., 1999) as parts of circuits integrating external (sensory cues) and internal (homeostatic, hedonic, and cognitive stimuli) determinants of eating behaviour in humans.
A recent study using positron emission tomography (PET) and 2-[18F]-deoxy-D-glucose (FDG) in young adult men and women showed that i.v. administration of GLP-1 affects glucose metabolism in the hypothalamus and brainstem, indicating that peripheral GLP-1 can access the CNS and modulate neuronal activity in humans (Alvarez et al., 2005). However, whether postprandial changes in plasma GLP-1 concentrations are associated with changes in brain activity in response to satiety has not yet been investigated.
To test this hypothesis, we performed a post-hoc correlation analysis of changes in O-PET measurements of regional cerebral blood flow (rCBF, a marker of neuronal activity) vs. changes in the plasma concentrations of GLP-1 and certain other metabolites in response to the oral administration of a satiating amount of a liquid formula meal after a 36-h fast in 42 male and female glucose tolerant subjects spanning a wide range of body fat who had been recruited for a study of neuroanatomical correlates of hunger and satiety (Gautier et al., 2000, 2001; Tataranni et al., 1999). We sought to determine whether the postprandial GLP-1 response would correlate with changes in neuronal activity in brain areas previously implicated in the regulation of eating behaviour in humans.
Methods
Subjects
Fasting and postprandial plasma GLP-1 concentrations were measured in 42 Caucasian subjects (Table 1), 22 men and 20 women, who had been recruited from the Phoenix, AZ metropolitan area by newspaper advertisements. All 42 subjects had previously been included in studies of neuroanatomical correlates of hunger and satiation in lean and obese people (Gautier et al., 2000, 2001; Le et al., 2006; Tataranni et al., 1999). All of the subjects were right-handed, non-smokers, and not taking any medications. All were in good health, as assessed by physical examination and laboratory tests. The female volunteers were studied while in the follicular phase of the menstrual cycle. Subjects were admitted for 1 week to the Obesity and Diabetes Clinical Research Section of the National Institutes of Health in Phoenix, AZ. Subjects were restricted to the metabolic ward and were limited to sedentary activity for the duration of the study. The protocol was approved by the Institutional Review Boards of the National Institute of Diabetes and Digestive and Kidney Diseases and the Banner Good Samaritan Medical Center. Informed, written consent was obtained from all subjects prior to participation.
Table 1.
Characteristics of the study subjects
| Sex (M/F) | 22/20 | – |
| Age (years) | 31±8 | 18–49 |
| Weight (kg) | 90±26 | 50–140 |
| Body mass index (kg/m2) | 31±9 | 18.5–50 |
| Body fat (%) | 28±10 | 7–44 |
| Fasting hunger score (mm) | 74±24 | 16–100 |
| Post-meal hunger score (mm) | 24±24 | 0–97 |
| Fasting fullness score (mm) | 16±16 | 0–81 |
| Post-meal fullness score (mm) | 78±21 | 10–100 |
| Fasting glucagon-like peptide-1 (pmol/l) | 23.3±6.4 | 11–36 |
| Post-meal glucagon-like peptide-1 (pmol/l) | 25.4±6.8 | 8–38 |
| Fasting plasma glucose (mg/dl) | 79±9 | 56–92 |
| Post-meal plasma glucose (mg/dl) | 95±9 | 76–118 |
| Fasting plasma insulin (3U/ml) | 21±7 | 7–36 |
| Post-meal plasma insulin (3U/ml) | 70±54 | 15–278 |
| Fasting serum free-fatty acids (mmol/l) | 0.9±0.3 | 0.5–1.7 |
| Post-meal serum free-fatty acids (mmol/l) | 0.7±0.2 | 0.4–1.4 |
Data are given as mean±S.D. and min–max, except for sex (n).
Experimental protocol
Experimental procedures have been previously described (Gautier et al., 2000, 2001; Tataranni et al., 1999). In brief, subjects were placed on a weight maintaining diet (50% carbohydrate, 30% fat, 20% protein) upon admission. Body composition was assessed by dual energy X-ray absorptiometry (DPX-l, Lunar, Madison, WI). Resting energy expenditure (REE) was measured after an overnight fast for 45 min by using a ventilated hood system (DeltaTrac, SensorMedics, Yorba Linda, CA). Prior to the brain imaging session, subjects fasted for 36 h. Water and non-caloric, non-caffeinated beverages were provided ad libitum during the fast.
Analytical measurements
Total plasma GLP-1 concentrations were determined by commercially available radioimmunoassay (Linco Research, Inc., St. Charles, MO), as previously reported (Gautier et al., 2000). Its cross-reactivity with GLP-2 and glucagon was <0.01 and 0.2%, respectively, its limit of detection was 3 pmol/l, and the intra- and inter-assay CVs were 5.7% and 8.9%, respectively. Plasma glucose and insulin concentrations were determined by the glucose oxidase method (Beckman Instruments, Fullerton, CA) and by an automated radioimmunoassay (Concept 4; ICN, Costa Mesa, CA), respectively. Serum free fatty acid (FFA) concentrations were determined by an enzymatic colorimetric method (Wako Chemicals, Richmond, VA).
Imaging procedures
PET and magnetic resonance imaging (MRI) procedures were conducted at the Banner Good Samaritan Medical Center (Phoenix, AZ). Volumetric T1-weighted MRIs of the brain were performed using a 1.5-T Signa system (General Electric, Milwaukee, WI) to rule out gross anatomical abnormalities. PET images of regional cerebral blood flow (counts/voxel/min) were obtained using an ECAT-951/31 scanner (Siemens, Knoxville, TN). A 10 min transmission scan was obtained using a retractable external ring source of 68Ga/68Ge to correct for attenuation of γ-radiation by the brain and skull. During each 1-min PET scan, subjects rested motionless in the supine position and were asked to keep their eyes closed and pointing forward. For each scan, a 50-mCi intravenous bolus of 15O-water was injected. Two scans were obtained at baseline and two after oral administration of a satiating amount of a liquid formula meal (Ensure Plus, 1.5 kcal/ml, Ross-Abbott Laboratories, Columbus, OH) providing 50% of the subject’s measured REE and administered continuously over 25 min through a plastic tube placed into the subject’s mouth using a peristaltic pump, with intervals of 10 min between scans. The flavour (strawberry, vanilla, and chocolate) of the formula meal was chosen by the subject. To control for swallowing, subjects were asked to retain and swallow 2 ml of water at room temperature administered from a syringe through a plastic tube into the mouth 30 s before each scan. Immediately after each scan, a blood sample was drawn for hormonal and metabolic measurements. Subjective ratings of hunger and fullness were recorded after each PET scan by using 100-mm visual analogue scales (Raben et al., 1995). The subjects anticipated being fed until sated, as they had been fully familiarized with the experimental protocol in order to minimize the risk of learning-related artefacts (prior to the imaging session, the procedure was performed twice on the research ward).
Image processing and statistical analysis
Automated algorithms in statistical parametric mapping 99 (SPM99, The Wellcome Institute of Neurology, London, UK; http://www.fil.ion.ucl.ac.uk/spm) were used to align each subject’s sequential PET images, spatially normalize them to the stereotactic space as defined by the template provided by the Montreal Neurological Institute (MNI), and smooth the images with a 15-mm full-width-at-half-maximum Gaussian filter (Friston, 1995). To test our hypothesis, we used a two-level, random-effects analysis (Friston et al., 1999) with a significance threshold of P ≤ 0.001, uncorrected for multiple comparisons. In brief, differences in rCBF in response to the administration of a liquid formula meal were measured in each subject using the “single subject: condition and covariates” option and accounting for the whole brain blood flow by proportional scaling, which scales each image to a reference count (i.e., the global brain activity) set at a physiologically realistic value of 50 ml/100 g/min (Friston et al., 2005). Then, a correlation between changes in rCBF and plasma GLP-1 concentrations was tested as a second-level analysis using both a voxel-based single regression design and a voxel-based multiple regression design, the latter with sex, age, percent body fat, and changes in plasma glucose, plasma insulin, and serum FFA concentrations included into the design matrix as further covariates. We performed a two-level, random-effects analysis since this more stringent statistical approach allows for making a stronger and more generalizable inference about quantitative differences of a regionally specific nature compared to a single-level, fixed-effects analysis, as previously reported (Friston et al., 1999). An effect was considered statistically significant if the test reached the two-sided significance level of P ≤ 0.001 (uncorrected for multiple comparisons). The significant results, however, were reported as either positive or negative correlations between changes in rCBF and in GLP-1 plasma concentrations after the meal. Adjustment of the regression analysis between changes in rCBF and GLP-1 plasma concentrations after the meal for the above confounders was performed to account for the previously reported effects of obesity and related metabolic parameters on both neuronal activity (Gautier et al., 2000, 2001; Le et al., 2006) and GLP-1 secretion (Flint et al., 2001; Verdich et al., 2001). The resulting maps were then superimposed onto the MRI template provided by the MNI and built into SPM to allow visual inspection of the composite images. Average rCBF data from the local maxima were extracted for the post-hoc analysis of the general, anthropometric, and metabolic determinants of the brain responses using Spearman correlation analysis and multivariate regression modelling. The procedures of the SAS Institute (Cary, NC) were used for these statistical analyses.
Results
Significant associations between postprandial changes in plasma GLP-1 concentrations and in rCBF were found in the left dorsolateral prefrontal cortex, including the left middle and inferior frontal gyri (x =−36, y=−1, z=47 and x=−45, y=41, z=−2, respectively) and the hypothalamus (x=−4, y=−3, z=−18). In particular, the changes in plasma GLP-1 concentrations after the meal were positively associated with changes in rCBF in the left middle and inferior frontal gyri and the hypothalamus (Table 2; P <0.001 uncorrected for multiple comparisons for all associations); whereas, no significant negative correlations were found between post-meal changes in plasma GLP-1 concentrations and changes in rCBF.
Table 2.
Neural correlates of the postprandial glucagon-like peptide-1 (GLP-1) response
| Brain region | GLP-1 without covariatesa |
GLP-1 with covariatesa |
||||||
|---|---|---|---|---|---|---|---|---|
| Coordinatesb |
P-value | Coordinatesb |
P-value | |||||
| x | y | z | x | y | z | |||
| L middle frontal gyrus | −36 | −1 | 47 | 0.0004 | −34 | −3 | 47 | 0.0005 |
| L middle frontal gyrus | −40 | 2 | 37 | −40 | 2 | 35 | ||
| L inferior frontal gyrus | −45 | 41 | −2 | 0.0004 | −45 | 39 | −4 | 0.001 |
| Hypothalamus | −4 | −3 | −18 | 0.0003 | −4 | −5 | −16 | 0.007 |
Sex, age, body fat, and postprandial glucose, insulin, and free-fatty acid response.
Coordinates are from the brain atlas of Talairach and Tournoux (1988), such that x is the distance in millimetres to the right (+) or left (−) of midline, y is the distance in millimetres anterior (+) or posterior (−) to the anterior commissure, and z is the distance in millimetres superior (+) or inferior (−) to a horizontal plane through the anterior and posterior commissures.
After adjustment for sex, age, percent body fat, and changes in plasma glucose, insulin, and serum FFA concentrations, the post-meal change in plasma GLP-1 concentrations was still positively associated with the rCBF change both in the left middle and inferior frontal gyri (Fig. 1, P≤0.001, uncorrected for multiple comparisons) and in the hypothalamus (Fig. 1, P= 0.007, uncorrected for multiple comparisons). As in the simple regression analysis (i.e., without correction for any covariates), no significant negative correlations were found between post-meal changes in plasma GLP-1 concentrations and rCBF in the multivariate analysis.
Fig. 1.
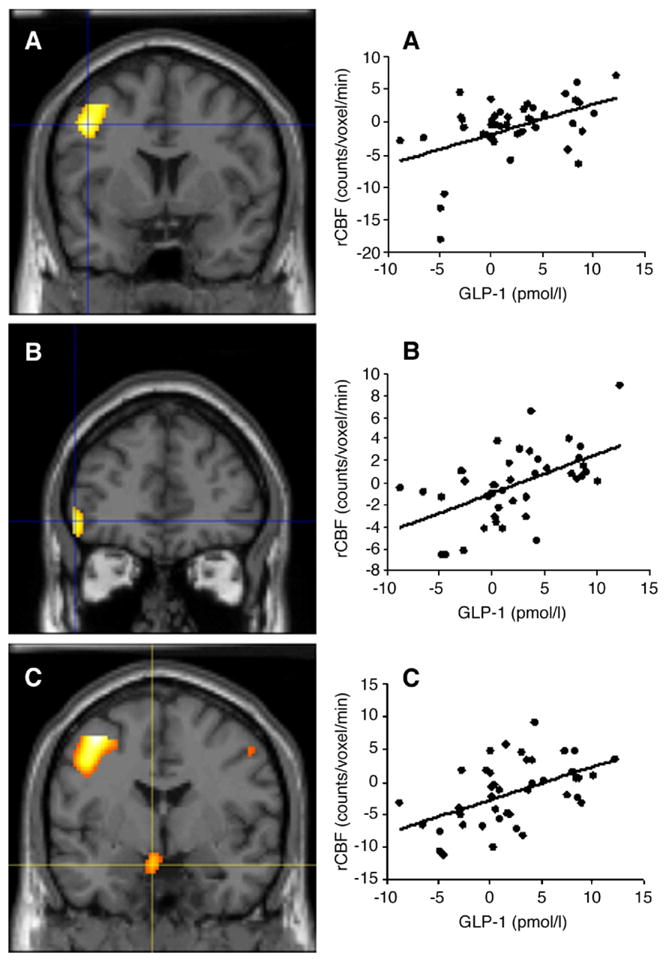
Left panels: Coronal views of the left middle frontal gyrus (A; x=−34, y=−3, z=47), left inferior frontal gyrus (B; x=−45, y=39, z=−4), and hypothalamus (C; x=−4, y=−5, z=−16), where the postprandial change in regional cerebral blood flow (rCBF) is positively correlated with the postprandial change in plasma glucagon-like peptide-1 (GLP-1), after adjustment for sex, age, body fat, and changes in plasma glucose, insulin, and serum free fatty acid (FFA) concentrations in the study subjects. Right panels: Scatter-plots of rCBF in the left middle frontal gyrus (A), left inferior frontal gyrus (B), and hypothalamus (C), as function of the postprandial GLP-1 response.
Using general linear modelling with changes in the ROI-CBF as the dependent variable, the change in plasma GLP-1 concentrations was a significant determinant of the increase in rCBF in both areas of the left dorsolateral prefrontal cortex, i.e., the left middle and inferior frontal gyri (Table 3), brain regions which had been previously implicated in satiety and food intake regulation (Gautier et al., 2000, 2001; Le et al., 2006; Tataranni et al., 1999). In particular, using a stepwise multiple regression approach, the changes in plasma GLP-1 concentrations after the meal explained 24%, 26%, and 29% of the variance in the rCBF changes in the left middle frontal gyrus, left inferior frontal gyrus, and hypothalamus, respectively (data not shown).
Table 3.
Determinants of the regional cerebral blood flow (rCBF) response in the left middle (MFG) and inferior (IFG) frontal gyri and hypothalamus
| Covariate | MFG
|
IFG
|
Hypothalamus
|
|||
|---|---|---|---|---|---|---|
| β | P | β | P | β | P | |
| Sex (M) | 0.93 | n.s. | −0.48 | n.s. | −0.12 | n.s. |
| Age (years) | 0.11 | n.s. | 0.02 | n.s. | 0.01 | n.s. |
| Body fat (%) | 0.18 | n.s. | −0.02 | n.s. | −0.04 | n.s. |
| Change in plasma glucose (mmol/l) | 0.08 | n.s. | 0.04 | n.s. | −0.06 | n.s. |
| Change in plasma insulin (pmol/l) | −0.01 | n.s. | −0.01 | n.s. | −0.01 | n.s. |
| Change in serum free fatty acids (mmol/l) | −4.11 | n.s. | −0.97 | n.s. | −0.81 | n.s. |
| Change in plasma glucagon-like peptide-1 (pmol/l) | 0.13 | 0.01 | 0.09 | 0.01 | 0.13 | 0.01 |
When the regression analysis was performed by using only the first, instead of the average, of the two satiety scans (see Methods section for details on the imaging procedure), i.e., the one taken immediately prior to the blood drawing for the post-meal GLP-1 plasma concentration, the postprandial change in plasma GLP-1 concentrations after adjustment for sex, age, percent body fat, and changes in plasma glucose, insulin, and serum FFA concentrations was still positively associated with the change in rCBF after the meal in the left dorsolateral prefrontal cortex (Talairach and Tournoux atlas coordinates (Talairach and Tournoux, 1988): x=−47, y=20, z=24; P <0.001, uncorrected for multiple comparisons).
Discussion
This study provides evidence that the postprandial GLP-1 response is associated with changes in neuronal activity of the dorsolateral prefrontal cortex and hypothalamus in response to satiety in humans, independent of sex, age, adiposity, and meal-related changes in other metabolites that may affect brain activity, including glucose, insulin, and FFA. The GLP-1 receptor is abundantly expressed in several regions of the human brain, including those reported in this study (Alvarez et al., 2005; Wei and Mojsov, 1995). In addition, direct access of blood-borne GLP-1 to the brain has been proposed to occur via certain CNS areas lacking a typical blood–brain barrier, such as the subfornical organ and area postrema (Orskov et al., 1996).
The hypothesis that peripheral GLP-1 can in fact access the CNS and modulate neuronal activity in humans has recently been confirmed in young adult men and women who were given GLP-1 intravenously (Alvarez et al., 2005). However, in this study, peripheral administration of GLP-1(7–36)amide decreased glucose metabolism in the hypothalamus and brainstem, with no significant effects on cortical areas (Alvarez et al., 2005). Several reasons can be given to explain the differences between the above study and ours. First, Alvarez et al. (2005) used pharmacological doses of exogenous GLP-1 to unravel direct effects of this hormone on the brain; in comparison, we examined the postprandial response of endogenous GLP-1. Second, they used FDG as a PET radiotracer, whose 30-min uptake period and 110-min half-life require a long period of task performance or state maintenance and make it less appropriate for cerebral activation studies (Kessler, 2003). In contrast, we used 15O-water, whose 70-s acquisition period and 2-min half-life allow for a better temporal resolution, thus making it suitable for cerebral activation studies (Kessler, 2003). Third, they evaluated the effects of exogenous GLP-1 on cerebral glucose metabolism regardless of food intake or even food-related stimuli, whereas we examined whether changes in plasma concentrations of endogenous GLP-1 after a liquid meal were related to changes in brain activity in response to satiety.
The findings of an association between postprandial changes in plasma concentrations of GLP-1 and prefrontal neuronal activity are of particular interest in light of the proposed role of GLP-1 as a meal termination signal and the functional neuroanatomy of hunger/ satiety in humans. Moreover, these results are strengthened by the observation that the positive association between postprandial changes in plasma GLP-1 concentrations and rCBF in the left dorsolateral prefrontal cortex was still significant when only the first satiety scan (i.e., the one taken immediately prior to the blood drawing for measuring the post-meal plasma GLP-1 concentrations and more likely to reflect possible “direct” effects of GLP-1, provided its short half-life), instead of the average of the two satiety scans, was employed to create the maps of changes in rCBF.
The study of the human brain response to the ingestion of liquid and solid meals and to the sight of food images before and after eating to satiety has revealed the existence of a putative satiety domain represented by prefrontal areas (Delparigi et al., 2005; Small et al., 2001; Tataranni and Delparigi, 2003). The administration of a liquid meal to hungry individuals was associated with increased neuronal activity in both the dorso- and the ventrolateral prefrontal cortices in PET studies of neuroanatomical correlates of hunger and satiety (Del Parigi et al., 2002; Gautier et al., 2000, 2001). By using a different paradigm based upon the visual presentation of images of preferred food items before and after eating to satiety, the participation of such brain areas in a network implicated in feeding behaviour has been further confirmed in a study showing an increased activation of the lateral prefrontal and temporal cortices during the state of satiety (Hinton et al., 2004). Similarly, the involvement of these neocortical areas in brain networks processing feeding behaviour has also been confirmed by another study demonstrating that eating a preferred food (i.e., chocolate) beyond satiety causes a shift in brain structures selectively recruited to respond to this stimulus from limbic/paralimbic areas, which are mainly activated when the motivation to eat is high, to other regions, including prefrontal areas, that are engaged when the motivational state is low due to satiety (Small et al., 2001).
The findings of an independent association between postprandial changes in GLP-1 plasma concentrations and hypothalamic neuronal activity is consistent with the pivotal role of the hypothalamus in food intake regulation and the demonstrated direct action of GLP-1 on this brain area. The hypothalamus is in fact a major site for the integration of central and peripheral signals that regulate energy homeostasis (Sahu, 2004). Within the hypothalamus, neurons residing in several nuclei communicate with one another and additional regions of the brain and are subjected to the influence of several peripheral factors, including GLP-1. Indeed, GLP-1R is abundantly expressed in both the animal and human hypothalamus (Alvarez et al., 2005; Wei and Mojsov, 1995). More importantly, a direct action on the hypothalamus of peripherally-administered GLP-1, linking it to decreased food intake and energy homeostasis, has been reported (Dakin et al., 2004). It has to be acknowledged, however, that the positive association between postprandial changes in plasma GLP-1 concentrations and hypothalamic rCBF did not reach statistical significance when only the first, instead of the average, of the two satiety scans was employed to create the maps of changes in rCBF.
It is not possible to ascertain the physiological underpinnings of the statistical association between the postprandial GLP-1 response and neuronal activation. In other words, whether the changes in prefrontal and hypothalamic rCBF are a direct or an indirect effect of changes in the concentrations of blood-borne GLP-1 remains to be established. The prefrontal cortex is central to the integration of sensory, limbic, and autonomic information and receives afferents from a number of brain areas that can respond to peripheral GLP-1, including, but not limited to, the hypothalamus, ventral tegmental area, and the midbrain (Groenewegen and Uylings, 2000). Therefore, it may well be that the post-meal GLP-1 response exerts its effects on neurons located in other areas of the CNS (that are easily accessible to peripheral GLP-1 due to the lack of a typical blood–brain barrier) which, in turn, lead to prefrontal activation. Furthermore, other concomitant events to the postprandial GLP-1 secretion and brain activation, including gastric distension induced by the satiating meal or other biological responses to food ingestion, may contribute to the relationship between postprandial changes in GLP-1 plasma concentrations and prefrontal rCBF.
This study was a post-hoc analysis of a cross-sectional investigation of neuroanatomical correlates of hunger and satiation and, therefore, its design was less than optimal to test the effect of GLP-1 on neuronal activity. In fact, the increase in plasma GLP-1 concentrations after the administration of the meal, although significant (P=0.006), was blunted compared to other studies. The experimental design of this investigation explains this observation. Individuals in this study had a satiating amount of a liquid formula meal administered through a plastic tube inserted into the mouth using a peristaltic pump that was set to continuously deliver the entire amount of the liquid meal over a fixed, constant 25-min period of time. This continuous delivery accounts for the mild increase in GLP-1 plasma concentrations seen in our study compared to others in which either solid or liquid foods were usually consumed over 5 to a maximum of 15 min (Ahren et al., 2003; Adam and Westerterp-Plantenga, 2005a,b). In a report in which the nutrient administration was somewhat analogous to our study, a constant intra-duodenal glucose infusion produced a mild increase in plasma GLP-1 concentrations compared to nutrient administration by a rapid bolus followed by continuous infusion (Chaikomin et al., 2005). If anything, we believe that this blunted GLP-1 response may have underestimated the effect of GLP-1 on neuronal activity. In addition, even though most studies have shown stronger increases in plasma GLP-1 concentrations after a meal, other studies have reported postprandial responses of this gut peptide as small as (or even smaller than) ours, despite using a more physiological meal administration (Little et al., 2006; Morinigo et al., 2006), pointing to a large variability of GLP-1 response across studies and populations.
PET results should be interpreted in light of the limitations of this imaging technique. Spatial resolution, contrast resolution of individual subtraction images, and accuracy of the image deformation algorithm make it difficult to specify in detail the structures that are responsible for the observed changes in regional brain activity, as previously reported (Gautier et al., 2000; Reiman et al., 1997; Tataranni et al., 1999). The above mentioned limitations may prevent detection of significant state-dependent changes in regional brain activity in small regions, such as specific hypothalamic nuclei. We did find a positive association between the postprandial changes in plasma GLP-1 concentrations and rCBF in the vicinity of the hypothalamus. In this respect, resolution/standardization issues with small structures, such as the hypothalamus, would be more likely to lead to false negative than false positive results. Limitations in the study design also must be acknowledged. The baseline condition was characterized by a rather accentuated state of hunger after a 36-h fast. This was done to produce behavioural states of sufficient intensity to maximize the chances of detecting brain regions selectively affected during these conditions. Subjects were studied in a resting condition, rather than during systematically manipulated mental activity. Although the possibility that the subjects engaged in more spontaneous visual imagery in one condition vs. the other cannot be excluded, it is our experience that the subject’s behavioural state is not significantly different during sequential 1-min scans.
On the other hand, it is worth noting that the present findings were obtained by using a more stringent statistical approach than the fixed-effects design, i.e., a random-effects analysis. With the former approach, the P value ascribed to a particular effect does not reflect the likelihood for this effect to be present but simply the probability of obtaining the observed data in the effect’s absence (Friston et al., 2002b). In contrast, the random-effects approach allows for making inferences on the average characteristics of a population above and beyond the variation in activation from subject to subject because it accounts for both within-subject (i.e., between scan) and between-subject sources of variability (Friston et al., 1999, 2002a,b).
In conclusion, despite the limitations inherent in the experimental design, this study provides some important information. It demonstrates, in fact, that the postprandial GLP-1 response is associated with activation in the hypothalamus and prefrontal areas of the brain independent of sex, age, adiposity, and postprandial changes in other metabolites, pointing to a possible effect, direct or indirect, of postprandial GLP-1 on some of the areas of the human brain previously implicated in satiety, meal termination, and food intake regulation. These observations may shed further light upon the mechanisms involved in the satiety-inducing effect of GLP-1.
Acknowledgments
We thank the volunteers for their participation in this study and the nursing and dietary staffs, physician assistants, and lab technicians of the clinical research centre for their valuable assistance.
Critical review of the manuscript by Dr. Robert L. Hanson, MD with the Phoenix Epidemiology and Clinical Research Branch, NIDDK-NIH is gratefully acknowledged.
This research was supported by the Intramural Research Program of the NIH, NIDDK.
References
- Adam TC, Westerterp-Plantenga MS. Glucagon-like peptide-1 release and satiety after a nutrient challenge in normal-weight and obese subjects. Br J Nutr. 2005a;93:845–851. doi: 10.1079/bjn20041335. [DOI] [PubMed] [Google Scholar]
- Adam TC, Westerterp-Plantenga MS. Nutrient-stimulated GLP-1 release in normal-weight men and women. Horm Metab Res. 2005b;37:111–117. doi: 10.1055/s-2005-861160. [DOI] [PubMed] [Google Scholar]
- Ahren B, Holst JJ, Mari A. Characterization of GLP-1 effects on beta-cell function after meal ingestion in humans. Diabetes Care. 2003;26:2860–2864. doi: 10.2337/diacare.26.10.2860. [DOI] [PubMed] [Google Scholar]
- Alvarez E, Martinez MD, Roncero I, Chowen JA, Garcia-Cuartero B, Gispert JD, Sanz C, Vazquez P, Maldonado A, de Caceres J, Desco M, Pozo MA, Blazquez E. The expression of GLP-1 receptor mRNA and protein allows the effect of GLP-1 on glucose metabolism in the human hypothalamus and brainstem. J Neurochem. 2005;92:798–806. doi: 10.1111/j.1471-4159.2004.02914.x. [DOI] [PubMed] [Google Scholar]
- Chaikomin R, Doran S, Jones KL, Feinle-Bisset C, O’Donovan D, Rayner CK, Horowitz M. Initially more rapid small intestinal glucose delivery increases plasma insulin, GIP, and GLP-1 but does not improve overall glycemia in healthy subjects. Am J Physiol: Endocrinol Metab. 2005;289:E504–E507. doi: 10.1152/ajpendo.00099.2005. [DOI] [PubMed] [Google Scholar]
- Dakin CL, Small CJ, Batterham RL, Neary NM, Cohen MA, Patterson M, Ghatei MA, Bloom SR. Peripheral oxyntomodulin reduces food intake and body weight gain in rats. Endocrinology. 2004;145:2687–2695. doi: 10.1210/en.2003-1338. [DOI] [PubMed] [Google Scholar]
- Deacon CF. What do we know about the secretion and degradation of incretin hormones? Regul Pept. 2005;128:117–124. doi: 10.1016/j.regpep.2004.06.007. [DOI] [PubMed] [Google Scholar]
- Del Parigi A, Gautier JF, Chen K, Salbe AD, Ravussin E, Reiman E, Tataranni PA. Neuroimaging and obesity: mapping the brain responses to hunger and satiation in humans using positron emission tomography. Ann N Y Acad Sci. 2002;967:389–397. [PubMed] [Google Scholar]
- Delparigi A, Pannacciulli N, Le DN, Tataranni PA. In pursuit of neural risk factors for weight gain in humans. Neurobiol Aging. 2005;26 (Suppl 1):50–55. doi: 10.1016/j.neurobiolaging.2005.09.008. [DOI] [PubMed] [Google Scholar]
- Drucker DJ. Minireview: the glucagon-like peptides. Endocrinology. 2001;142:521–527. doi: 10.1210/endo.142.2.7983. [DOI] [PubMed] [Google Scholar]
- Flint A, Raben A, Astrup A, Holst JJ. Glucagon-like peptide 1 promotes satiety and suppresses energy intake in humans. J Clin Invest. 1998;101:515–520. doi: 10.1172/JCI990. [DOI] [PMC free article] [PubMed] [Google Scholar]
- Flint A, Raben A, Ersboll AK, Holst JJ, Astrup A. The effect of physiological levels of glucagon-like peptide-1 on appetite, gastric emptying, energy and substrate metabolism in obesity. Int J Obes Relat Metab Disord. 2001;25:781–792. doi: 10.1038/sj.ijo.0801627. [DOI] [PubMed] [Google Scholar]
- Friston KJ. Commentary and opinion: II. Statistical parametric mapping: ontology and current issues. J Cereb Blood Flow Metab. 1995;15:361–370. doi: 10.1038/jcbfm.1995.45. [DOI] [PubMed] [Google Scholar]
- Friston KJ, Holmes AP, Worsley KJ. How many subjects constitute a study? NeuroImage. 1999;10:1–5. doi: 10.1006/nimg.1999.0439. [DOI] [PubMed] [Google Scholar]
- Friston KJ, Glaser DE, Henson RN, Kiebel S, Phillips C, Ashburner J. Classical and Bayesian inference in neuroimaging: applications. NeuroImage. 2002a;16:484–512. doi: 10.1006/nimg.2002.1091. [DOI] [PubMed] [Google Scholar]
- Friston KJ, Penny W, Phillips C, Kiebel S, Hinton G, Ashburner J. Classical and Bayesian inference in neuroimaging: theory. NeuroImage. 2002b;16:465–483. doi: 10.1006/nimg.2002.1090. [DOI] [PubMed] [Google Scholar]
- Friston KJ, Holmes AP, Worsley KJ, Poline JP, Frackowiak RSJ. Statistical parametric maps in functional imaging: a general linear approach. Hum Brain Mapp. 2005;2:189–210. [Google Scholar]
- Gautier JF, Chen K, Salbe AD, Bandy D, Pratley RE, Heiman M, Ravussin E, Reiman EM, Tataranni PA. Differential brain responses to satiation in obese and lean men. Diabetes. 2000;49:838–846. doi: 10.2337/diabetes.49.5.838. [DOI] [PubMed] [Google Scholar]
- Gautier JF, Del Parigi A, Chen K, Salbe AD, Bandy D, Pratley RE, Ravussin E, Reiman EM, Tataranni PA. Effect of satiation on brain activity in obese and lean women. Obes Res. 2001;9:676–684. doi: 10.1038/oby.2001.92. [DOI] [PubMed] [Google Scholar]
- Gottfried JA, O’Doherty J, Dolan RJ. Encoding predictive reward value in human amygdala and orbitofrontal cortex. Science. 2003;301:1104–1107. doi: 10.1126/science.1087919. [DOI] [PubMed] [Google Scholar]
- Groenewegen HJ, Uylings HB. The prefrontal cortex and the integration of sensory, limbic and autonomic information. Prog Brain Res. 2000;126:3–28. doi: 10.1016/S0079-6123(00)26003-2. [DOI] [PubMed] [Google Scholar]
- Hinton EC, Parkinson JA, Holland AJ, Arana FS, Roberts AC, Owen AM. Neural contributions to the motivational control of appetite in humans. Eur J Neurosci. 2004;20:1411–1418. doi: 10.1111/j.1460-9568.2004.03589.x. [DOI] [PubMed] [Google Scholar]
- Kessler RM. Imaging methods for evaluating brain function in man. Neurobiol Aging. 2003;24 (Suppl 1):S21–S35. doi: 10.1016/s0197-4580(03)00047-2. [DOI] [PubMed] [Google Scholar]
- Kreymann B, Williams G, Ghatei MA, Bloom SR. Glucagon-like peptide-1 7–36: a physiological incretin in man. Lancet. 1987;2:1300–1304. doi: 10.1016/s0140-6736(87)91194-9. [DOI] [PubMed] [Google Scholar]
- LaBar KS, Gitelman DR, Parrish TB, Kim YH, Nobre AC, Mesulam MM. Hunger selectively modulates corticolimbic activation to food stimuli in humans. Behav Neurosci. 2001;115:493–500. doi: 10.1037/0735-7044.115.2.493. [DOI] [PubMed] [Google Scholar]
- Le DS, Pannacciulli N, Chen K, Del Parigi A, Salbe AD, Reiman EM, Krakoff J. Less activation of the left dorsolateral prefrontal cortex in response to a meal: a feature of obesity. Am J Clin Nutr. 2006;84:725–731. doi: 10.1093/ajcn/84.4.725. [DOI] [PubMed] [Google Scholar]
- Little TJ, Pilichiewicz AN, Russo A, Phillips L, Jones KL, Nauck MA, Wishart J, Horowitz M, Feinle-Bisset C. Effects of intravenous GLP-1 on gastric emptying and intragastric distribution in healthy subjects. J Clin Endocrinol Metab. 2006 doi: 10.1210/jc.2005-2220. [DOI] [PubMed] [Google Scholar]
- Morinigo R, Moize V, Musri M, Lacy AM, Navarro S, Marin JL, Delgado S, Casamitjana R, Vidal J. Glucagon-like peptide-1, peptide YY, hunger, and satiety after gastric bypass surgery in morbidly obese subjects. J Clin Endocrinol Metab. 2006;91:1735–1740. doi: 10.1210/jc.2005-0904. [DOI] [PubMed] [Google Scholar]
- Morris JS, Dolan RJ. Involvement of human amygdala and orbitofrontal cortex in hunger-enhanced memory for food stimuli. J Neurosci. 2001;21:5304–5310. doi: 10.1523/JNEUROSCI.21-14-05304.2001. [DOI] [PMC free article] [PubMed] [Google Scholar]
- O’Doherty J, Rolls ET, Francis S, Bowtell R, McGlone F, Kobal G, Renner B, Ahne G. Sensory-specific satiety-related olfactory activation of the human orbitofrontal cortex. NeuroReport. 2000;11:893–897. doi: 10.1097/00001756-200003200-00046. [DOI] [PubMed] [Google Scholar]
- Orskov C, Poulsen SS, Moller M, Holst JJ. Glucagon-like peptide I receptors in the subfornical organ and the area postrema are accessible to circulating glucagon-like peptide I. Diabetes. 1996;45:832–835. doi: 10.2337/diab.45.6.832. [DOI] [PubMed] [Google Scholar]
- Raben A, Tagliabue A, Astrup A. The reproducibility of subjective appetite scores. Br J Nutr. 1995;73:517–530. doi: 10.1079/bjn19950056. [DOI] [PubMed] [Google Scholar]
- Reiman EM, Lane RD, Ahern GL, Schwartz GE, Davidson RJ, Friston KJ, Yun LS, Chen K. Neuroanatomical correlates of externally and internally generated human emotion. Am J Psychiatry. 1997;154:918–925. doi: 10.1176/ajp.154.7.918. [DOI] [PubMed] [Google Scholar]
- Sahu A. Minireview: a hypothalamic role in energy balance with special emphasis on leptin. Endocrinology. 2004;145:2613–2620. doi: 10.1210/en.2004-0032. [DOI] [PubMed] [Google Scholar]
- Scrocchi LA, Hill ME, Saleh J, Perkins B, Drucker DJ. Elimination of glucagon-like peptide 1R signaling does not modify weight gain and islet adaptation in mice with combined disruption of leptin and GLP-1 action. Diabetes. 2000;49:1552–1560. doi: 10.2337/diabetes.49.9.1552. [DOI] [PubMed] [Google Scholar]
- Small DM, Zatorre RJ, Dagher A, Evans AC, Jones-Gotman M. Changes in brain activity related to eating chocolate: from pleasure to aversion. Brain. 2001;124:1720–1733. doi: 10.1093/brain/124.9.1720. [DOI] [PubMed] [Google Scholar]
- Talairach J, Tournoux P. Co-Planar Stereotaxic Atlas of the Human Brain. Thieme Medical; New York: 1988. [Google Scholar]
- Tataranni PA, Delparigi A. Functional neuroimaging: a new generation of human brain studies in obesity research. Obes Rev. 2003;4:229–238. doi: 10.1046/j.1467-789x.2003.00111.x. [DOI] [PubMed] [Google Scholar]
- Tataranni PA, Gautier JF, Chen K, Uecker A, Bandy D, Salbe AD, Pratley RE, Lawson M, Reiman EM, Ravussin E. Neuroanatomical correlates of hunger and satiation in humans using positron emission tomography. Proc Natl Acad Sci U S A. 1999;96:4569–4574. doi: 10.1073/pnas.96.8.4569. [DOI] [PMC free article] [PubMed] [Google Scholar]
- Uher R, Treasure J, Heining M, Brammer MJ, Campbell IC. Cerebral processing of food-related stimuli: effects of fasting and gender. Behav Brain Res. 2006;169:111–119. doi: 10.1016/j.bbr.2005.12.008. [DOI] [PubMed] [Google Scholar]
- Verdich C, Toubro S, Buemann B, Lysgard MJ, Juul HJ, Astrup A. The role of postprandial releases of insulin and incretin hormones in meal-induced satiety—effect of obesity and weight reduction. Int J Obes Relat Metab Disord. 2001;25:1206–1214. doi: 10.1038/sj.ijo.0801655. [DOI] [PubMed] [Google Scholar]
- Wei Y, Mojsov S. Tissue-specific expression of the human receptor for glucagon-like peptide-I: brain, heart and pancreatic forms have the same deduced amino acid sequences. FEBS Lett. 1995;358:219–224. doi: 10.1016/0014-5793(94)01430-9. [DOI] [PubMed] [Google Scholar]