

Abstract
This study aimed to provide the foundation for an integrative approach to the identification of the mechanisms underlying the response to infection with Trypanosoma congolense, and to identify pathways that have previously been overlooked. We undertook a large-scale gene expression analysis study comparing susceptible A/J and more tolerant C57BL/6 mice. In an initial time course experiment, we monitored the development of parasitaemia and anaemia in every individual. Based on the kinetics of disease progression, we extracted total RNA from liver at days 0, 4, 7, 10 and 17 post infection and performed a microarray analysis. We identified 64 genes that were differentially expressed in the two strains in non-infected animals, of which nine genes remained largely unaffected by the disease. Gene expression profiling at stages of low, peak, clearance and recurrence of parasitaemia suggest that susceptibility is associated with high expression of genes coding for chemokines (e.g. Ccl24, Ccl27 and Cxcl13), complement components (C1q and C3) and interferon receptor alpha (Ifnar1). Additionally, susceptible A/J mice expressed higher levels of some potassium channel genes. In contrast, messenger RNA levels of a few immune response, metabolism and protease genes (e.g. Prss7 and Mmp13) were higher in the tolerant C57BL/6 strain as compared to A/J.
Keywords: microarray, gene expression, African trypanosomiasis, parasite infection, host response, susceptibility
Introduction
Tsetse fly-transmitted infection with Trypanosoma congolense is a serious constraint on livestock husbandry and economic development in sub-Saharan Africa. Although a number of control measurements have been implemented for many years, no significant progress has been achieved in the eradiation of the disease.1 African trypanosomes are known for their ability to switch their surface antigens (variant surface glycoprotein) and to manipulate the host’s immune system by a variety of immunosuppressive and -evasive mechanisms.2,3 The development of a vaccine has been particularly challenging and so far unsuccessful.4 A better understanding of trypanotolerance, the ability of some indigenous breeds of cattle and other ruminants to resist sickness despite latent infection, seems to be the most promising approach to disease control.5-7 A mouse model of genetic control of trypanotolerance exists based on A/J as a susceptible strain and C57BL/6 as a tolerant strain. This model is widely accepted and has led to the identification of five major quantitative trait loci (QTL) on mouse chromosomes 1, 5 and 17, associated with survival time.8,9 Until recently, most investigators have focused their research on the innate and adaptive immune response to T. congolense infection, investigating components such as trypanosome-specific and nonspecific antibody production, subsets of T cells, complement pathway, cytokine and nitric oxide production, and specific proteins such as heat-shock protein 70.1 and arginase.10-18 Although these studies have led to important findings, the measurement of a small number of components in any one study has limited the ability to integrate individual results. Microarray-based gene expression assays provide the ability to study the expression of large numbers of genes simultaneously. We undertook a microarray study of gene expression in A/J and C57BL/6 mice to explore the ability of a more integrated analysis of genetics of trypanotolerance and identify pathways involved in trypanotolerance that had been previously overlooked.
Results
Kinetics of T. congolense infection in A/J and C57BL/6 mice
A small number of blood parasites was observed in a few animals at day 4, but almost all animals had significant numbers of trypanosomes in their blood at day 6. The difference between strains in parasite numbers was significant (P = 0.0005) with an average of 5.24 × 10⁶ and 3.02 × 10⁶ trypanosomes/ml blood in A/J and C57BL/6, respectively. As shown in Figure 1a, mice of both strains reached their peak parasitaemia at around day 8 post infection. At this stage, A/J mice had an average of at least 1.07 × 10⁸ trypanosomes/ml compared to 3.83 × 10⁷ trypanosomes/ml in C57BL/6 mice. Thus, mice of the susceptible A/J strain had approximately three times higher parasite load at this time point (t-test, P<0.0001). Animals of both strains were able to significantly reduce their parasitaemia by day 10, at which stage there was no significant difference between the two strains. A/J mice showed a rapid and extensive recurrence of parasitaemia that was almost 100 times higher than C57BL/6 at 18 days post infection. C57BL/6 also showed a recurrence of parasites, but the parasitaemia was significantly lower than in A/J at all stages (two-way analysis of variance (ANOVA), P<0.0001). Taken together, A/J and C57BL/6 mice significantly differed in the development and degree of parasitaemia (two-way ANOVA, P<0.0001).
Figure 1.
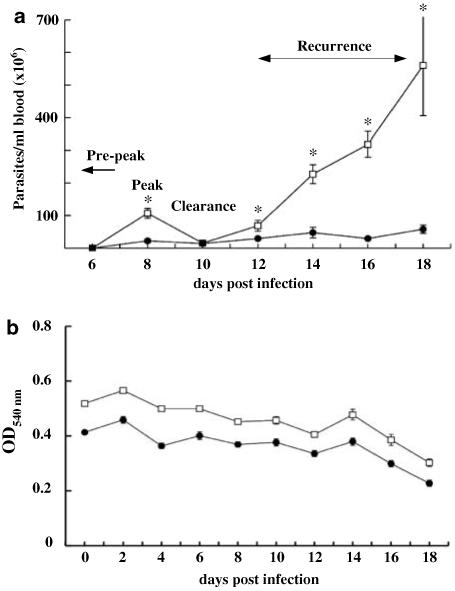
Kinetics of T. congolense infection in A/J and C57BL/6 mice. Mice of the susceptible A/J and the resistant C57BL/6 stain were infected with T. congolense by i.p. injection of 1 × 10⁴ parasites. Tail blood was collected every other day from each individual. (a) Parasites were counted from 3 μl of blood, diluted 1:200 in Alsevers solution, under the microscope using a haemocytometer. Average parasite counts are expressed as number of parasites per ml. A/J mice had significantly higher parasite counts at day 8 (t-test, P<0.0001), but both strains were able to reduce their trypanosome load by day 10 at which stage there was no significant difference between the two strains. However, the parasite numbers were again significantly higher in A/J mice at all following time points (two-way ANOVA, P<0.0001). (b) To determine blood haemoglobin content, an additional 2 μl of blood was collected and diluted in 150 μl distilled water. After lysis of erythrocytes and removal of the cell debris, supernatants were transferred into 96-well plates, and optical density at 540 nm was determined using an enzyme-linked immunosorbent assay plate reader. Sampling and measurements were carried out in triplicate for each mouse. A/J and C57BL/6 mice had significantly different levels of haemoglobin (two-way ANOVA, P<0.0001) and maintained this difference throughout the study period. *Indicates statistically significant difference.
Haemoglobin levels in A/J mice were significantly higher than in C57BL/6 pre-infection and this difference remained over the entire study period (Figure 1b, two-way ANOVA, P<0.0001). Both strains developed first signs of anaemia at day 4, at the time point when the first parasites were seen in the blood stream with significant reductions over time (two-way ANOVA, P<0.0001). The reduction of haemoglobin post infection did not differ significantly between the two strains.
A/J and C57BL/6 baseline differential gene expression
The gene expression profiling was designed to characterize gene expression differences at four defined stages of trypanosomiasis, namely ‘no infection’, ‘peak parasitaemia’, ‘clearance’ and ‘recurring parasitaemia’ (Figure 1a). Expression differences that were initially identified on microarrays using RNA from one set of mice were confirmed by quantitative polymerase chain reaction (PCR) from a second set of mice from an independent experiment. We identified 64 out of 7000 genes that were at least two-fold differentially expressed in uninfected A/J vs C57BL/6 mice. The expression of nine of these strain-specific genes was not further changed during trypanosome infection (Table 1). Eighteen genes were more than two-fold higher expressed in A/J mice as compared to C57BL/6, of which four are involved in immunologic processes. Among the in A/J overexpressed genes was phosphatidylethanolamine binding protein (Pbp). Real-time PCR confirmed that this gene was on average 2.14-fold (range 2.02-2.27) more highly expressed in A/J than C57BL/6 at all time points (n = 10/strain). We observed 46 genes that had significantly higher expression levels in uninfected C57BL/6 mice. Several of these genes are involved in metabolism and biosynthesis (13 out of 46), and another five genes play a role in immunological pathways. Table 1 gives a summary of the differentially expressed genes in non-infected mice, including their chromosomal localization. The nine genes for which expression was largely unaffected by the disease are marked with an asterisk (*).
Table 1.
Genes that were ≥two-fold up-regulated in A/J (top part) and C57BL/6 (bottom part, next page) at day 0
| Gene Id | Symbol | Gene name | MMU | cM | Biological process | |
|---|---|---|---|---|---|---|
| NM_011318 | * | Apcs | Serum amyloid P-component | 1 | 94.2 | |
| NM_021304 | * | Abhd1 | Abhydrolase domain containing 1 | 5 | 83 | Biological_process unknown |
| NM_018858 | * | Pbp | Phosphatidylethanolamine binding protein | 5 | 63 | |
| NM_007822 | * | Cyp4a14 | Cytochrome P450, family 4, subfamily x | 4 | 49.5 | Electron transport |
| NM_016981 | Slc9a1 | Solute carrier family 9 | 4 | 64.6 | Transport; regulation of pH; sodium ion transport | |
| NM_007846 | Defcrs | Defensin-related cryptdin, related sequence | ||||
| NM_015762 | Txnrd1 | Thioredoxin reductase 1 | 10 | 72 | Electron transport; thioredoxin pathway | |
| NM_008766 | Slc22a6 | Solute carrier family 22 | 19 | 0 | Transport; ion transport; anion transport | |
| NM_019545 | Hao3 | Hydroxyacid oxidase (glycolate oxidase) 3 | 3 | 110 | Electron transport; protein targeting | |
| X81439 | ||||||
| NM_007598 | Cap1 | Adenylyl cyclase-assoc. CAP protein homologue 1 | 4 | 82.5 | Cellular morphogenesis | |
| NM_009286 | Sth2 | Sulphotransferase, hydroxysteroid preferring 2 | Steroid metabolism | |||
| M19226 | ||||||
| NM_010585 | ||||||
| NM_010091 | Dvl1 | Dishevelled, dsh homologue 1 | 4 | 82 | Development; intracellular signalling cascade | |
| NM_011696 | Vdac3 | Voltage-dependent anion channel 3 | 8 | 8 | Behavioural fear response; learning; anion transport | |
| NM_008093 | Gata5 | GATA binding protein 5 | 2 | 106 | Regulation of transcription, DNA-dependent | |
| NM_011338 | Ccl9 | Chemokine (C-C motif) ligand 9 | 11 | 47.4 | Signal transduction; chemotaxis; immune response | |
| NM_009688 | Birc4 | Baculoviral IAP repeat-containing 4 | X | 55 | Apoptosis; antiapoptosis | |
| NM_008648 | * | Mup4 | Major urinary protein 4 | 4 | 27.8 | Transport |
| NM_011183 | * | Psen2 | Presenilin 2 | 1 | Intracellular signalling cascade | |
| NM_010406 | * | Hc | Haemolytic complement | 2 | 23.5 | Cytolysis; inflamm response; complement activation |
| NM_019414 | * | Selenbp2 | Selenium binding protein 2 | 3 | 50.8 | |
| NM_016978 | * | Oat | Ornithine aminotransferase | 7 | 63 | Amino-acid metabolism |
| M27608 | Mup1 | Major urinary protein 1 | Transport; immediate hypersensitivity response | |||
| NM_010924 | Nnmt | Nicotinamide N-methyltransferase | 9 | 29 | ||
| NM_013541 | Gstp2 | Glutathione S-transferase, pi 2 | 19 | 0 | Glutathione conjugation reaction | |
| NM_008293 | Hsd3b1 | Hydroxysteroid dehydrogenase-1, Δ⟨5⟩-3-beta | 3 | 49.1 | C21-steroid hormone biosynthesis | |
| NM_016974 | Dbp | D site albumin promoter binding protein | 7 | 23 | Circadian rhythm; regulation of transcription | |
| AF221095 | Ndst3 | N-deacetylase/N-sulphotransferase | 3 | 110 | ||
| NM_007546 | Biklk | Bcl2-interacting killer-like | 15 | 64 | ||
| NM_021489 | F12 | Coagulation factor XII (Hageman factor) | 13 | 60 | Proteolysis and peptidolysis | |
| NM_007819 | Cyp3a13 | Cytochrome P450, family 3, subfamily a | 5 | 83 | Electron transport | |
| X71479 | Cyp4a12 | Cytochrome P450, family 4, subfamily x | 4 | 49.5 | Electron transport | |
| NM_007482 | Arg1 | Arginase 1, liver | 10 | 72 | Urea cycle; arginine metabolism; arginine catabolism | |
| NM_008182 | Gsta2 | Glutathione S-transferase, alpha 2 (Yc2) | 9 | 44 | ||
| NM_007703 | Elovl3 | Elongation of very long fatty acids-like 4 | 19 | 47 | Fatty acid biosynthesis | |
| NM_019455 | Ptgds2 | Prostaglandin D2 synthase 2, haematopoietic | 6 | 88 | Prostaglandin metabolism; prostaglandin biosynthesis | |
| X05475 | C9 | Complement component 9 | 15 | 64 | Cytolysis; complement activation | |
| AB041540 | Tm4sf10 | Transmembrane 4 superfamily member 13 | X | 55 | ||
| M92417 | Stfa1 | Stefin A1 | ||||
| NM_011765 | Zfp97 | Zinc finger protein 97 | ||||
| NM_009127 | Scd1 | Stearoyl-coenzyme A desaturase 1 | 19 | 43 | Fatty acid biosynthesis | |
| NM_011979 | Vnn3 | Vanin 3 | 10 | 72 | Nitrogen metabolism | |
| AF187099 | Cml5 | Camello-like 5 | 6 | 88 | Negative regulation of cell adhesion | |
| U27014 | Sdh1 | Sorbitol dehydrogenase 1 | 2 | 66 | ||
| NM_015729 | Acox1 | Acyl-coenzyme A oxidase 1, palmitoyl | 11 | 77 | Electron transport; fatty acid metabolism | |
| NM_018853 | Rplp1 | Ribosomal protein, large, P1 | 8 | 72.4 | Protein biosynthesis; translational elongation | |
| NM_011433 | Soat2 | Sterol O-acyltransferase 2 | 15 | 61.7 | Metabolism | |
| NM_010401 | Hal | Histidine ammonia lyase | 10 | 51 | Histidine metabolism; his catabolism | |
| NM_010288 | Gja1 | Gap junction membrane protein epsilon 1 | 10 | 29 | Cell-cell signalling; regulation of heart rate | |
| AB028071 | Keg1 | Kidney expressed gene 1 | 19 | 56 | ||
| NM_009581 | Zp3r | Zona pellucida 3 receptor | 1 | 67 | Fertilization; binding of sperm to zona pellucida | |
| NM_009732 | Avp | Arginine vasopressin | 2 | 73.2 | Regulation of blood pressure | |
| NM_011125 | Pltp | Phospholipid transfer protein | 2 | 93 | Lipid transport | |
| NM_013593 | Mb | Myoglobin | 15 | 43.3 | Transport; oxygen transport | |
| NM_019639 | ||||||
| AF290877 | Wasf1 | WASP family 1 | 10 | 25 | Cell motility; cellular morphogenesis; | |
| NM_008843 | Pip | Prolactin-induced protein | 6 | 88 | ||
| NM_021537 | Stk25 | Serine/threonine kinase 25 | 1 | 58 | Protein amino-acid phosphorylation | |
| NM_013806 | Abcc2 | ATP-binding cassette, sub-family C | 19 | 43 | Transport | |
| NM_013797 | Slc21a1 | Solute carrier family 21 | 6 | 88 | Transport; ion transport; organic anion transport | |
| M59912 | Kitl | Kit ligand | 10 | 57 | Cell adhesion; germ-cell development | |
| NM_013917 | Pttg1 | Pituitary tumour-transforming 1 | 11 | 77 | Cell growth and/or maintenance; mitosis; DNA repair |
Time course and expression patterns during the disease progress
Day 4
At this time point, where individuals had very few parasites in their blood, A/J mice appeared to have higher expression levels of genes of metabolic, biosynthesis and molecular transport pathways. Among these genes (marked with ◇ in Table 2) were glucose-6-phosphatase (G6pc) and carbonic anhydrase 3 (Car3). Out of the 34 genes with at least two-fold higher expression in A/J vs C57BL/6 mice, a remarkably high number of genes was involved in cell growth and differentiation (anti-apoptosis) as well as increased expression of cell surface receptors (marked with # in Table 2). The relative gene expression changes between days 0 (not infected) and 4 are depictured as a scatter plot in Figure 2a. A list of the 50 differentially expressed genes is given in Table 2.
Table 2.
Genes that were ≥2-fold up-regulated in A/J (top part) and C57BL/6 (bottom part) at day 4
| Gene Id | Symbol | Gene name | MMU | cM | Biological process | |
|---|---|---|---|---|---|---|
| NM_008061 | ◇ | G6pc | Glucose-6-phosphatase, catalytic | 11 | 77 | Glycogen biosynthesis |
| NM_007834 | ◇ | Dscr3 | Down syndrome critical region gene 3 | 16 | 63 | Intracellular protein transport |
| NM_007606 | ◇ | Car3 | Carbonic anhydrase 3 | 3 | 11.7 | One-carbon compound metabolism |
| NM_019545 | ◇ | Hao3 | Hydroxyacid oxidase (glycolate oxidase) 3 | 3 | 110 | Electron transport; protein targeting |
| NM_007618 | ◇ | Serpina6 | Serine (or cysteine) proteinase inhibitor | 12 | 51 | Transport |
| NM_011318 | Apcs | Serum amyloid P-component | 1 | 94.2 | ||
| NM_021304 | Abhd1 | Abhydrolase domain containing 1 | 5 | 83 | Biological process unknown | |
| NM_018858 | Pbp | Phosphatidylethanolamine binding protein | 5 | 63 | ||
| NM_008766 | Slc22a6 | Solute carrier family 22 | 19 | 0 | Transport; ion transport; anion transport | |
| NM_007846 | Defcrs | Defensin-related cryptdin, related sequence | ||||
| NM_007822 | Cyp4a14 | Cytochrome P450, family 4 | 4 | 49.5 | Electron transport | |
| NM_009376 | TgN737Rpw | Transgene 737, polycystic kidney disease | 14 | 21 | Ant/post pattern formation; digit morphogenesis | |
| AB049623 | 0610025L15Rik | RIKEN cDNA 0610025L15 gene | 7 | 74.5 | ||
| NM_007559 | Bmp8b | Bone morphogenetic protein 8b | 4 | 57.4 | Spermatogenesis; TGFbeta receptor signalling | |
| NM_009155 | Sepp1 | Selenoprotein P, plasma, 1 | Biological process unknown | |||
| AF248643 | Actn2 | Actinin alpha 2 | 13 | 7 | Muscle contraction | |
| NM_007408 | # | Adfp | Adipose differentiation-related protein | 4 | 38.9 | Biological process unknown |
| AF304118 | # | Ptdsr | Phosphatidylserine receptor | 11 | 75 | Cell surface receptor signal transduc; apoptosis |
| NM_019578 | # | Extl1 | Exostoses (multiple)-like 1 | 4 | 60 | Cell growth and/or maintenance |
| NM_007419 | # | Adrb1 | Adrenergic receptor, beta 1 | 19 | 51 | G-protein-coupled receptor protein signalling |
| NM_009688 | # | Birc4 | Baculoviral IAP repeat-containing 4 | X | 55 | Apoptosis; antiapoptosis |
| NM_013590 | # | Lzp-s | P lysozyme structural | Carbohydrate metabolism; cell wall catabolism | ||
| NM_010496 | # | Idb2 | Inhibitor of DNA binding 2 | 12 | 7 | Development; lymph gland development |
| M16355 | Mup1 | Major urinary protein 1 | Transport; immediate hypersensitivity response | |||
| NM_010924 | Nnmt | Nicotinamide N-methyltransferase | 9 | 29 | ||
| M27608 | Mup1 | Major urinary protein 1 | Transport; immediate hypersensitivity response | |||
| AF221095 | Ndst3 | N-deacetylase/N-sulphotransferase | 3 | 110 | ||
| NM_011183 | Psen2 | Presenilin 2 | Intracellular signalling cascade | |||
| NM_008648 | Mup4 | Major urinary protein 4 | 4 | 27.8 | Transport | |
| NM_010406 | Hc | Haemolytic complement | 2 | 23.5 | Cytolysis; inflamm respon; complement activation | |
| NM_007825 | Cyp7b1 | Cytochrome P450, family 7 | 3 | 1 | Electron transport; cholesterol metabolism | |
| NM_010401 | Hal | Histidine ammonia lyase | 10 | 51 | Biosynthesis; his metabolism; his catabolism | |
| X05475 | C9 | Complement component 9 | 15 | 64 | Cytolysis; complement activation | |
| NM_013541 | Gstp2 | Glutathione S-transferase, pi 2 | 19 | 0 | Glutathione conjugation reaction | |
| NM_009127 | Scd1 | Stearoyl-coenzyme A desaturase 1 | 19 | 43 | Fatty acid biosynthesis | |
| NM_007819 | Cyp3a13 | Cytochrome P450, family 3 | 5 | 83 | Electron transport | |
| NM_008293 | Hsd3b1 | Hydroxysteroid dehydrogenase | 3 | 49.1 | Steroid biosynthesis | |
| NM_007546 | Biklk | Bcl2-interacting killer-like | 15 | 64 | ||
| NM_019639 | ||||||
| NM_016978 | Oat | Ornithine aminotransferase | 7 | 63 | Amino acid metabolism | |
| NM_021537 | Stk25 | Serine/threonine kinase 25 (yeast) | 1 | 58 | Protein amino-acid phosphorylation | |
| NM_019414 | Selenbp2 | Selenium binding protein 2 | 3 | 50.8 | ||
| X71479 | Cyp4a12 | Cytochrome P450, family 4 | 4 | 49.5 | Electron transport | |
| NM_018853 | Rplp1 | Ribosomal protein, large, P1 | 8 | 72.4 | Protein biosynthesis; translational elongation | |
| NM_008843 | Pip | Prolactin-induced protein | 6 | 88 | ||
| NM_009578 | Znfn1a1 | Zinc finger protein (Ikaros) | 11 | 6 | Regulation of transcription, DNA-dependent | |
| NM_020564 | pending | Sulphotransferase-related gene X1 | 8 | |||
| NM_008496 | Lgals7 | Lectin, galactose binding, soluble 7 | 7 | 74.5 | ||
| AB041997 | Ptges | Prostaglandin E synthase | 2 | 24 | Prostaglandin metabolism | |
| NM_013797 | Slc21a1 | Solute carrier family 21 | 6 | 88 | Transport; ion transport; transport |
Figure 2.

Scatter plots illustrating gene expression differences between A/J and C57BL/6 mice. From each strain, groups of mice (n = 5) were killed at days 0, 4, 7, 10 and 17 and liver tissue was snap frozen in liquid nitrogen. Total RNA from liver was extracted and pools of RNA consisting of five individuals/time point/strain were reverse transcribed and labelled with either Cy3 or Cy5 dyes. Differentially labelled cDNAs from each strain were hybridized onto 7000 gene oligo arrays in three replicates/time point. Hybridization signal were analysed using MaxD microarray analysis software. (a) Scatter plot of A/J vs C57BL/6 ratios on days 0 and 4 with every dot representing an individual gene. Among others, genes labelled Apcs, Pbp and abhydrolase domain containing 1 (Abhd1) were higher expressed in A/J mice (ratio >0) as compared to C57BL/6 mice. Vice versa, as examples of genes that were higher expressed in C57BL/6 mice (ratio <0) nicotinamide N-methyltransferase (Nnmt), major urinary protein 4 (Mup4), haemolytic complement (Hc) and Bcl2-interacting killer-like (Biklk) genes are labelled. (b) Scatter plot of A/J vs B57BL/6 ratios on days 4 and 7. Genes such as cytochrome P450, family member 4 (Cyp4a14), carbonic anhydrase (Car3) and catalytic glucose-6-phosphatase (G6pc) are upregulated in A/J, genes labelled adipose differentiation related protein (Adfp), presenilin 2 (Psen2), structural p-lysozyme (Lzp-s) and steaoryl-coenzyme A desaturase 1 (Scd1) are upregulated in C57BL/6 mice. (c) Scatter plot of A/J vs C57BL/6 ratios on days 7 and 10. More higher expressed genes were (among others) interferon alpha/beta receptor 1 (Ifnar1), chemokine (C-X-C motif) ligand 13 (Cxcl 13), chemokine (C-C motif) ligands 8 and 6 in A/J and chemokine (C-X-C motif) ligand 9, interferon-activated gene 203 (Ifi203) and bone marrow stromal cell antigen 1 (Bst1) in C57BL/6. (d) Scatter plot of A/J vs C57BL/6 ratios on days 10 and 17. Serum amyloid A 2 (Saa2), Apo A4, K inward rectifying channel family J 10 (Kcnj10), chemokine (C-C motif) ligand 24 and orosomucoid 1 (Orm1) appeared higher expressed in the A/J, whereas selen binding protein 2(Selenbp2), serin/threonin kinase 25 (Stk25) and glutathione S-transferase alpha 2 (Gsta2) were higher expressed in the C57Bl/6 strain.
Day 7
The 48 genes recorded in Table 3 represent the smallest number of differentially expressed genes between the two strains at any of the time points investigated. Whereas mice of the susceptible strain continued to overexpress genes of metabolism-related pathways (◇), they also overexpressed the interferon alpha/beta receptor (Ifnar1) and the C1q complement receptor gene (both marked with ∞) when compared to C57BL/6 mice. Among the newly upregulated genes was apolipoprotein A4 (Apo A4) gene. Real-time PCR confirmed the upregulation of this gene on days 7, 10 and 17 with an average of 11.85-fold higher expression in A/J than C57BL/6 (range 4.85-21.00, n = 6/strain).
Table 3.
Genes that were ≥two-fold upregulated in A/J (top part) and C57BL/6 (bottom part) at day 7
| Gene Id | Symbol | Gene name | MMU | cM | Biological process | |
|---|---|---|---|---|---|---|
| NM_010508 | Ifnar1 | Interferon (alpha/beta) receptor 2 | 16 | 63.2 | ||
| NM_007574 | C1qg | Complement component 1 q receptor 1 | 4 | 66.1 | Complement activation; classical pathway | |
| NM_007468 | ◇ | Apoa4 | Apolipoprotein A-IV | 9 | 27 | Lipid transport; reg of cholesterol absorption |
| X15684 | ◇ | Slc2a2 | Solute carrier family 2 | 3 | 14.4 | Transport; carbohydrate transport |
| AF312938 | ◇ | Atf5 | Activating transcription factor 5 | 7 | 74.5 | Regulation of cell proliferation; antiapoptosis |
| NM_010699 | ◇ | Ldh1 | Lactate dehydrogenase 1, A chain | 7 | 23.5 | Glycolysis |
| AB018421 | ◇ | Cyp4a10 | Cytochrome P450, family 4 | 4 | 49.5 | |
| NM_016772 | ◇ | Ech1 | Enoyl coenzyme A hydratase 1 | 7 | 74.5 | Metabolism; fatty acid metabolism |
| NM_008218 | ◇ | Hba-a1 | Haemoglobin alpha, adult chain 1 | 11 | Transport; oxygen transport | |
| U63146 | ◇ | Rbp4 | Retinol binding protein 4, plasma | 19 | 38 | Transport |
| U85511 | ◇ | Nme1 | Expressed in non-metastatic cells 1 | 11 | 77 | GTP; CTP; UTP biosynthesis |
| NM_008086 | ◇ | Gas1 | Growth arrest specific 1 | 13 | 37 | Cell cycle arrest |
| NM_008490 | ◇ | Lcat | Lecithin cholest acyltransferase | 8 | 53 | Lipid metabolism |
| NM_007822 | Cyp4a14 | Cytochrome P450, family 4 | 4 | 49.5 | Electron transport | |
| NM_018858 | Pbp | Phosphatidylethanolamine bindg prot | 5 | 63 | ||
| NM_011318 | Apcs | Serum amyloid P-component | 1 | 94.2 | ||
| NM_010991 | Olfr49 | Olfactory receptor 49 | 14 | 75 | G-protein signalling pathway; olfaction | |
| NM_009286 | Sth2 | Sulphotransferase, hydroxysteroid 2 | Steroid metabolism | |||
| NM_007606 | Car3 | Carbonic anhydrase 3 | 3 | 11.7 | One-carbon compound metabolism | |
| NM_021304 | Abhd1 | Abhydrolase domain containing 1 | 5 | 83 | Biological process unknown | |
| NM_007846 | Defcrs12 | Defensin-related sequence 7 | ||||
| AJ401619 | 2610037M15Rik | RIKEN cDNA 2610037M15 gene | 6 | 88 | ||
| NM_021564 | Fetub | Fetuin beta | 16 | 63 | ||
| NM_011546 | 1 | |||||
| NM_008210 | H3f3a | H3 histone, family 3A | 13 | 60 | ||
| NM_008328 | Ifi203 | Interferon-activated gene 203 | 1 | 95.2 | Immune response | |
| NM_009916 | § | Ccr4 | Chemokine (C-C motif) receptor 4 | 9 | 61 | Chemotaxis; inflammatory response |
| AF228706 | § | Nfat5 | Nuclear factor-activated T-cells 5 | 8 | 53 | Regulation of transcription, DNA-dependent |
| U79525 | § | Cmklr1 | Chemokine-like receptor 1 | 5 | 83 | Chemotaxis; G-protein signalling pathway |
| NM_008955 | § | Psx1 | Placenta specific homeobox 1 | X | 55 | Regulation of transcription, DNA-dependent |
| NM_018831 | § | Dclre1a | DNA cross-link repair 1A, homologue | 19 | 56 | Nucleotide-excision repair |
| NM_011183 | § | Psen2 | Presenilin 2 | 1 | Intracellular signalling cascade | |
| M27608 | Mup1 | Major urinary protein 1 | Transport; immediate hypersensitivity response | |||
| NM_010924 | Nnmt | Nicotinamide N-methyltransferase | 9 | 29 | ||
| NM_008648 | Mup4 | Major urinary protein 4 | 4 | 27.8 | Transport | |
| NM_010406 | Hc | Haemolytic complement | 2 | 23.5 | Cytolysis; inflamm respon; complement activation | |
| AF221095 | Ndst3 | N-deacetylase/N-sulphotransferase | 3 | 110 | ||
| NM_013590 | Lzp-s | P lysozyme structural | Carbohydrate metabolism; cell wall catabolism | |||
| NM_011979 | Vnn3 | Vanin 3 | 10 | 72 | Nitrogen metabolism | |
| AF011413 | V2r3 | Vomeronasal 2, receptor, 3 | ||||
| NM_009688 | Birc4 | Baculoviral IAP repeat-containing 4 | X | 55 | Apoptosis; antiapoptosis | |
| NM_021537 | Stk25 | Serine/threonine kinase 25 (yeast) | 1 | 58 | Protein amino-acid phosphorylation | |
| NM_019518 | Grasp | GRP1-associated scaffold protein | 15 | 64 | Intracell signal cascade; intracell prot transport | |
| NM_009127 | Scd1 | Stearoyl-coenzyme A desaturase 1 | 19 | 43 | Fatty acid biosynthesis | |
| L11333 | Es31 | Esterase 31 | 8 | |||
| NM_019414 | Selenbp2 | Selenium binding protein 2 | 3 | 50.8 | ||
| NM_007819 | Cyp3a13 | Cytochrome P450, family 3 | 5 | 83 | Electron transport | |
| NM_016978 | Oat | Ornithine aminotransferase | 7 | 63 | Amino-acid metabolism |
On day 7, in comparison to A/J, C57BL/6 showed increased expression of genes associated with signal transduction and transcriptional regulation (marked with §) such as nuclear factor of activated T cells (NFAT5) and presenilin 2 (Psen2). Chemotaxis and inflammatory response genes (marked with ∞) were also higher expressed in C57BL/6 mice. The scatter plot in Figure 2b illustrates the changes in differential gene expression occurring between day 4 and 7.
Day 10
Sixty-eight genes were more than two-fold differentially expressed between the susceptible A/J and the resistant C57BL/6 strain (Table 4). Compared to previous time points, at this stage, when parasitaemia was not significantly different between the two groups, both strains appear to have activated a number of genes of the acute phase and inflammatory response. Genes that were more highly expressed in A/J included serum amyloid A2 (Saa2), which was confirmed by real-time PCR (average difference 4.133-fold, range 2.38-5.88, n = 4/strain), and Cxcl13, Ccl6 and Ccl27 (∞). In contrast to A/J mice which mainly overexpressed chemokine genes, only two out of six C57BL/6-specific host-defence genes (∞) belonged to the chemokine family. One of these genes was Cxcl9. Real-time PCR of Cxcl9 showed a 3.09-fold (range 2.18-4.35, n = 10/strain) difference between the two strains at all time points. This was an interesting finding, as the microarray data suggested a significant upregulation only at day 10 post infection. Further, the trypanotolerant strain overexpressed several genes coding for proteases (∴), including matrix metalloproteinase 13 as compared to the susceptible strain. C57BL/6 also continued to maintain a high metabolic activity (◇). Changes in differential gene expression between days 7 and 10 are shown as a scatter plot in Figure 2c.
Table 4.
Genes that were ≥two-fold upregulated in A/J (top part) and C57BL/6 (bottom part) at day 10
| Gene Id | Symbol | Gene name | MMU | cM | Biological process | |
|---|---|---|---|---|---|---|
| NM_018866 | ∞ | Cxcl13 | Chemokine (C-X-C motif) ligand 13 | 5 | 83 | Chemotaxis; inflammatory response; immune response |
| NM_021443 | ∞ | Ccl8 | Chemokine (C-C motif) ligand 8 | 11 | 47 | Signal transduction; chemotaxis; inflamm; immune response |
| NM_011314 | ∞ | Saa2 | Serum amyloid A 2 | 7 | 23.5 | Acute-phase response |
| NM_011336 | ∞ | Ccl27 | Chemokine (C-C motif) ligand 27 | Immune response | ||
| NM_009139 | ∞ | Ccl6 | Chemokine (C-C motif) ligand 6 | 11 | 47.51 | Signal transduction; chemotaxis; immune response |
| NM_010508 | Ifnar1 | Interferon (alpha/beta) receptor 2 | 16 | 63.2 | ||
| NM_007468 | Apoa4 | Apolipoprotein A-IV | 9 | 27 | Lipid transport; regulation of cholesterol absorption | |
| NM_011318 | Apcs | Serum amyloid P-component | 1 | 94.2 | ||
| NM_007598 | Cap1 | Adenylyl cyclase-assoc CAP prot homologue | 4 | 82.5 | Cellular morphogenesis | |
| NM_018858 | Pbp | Phosphatidylethanolamine binding prot | 5 | 63 | ||
| NM_009221 | Snca | Synuclein, alpha | 6 | 29 | ||
| X62705 | 1 | |||||
| NM_011414 | Slpi | Secretory leucocyte protease inhibitor | 2 | 106.6 | ||
| NM_008509 | Lpl | Lipoprotein lipase | 8 | 33 | Lipid metabolism; lipid transport; lipid catabolism | |
| NM_019659 | Kcnj1 | K inwardly-rectifying channel, subf J | 9 | 78.8 | Ion transport; potassium ion transport | |
| AJ007909 | 1 | |||||
| NM_021304 | Abhd1 | Abhydrolase domain containing 1 | 5 | 83 | Biological_process unknown | |
| NM_009997 | ◇ | Cyp2a4 | Cytochrome P450, family 2, subfamily a | Electron transport | ||
| NM_013806 | ◇ | Abcc2 | ATP-binding cassette, sub-family C | 19 | 43 | Transport |
| NM_007482 | ◇ | Arg1 | Arginase 1, liver | 10 | 72 | Urea cycle; arginine metabolism; arginine catabolism |
| NM_011433 | ◇ | Soat2 | Sterol O-acyltransferase 2 | 15 | 61.7 | Protein amino-acid prenylation; cholesterol metabolism |
| NM_008030 | ◇ | Fmo3 | Flavin containing monooxygenase 3 | Electron transport | ||
| NM_007494 | ◇ | Ass1 | Argininosuccinate synthetase 1 | 2 | Urea cycle; arginine biosynthesis | |
| NM_008777 | ◇ | Pah | Phenylalanine hydroxylase | 10 | 47 | Metabolism; phenylalanine catabolism |
| NM_007409 | ◇ | Adh1 | Alcohol dehydrogenase 1 | 3 | 71.2 | Retinoid metabolism |
| NM_008761 | ◇ | Fxyd5 | FXYD domain-cont ion transport regul 7 | 7 | 74.5 | Ion transport |
| NM_019552 | ◇ | Abcb10 | ATP-binding cassette, sub-family B | 8 | 72.4 | Transport |
| M62766 | ◇ | Hmgcr | 3-hydroxy-3-methylglutaryl-Co A synth 2 | 13 | 49 | Biosynthesis; cholesterol biosynthesis |
| NM_015760 | ◇ | Nox4 | NADPH oxidase 4 | 7 | 74.5 | Electron transport; bone resorption; superoxide release |
| NM_007448 | ◇ | Angl | Angiogenin-like | Angiogenesis | ||
| NM_013593 | ◇ | Mb | Myoglobin | 15 | 43.3 | Transport; oxygen transport |
| AF187099 | Cml5 | Camello-like 5 | 6 | 88 | Negative regulation of cell adhesion | |
| NM_009763 | Bst1 | Bone marrow stromal cell antigen 1 | 5 | 25 | Defense response | |
| NM_008328 | Ifi203 | Interferon activated gene 203 | 1 | 95.2 | Immune response | |
| NM_013653 | Ccl5 | Chemokine (C-C motif) ligand 5 | 11 | 47.4 | Signal transduction; chemotaxis; inflamm; immune response | |
| NM_009735 | B2m | Beta-2 microglobulin | 2 | 69 | Defense response; endogenous antigen via MHC class I | |
| NM_008599 | Cxcl9 | Chemokine (C-X-C motif) ligand 9 | 5 | 53 | Inflammatory response; immune response | |
| NM_021489 | ∴ | F12 | Coagulation factor XII (Hageman factor) | 13 | 60 | Proteolysis and peptidolysis |
| NM_009258 | ∴ | Spink3 | Serine protease inhibitor, Kazal type 4 | 18 | 56 | |
| NM_008941 | ∴ | Prss7 | Protease, serine, 7 (enterokinase) | 16 | 63 | Proteolysis and peptidolysis |
| NM_008607 | ∴ | Mmp13 | Matrix metalloproteinase 13 | 9 | 78.8 | Proteolysis and peptidolysis; collagen catabolism |
| M27608 | Mup1 | Major urinary protein 1 | Transport; immediate hypersensitivity response | |||
| NM_009688 | Birc4 | Baculoviral IAP repeat-containing 4 | X | 55 | Apoptosis; antiapoptosis | |
| NM_008182 | Gsta2 | Glutathione S-transferase, alpha 2 | 9 | 44 | ||
| NM_010406 | Hc | Haemolytic complement | 2 | 23.5 | Cytolysis; inflammatory response; complement activation | |
| NM_007819 | Cyp3a13 | Cytochrome P450, family 3, subfamily a | 5 | 83 | Electron transport | |
| NM_010924 | Nnmt | Nicotinamide N-methyltransferase | 9 | 29 | ||
| NM_016978 | Oat | Ornithine aminotransferase | 7 | 63 | Amino-acid metabolism | |
| NM_015729 | Acox1 | Acyl-coenzyme A oxidase 1, palmitoyl | 11 | 77 | Electron transport; fatty acid metabolism; spermatogenesis | |
| NM_018853 | Rplp1 | Ribosomal protein, large, P1 | 8 | 72.4 | Protein biosynthesis; translational elongation; | |
| L11333 | Es31 | Esterase 31 | 8 | |||
| NM_011183 | Psen2 | Presenilin 2 | 1 | Intracellular signalling cascade | ||
| NM_012058 | Srp9 | Signal recognition particle 9 | ||||
| NM_019414 | Selenbp2 | Selenium binding protein 2 | 3 | 50.8 | ||
| AF221095 | Ndst3 | N-deacetylase/N-sulphotransferase | 3 | 110 | ||
| NM_008648 | Mup4 | Major urinary protein 4 | 4 | 27.8 | Transport | |
| NM_009581 | Zp3r | Zona pellucida 3 receptor | 1 | 67 | Fertilization; binding of sperm to zona pellucida | |
| NM_021537 | Stk25 | Serine/threonine kinase 25 (yeast) | 1 | 58 | Protein amino-acid phosphorylation | |
| U27014 | Sdh1 | Sorbitol dehydrogenase 1 | 2 | 66 | ||
| NM_007546 | Biklk | Bcl2-interacting killer-like | 15 | 64 | ||
| NM_009349 | Temt | Thioether S-methyltransferase | 6 | 88 | ||
| NM_010401 | Hal | Histidine ammonia lyase | 10 | 51 | Biosynthesis; histidine metabolism; histidine catabolism | |
| NM_009203 | Slc22al2 | Solute carrier family 22-like 2 | 19 | 56 | Transport | |
| NM_009578 | Znfn1a1 | Zinc finger protein (Ikaros) | 11 | 6 | Regulation of transcription, DNA-dependent | |
| NM_011393 | Slc1a2 | Solute carrier family 1, member 2 | 2 | 54 | Transport; dicarboxylic acid transport | |
| NM_021273 | Ckb | Creatine kinase, brain | 16 | 55 | ||
| NM_019639 | ||||||
| U24680 |
Day 17
At this stage, when we observed a massive recurrence of trypanosomes in the blood of A/J mice, we found the highest number (91) of differentially expressed genes (Table 5). Most genes are more highly expressed in the susceptible A/J strain. Of the 70 such differentially expressed genes, a large number of them are chemokine genes, with a total of 17 immune response genes (∞), 13 metabolism-related genes (◇), and another three genes involved in proteolytic processes (∴). A/J mice also showed higher expression levels of potassium channel genes (‡) compared to C57BL/6. Twentyone genes were more highly expressed in C57BL/6 compared to A/J, and most of these genes had been differentially expressed in the uninfected mice. The scatter plot displayed in Figure 2d illustrates a shift to higher gene expression levels in the A/J strain. In the real-time PCR, macrophage receptor/collagenous structure (Marco) and complement component 3 (C3) were 3.48- to 5.44-fold and 4.25- to 6.20-fold more highly expressed in A/J compared to C57BL/6 at this time point.
Table 5.
Genes that were ≥two-fold upregulated in A/J (top part) and C57BL/6 (bottom part, next page) at day 17
| Gene Id | Symbol | Gene name | MMU | cM | Biological process | |
|---|---|---|---|---|---|---|
| X14607 | ◇ | Lcn2 | Lipocalin 2 | 2 | 27 | Transport |
| Z71189 | ◇ | Acadvl | Acyl-Co A dehydrogenase, very long chain | 11 | 38 | Electron transport; fatty acid metabolism |
| X03766 | ◇ | Acta1 | Actin, alpha 1, skeletal muscle | Muscle contraction; cytoskeleton org and biogenesis | ||
| NM_009171 | ◇ | Shmt1 | Serine hydroxymethyl transferase 1 | 11 | 77 | One-carbon compound; amino-acid metabolism |
| L02331 | ◇ | Sult1a1 | Sulphotransferase family 1A | 7 | 4 | Steroid metabolism |
| NM_011868 | ◇ | Peci | Peroxisomal Δ3, Δ2-enoyl-CoA isomerase | 13 | 60 | Metabolism; peroxisome organization and biogenesis |
| NM_010763 | ◇ | Man1b | Mannosidase 1, beta | 3 | 110 | Carbohydrate metabolism; N-linked glycosylation |
| AF218416 | ◇ | Ttpa | Tocopherol (alpha) transfer protein | 4 | 82.5 | Transport; embryo implantation; vitamin E metabolism |
| NM_019573 | ◇ | Wwox | WW domain-containing oxidoreductase | 8 | 72.4 | Metabolism; induction of apoptosis |
| NM_011044 | ◇ | Pck1 | Phosphoenolpyruvate carboxykinase 1 | 2 | 103 | Gluconeogenesis |
| NM_018829 | ◇ | Ap3m1 | Adaptor-related protein complex 3 | 14 | 2.5 | Intracell protein transport; protein-lysosome targeting |
| NM_009286 | ◇ | Sth2 | Sulphotransferase, hydroxysteroid pref 2 | Steroid metabolism | ||
| NM_008489 | ◇ | Lbp | Lipopolysaccharide binding protein | 2 | 83 | Xenobiotic metabolism; lipid transport |
| NM_008768 | ◇∞ | Orm1 | Orosomucoid 1 | 4 | 31.4 | Transport; acute-phase response |
| U89889 | ◇∞ | Hpxn | Hemopexin | 7 | 74.5 | Transport; acute-phase response |
| NM_019577 | ∞ | Ccl24 | Chemokine (C-C motif) ligand 24 | 5 | 83 | Chemotaxis; inflammatory response; immune response |
| NM_018866 | ∞ | Cxcl13 | Chemokine (C-X-C motif) ligand 13 | 5 | 83 | Chemotaxis; inflammatory response; immune response |
| NM_010392 | ∞ | H2-Q2 | Histocompatibility 2, Q region locus 8 | -1 | Defense response | |
| NM_011338 | ∞ | Ccl9 | Chemokine (C-C motif) ligand 9 | 11 | 47.4 | Signal transduction; chemotaxis; immune response |
| NM_007827 | ∞ | Daf2 | Decay accelerating factor 2 | 1 | 67.6 | Complement activation, classical pathway |
| NM_011316 | ∞ | Saa4 | Serum amyloid A 4 | 7 | 23.5 | Acute-phase response |
| NM_021443 | ∞ | Ccl8 | Chemokine (C-C motif) ligand 8 | 11 | 47 | Signal transduc; chemotaxis; inflamm; immune response |
| NM_010740 | ∞ | C1qr1 | Complement component 1 q receptor 1 | 2 | 84 | Cell adhesion; defense response |
| NM_007643 | ∞ | Cd36 | CD36 antigen | 5 | 2 | Cell adhesion; transport |
| NM_011579 | ∞ | Tgtp | T-cell-specific GTPase | 11 | 77 | |
| NM_010766 | ∞ | Marco | Macrophage receptor/collagenous struct | |||
| NM_009921 | ∞ | Camp | Cathelicidin antimicrobial peptide | 9 | 61 | Xenobiotic metabolism; defense response |
| M83218 | ∞ | S100a8 | S100 calcium binding protein A8 | 3 | 43.6 | Chemotaxis |
| NM_019948 | ∞ | Clecsf9 | C-type lectin, superfamily member 9 | 6 | 59.6 | |
| K02782 | ∞ | C3 | Complement component 3 | 17 | 34.3 | Inflammatory response; complement activation |
| NM_017370 | ∞∴ | Hp | Haptoglobin | 8 | 55 | Acute-phase response; proteolysis and peptidolysis |
| NM_010517 | ∞& | Igfbp4 | Insulin-like growth factor bindg prot | 11 | 77 | Regulation of cell growth |
| NM_008176 | ∞& | Cxcl1 | Chemokine (C-X-C motif) ligand 1 | 5 | 51 | Cell growth/maintenance; inflamm; immune response |
| NM_009984 | ∴ | Ctsl | Cathepsin L | 13 | 30 | Proteolysis and peptidolysis |
| NM_021445 | ∴ | Cts6 | Cathepsin 6 | 13 | 35.5 | Proteolysis and peptidolysis |
| NM_019447 | ∴ | Hgfac | Hepatocyte growth factor activator | 5 | 83 | Proteolysis and peptidolysis |
| NM_020269 | ‡ | Kcnj10 | K inwardly-rectifying channel, subfam J | 1 | 93.5 | Ion transport; potassium ion transport |
| AF020711 | ‡ | Kcnmb1 | K large conductance Ca-activ channel | 11 | 77 | Potassium ion transport |
| NM_019659 | ‡ | Kcnj1 | K inwardly-rectifying channel, subfam J | 9 | 78.8 | Ion transport; potassium ion transport |
| NM_007502 | ‡ | Atp1b3 | ATPase, Na+/K+ trans, beta 3 polypeptide | 9 | 51 | Potassium ion transport; sodium ion transport |
| NM_010656 | & | Sspn | Sarcospan | 6 | 71.55 | Cell growth/maintenance; regulation of cell cycle |
| NM_011318 | Apcs | Serum amyloid P-component | 1 | 94.2 | ||
| NM_010508 | Ifnar1 | Interferon (alpha and beta) receptor 2 | 16 | 63.2 | ||
| NM_007598 | Cap1 | Adenylyl cyclase-assoc CAP prot homologue | 4 | 82.5 | Cellular morphogenesis | |
| NM_021304 | Abhd1 | Abhydrolase domain containing 1 | 5 | 83 | Biological_process unknown | |
| NM_011314 | Saa2 | Serum amyloid A 2 | 7 | 23.5 | Acute-phase response | |
| NM_011336 | Ccl27 | Chemokine (C-C motif) ligand 27 | Immune response | |||
| NM_007846 | Defcrs12 | Defensin-related sequence 7 | ||||
| NM_018858 | Pbp | Phosphatidylethanolamine binding protein | 5 | 63 | ||
| NM_007752 | Cp | Ceruloplasmin | 3 | 55 | ||
| NM_009221 | Snca | Synuclein, alpha | 6 | 29 | ||
| AB018421 | Cyp4a10 | Cytochrome P450, family 4 | 4 | 49.5 | ||
| NM_010442 | Hmox1 | Heme oxygenase (decycling) 1 | 8 | 35 | Heme oxidation | |
| NM_007822 | Cyp4a14 | Cytochrome P450, family 4 | 4 | 49.5 | Electron transport | |
| NM_018777 | Cldn6 | Claudin 6 | 17 | 71.3 | ||
| AF290877 | Wasf1 | WASP family 1 | 10 | 25 | Cell motility; protein complex assembly; cell morphogen | |
| NM_021398 | pending | Embryonic epithelial gene 1 | 2 | 106.6 | ||
| NM_016974 | Dbp | D site albumin promoter binding protein | 7 | 23 | Circadian rhythm; regulation of transcription | |
| NM_010091 | Dvl1 | Dishevelled, dsh homolog 1 (Drosophila) | 4 | 82 | Development; Wnt receptor signalling pathway | |
| NM_011620 | Tnnt3 | Troponin T3, skeletal, fast | 7 | 69 | Regulation of muscle contraction; muscle development | |
| NM_007468 | Apoa4 | Apolipoprotein A-IV | 9 | 27 | Lipid transport; regulation of cholesterol absorption | |
| NM_015779 | ||||||
| NM_009376 | TgN737Rpw | Transgene inser737,polycystic kidney dis | 14 | 21 | Ant/post pattern formation; digit morphogenesis | |
| NM_009747 | Bdkrb2 | Bradykinin receptor, beta 2 | 12 | 53 | G-protein coupled receptor protein signalling pathway | |
| NM_013933 | Vapa | Vesicle-associated membrane protein | 17 | 71.3 | Biological_process unknown; cell motility | |
| NM_019744 | Ncoa4 | Nuclear receptor coactivator 4 | 14 | 75 | Biological_process unknown | |
| NM_009114 | S100a9 | S100 calcium binding protein A9 | 3 | 43.6 | ||
| NM_009175 | Siat1 | Sialyltransferase 1 | 16 | 15.5 | Protein amino-acid glycosylation | |
| NM_007411 | Adk | Adenosine kinase | 14 | 75 | Purine salvage | |
| NM_013532 | Gp49b | Glycoprotein 49 B | 10 | 32 | ||
| M27608 | Mup1 | Major urinary protein 1 | Transport; immediate hypersensitivity response | |||
| NM_009688 | Birc4 | Baculoviral IAP repeat-containing 4 | X | 55 | Apoptosis; antiapoptosis | |
| NM_008648 | Mup4 | Major urinary protein 4 | 4 | 27.8 | Transport | |
| NM_010406 | Hc | Haemolytic complement | 2 | 23.5 | Cytolysis; inflammatory response; complement activation | |
| NM_011183 | Psen2 | Presenilin 2 | Intracellular signalling cascade | |||
| D00232 | ||||||
| L11333 | Es31 | Esterase 31 | 8 | |||
| NM_011341 | Sdf4 | Stromal cell-derived factor 4 | 4 | 82.5 | ||
| NM_007546 | Biklk | Bcl2-interacting killer-like | 15 | 64 | ||
| NM_021537 | Stk25 | Serine/threonine kinase 25 (yeast) | 1 | 58 | Protein phosphorylation | |
| NM_013653 | Ccl5 | Chemokine (C-C motif) ligand 5 | 11 | 47.4 | Signal transduc; chemotaxis; inflamm; immune response | |
| AF221095 | Ndst3 | N-deacetylase/N-sulphotransferase | 3 | 110 | ||
| AF246218 | Shkbp1 | Sh3kbp1 binding protein 1 | 7 | 74.5 | Biological_process unknown | |
| NM_010924 | Nnmt | Nicotinamide N-methyltransferase | 9 | 29 | ||
| NM_007606 | Car3 | Carbonic anhydrase 3 | 3 | 11.7 | One-carbon compound metabolism | |
| NM_008182 | Gsta2 | Glutathione S-transferase, alpha 2 (Yc2) | 9 | 44 | ||
| NM_019414 | Selenbp2 | Selenium binding protein 2 | 3 | 50.8 | ||
| AJ290944 | Usmg2 | Upreg during skeletal muscle growth | ||||
| M83538 | ||||||
| AF022856 | Nrp2 | Neuropilin 2 | Cell adhesion | |||
| NM_007925 | Eln | Elastin | 5 | 75 |
The hierarchical cluster in Figure 3 illustrates very distinct time-specific differential expression patterns, with clear clusters of higher expression in A/J (red) at days 7, 10 and 17. Time-specific clusters were less pronounced for genes that were more highly expressed in C57BL/6 mice (green). Overall, we observed 35 genes with a strong strain association (Figure 4). Among the 20 genes more highly expressed in C57BL/6 mice were major urinary proteins 1 and 4 (Mup1, Mup4), haemolytic component (Hc) and Bcl2-interacting killer-like (Biklk). The expression of another 15 genes appeared generally higher in the susceptible phenotype of A/J mice. These include genes coding for Pbp, Apo A4 and serum amyloid P component (Apcs) among others.
Figure 3.
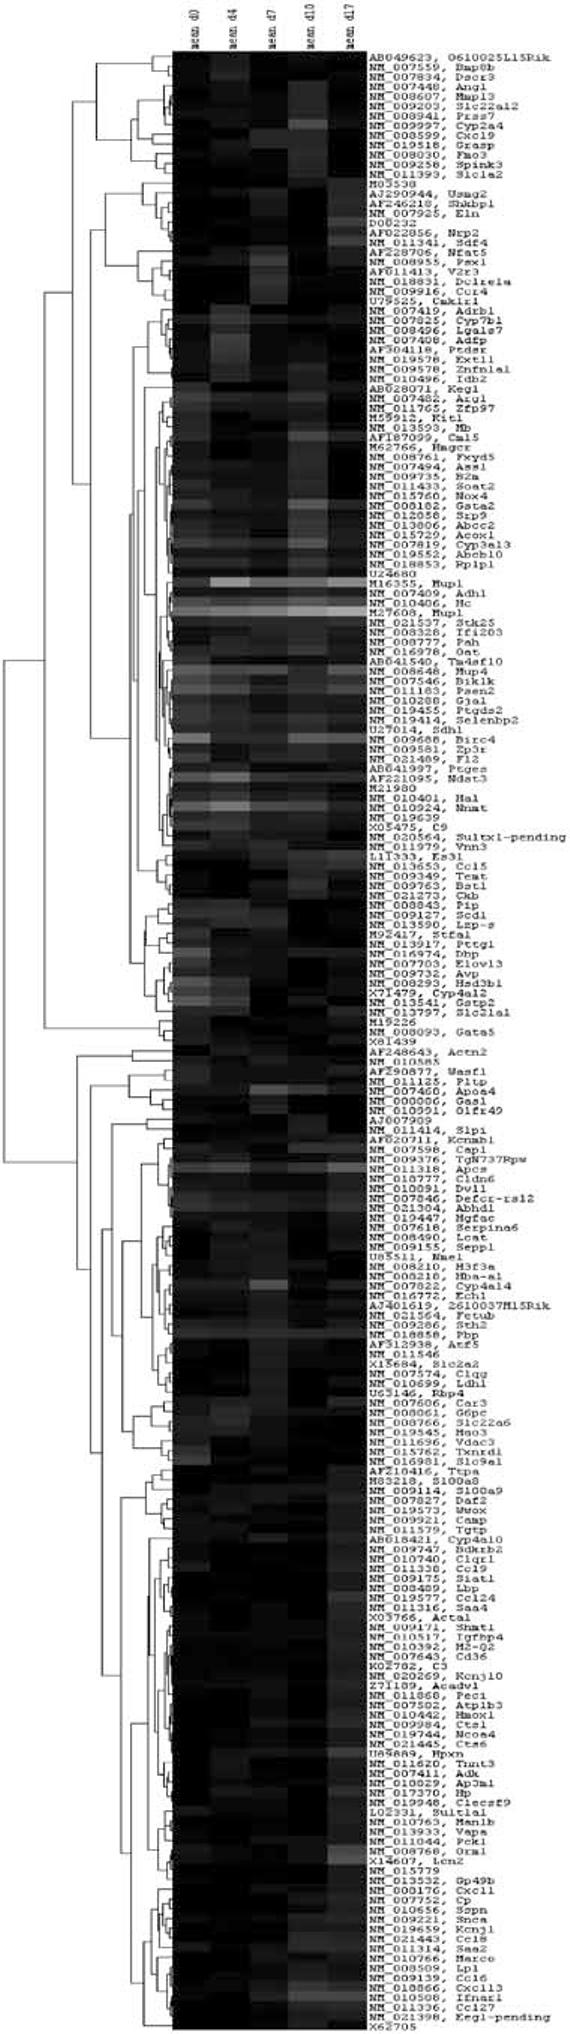
Hierarchical cluster of mean gene expression levels. Single-linkage hierarchical cluster analysis of the genes upregulated in A/J (red) or C57BL/6 mice (green) over each of the time points was performed using the MaxD software.
Figure 4.

Cluster analysis revealing strain-specific expression patterns. Single-linkage hierarchical cluster analysis of the genes upregulated in A/J (red) or C57BL/6 mice (green) over each of the time points was performed using the MaxD software.
Pathways associated with trypanotolerance
We carried out pathway analyses to put the differentially expressed genes into a functional context that would provide information on which mechanisms might be important in controlling resistance to the infection with T. congolense. Statistically significant (P<0.0001) association with the trypanotolerant C57BL/6 strain was seen in the pathways for bile acid and cholesterol synthesis with an upregulation of genes coding for alcohol dehydrogenase 1a (Adh1a), acyl-CoA oxidase 1 (Acox1), aldoketo reductase 1c1 (Akr1c1), 3beta-hydroxysteroid dehydrogenase (Hsd3b1), cytochrome P450 enzyme 7b1 (Cyp7b1), and acyl-CoA:cholesterol acyltransferase 2 (Soat2). Additionally, C57BL/6 mice also showed much more of the classical complement response genes C5, C5a and C9 as compared to A/J. Susceptibility in the A/J strain was associated with an upregulation relative to C57BL/6 of genes involved in acute-phase response and chemotaxis. Generally, the transcriptional response in A/J mice is much more extensive with an activation of a striking number of chemokine genes, including Ccl24, Ccl27, Ccl8, Ccl9, Cxcl1 and Cxcl13. Our pathway analysis did not reveal any significant linkage between susceptibility and a specific pathway.
Integrating QTL mapping and gene expression profiling
Based on the previously published fine mapping of QTL associated with survival after T. congolense infection (trypanosome infection response, Tir), we were able to identify three differentially expressed genes that are within 1 cM of one of the three QTLs. Complement component C3 with a chromosomal localization on MMU17 (34.3 cM) is located within the QTL region designated Tir1. C3 is one of the genes specifically upregulated in A/J mice during the recurrence of the infection (day 17). Its differential expression was also confirmed by real-time PCR that indicated an average fold difference of 5.22 (range 4.25-6.19, n = 2/strain). Serum amyloid P component (Apcs) is located on MMU1 at 94.2 cM, within the Tir 3c locus. The third gene, serine/threonine kinase 25 (Stk25) has been mapped to MMU1 (58 cM), which is in close proximity to the Tir 3a locus with its peak at 59 cM.
Discussion
The present study provides the foundation for a more integrative approach towards the understanding of trypanotolerance. In order to identify the most informative time points, we undertook a time course study where the main characteristics of T. congolense infection, parasitaemia and anaemia, were monitored in susceptible A/J and tolerant C57BL/6 mice for up to 18 days. Based on these data, we performed a microarray-based gene expression analysis comparing the two mouse strains at days 0 (not infected), 4 (pre-peak parasitaemia), 7 (peak parasitaemia), 10 (clearance) and 17 (recurrence) post infection. Our findings indicated that susceptibility is associated with higher expression of genes coding for chemokines, alternative complement components and interferon receptors during the recurrence of parasitaemia. Additionally, the expression of some potassium channel genes was higher in A/J mice at this stage. In contrast, the tolerant C57BL/6 strain overexpressed fewer genes, with a focus on the classical complement cascade and genes of the bile acid and cholesterol pathways.
A/J mice are known to have a functional null allele (Hc0) of the complement C5 component. The gene is expressed but the protein is not secreted.19,20 We observed a two-fold overexpression of this gene in C57BL/6 which have an intact copy of the gene, suggesting that the mutation in A/J caused by a two base pair deletion near the 5′-end of the gene may also lead to some non-sense-mediated decay. It is possible that the absence of a functional copy of this gene leads to knock-on effects elsewhere in the complement cascade such as the overexpression of C3 in A/J mice, which may be a consequence of a feedback control loop stimulating higher expression of C3 in the absence of C5.
Recent findings suggest that regulation of cholesterol metabolism in macrophages impacts antimicrobial response, cytokine secretion and phagocytosis.21-23 Many functions in immune cells are coordinated from lipid rafts in the plasma membrane. Although the contribution of cholesterol-dependent lipid assemblies to this complex is still controversial, it might be the link between the innate immune response and metabolic adjustments.24 Macrophages and Kupffer cells have previously been shown to be mainly responsible for the clearance of trypanosomes. These cells have a high capacity for cholesterol recycling and turnover and the upregulation of genes involved in this pathway might be the critical transcriptional adaptation required for trypanotolerance. Interestingly, two of the Tir QTLs, namely Tir2 and Tir3, are located in chromosomal regions where QTLs for cholesterol absorption and high-density lipoprotein levels are mapped.25-29 Although trypanotolerance was significantly associated with the activation of the classical complement cascade and cholesterol and bile acid pathways, no specific pathway seemed to be linked to susceptibility. Failure to control parasitaemia might be owing to the inadequate metabolic adaptation and an overactivation of the immune system rather than specific initiation. In this context, the immune response might be detrimental for the host but insufficient to clear the parasites.
Our initial kinetics study shows that the infection with T. congolense is following a similar course in both susceptible and tolerant strains. Although some studies indicate that the ability to control anaemia is an important factor in progression of the disease,30 we were unable to detect significant differences between the strains caused by trypanosome infection. One explanation might be that anaemia is usually becoming a critical factor in the late stage of the disease and our experiment did not cover these late time points. The choice of time points was somewhat difficult, as the physiological parameters measured at a given stage, can be regarded as the result of the gene expression, which might have occurred minutes, hours or days before. However, the number of differentially expressed genes at a given time point correlated well with the differences in disease status observed in the two strains. The number of differentially expressed genes was lowest at day 7, anticipating the clearance of parasites with no significant difference in parasitaemia between A/J and C57BL/6 at day 10. The most obvious strain differences in both transcriptional level and disease status were observed during the recurrence phase.
It is noteworthy that the gene expression differences seen in the microarray study were consistently confirmed by real-time PCR of selected genes. The RNA samples used in the real-time PCR were from different animals to those used in the microarray experiments. Thus, we were able to confirm not just that microarray assays were accurate but also that the differential expression was reproducible in two independent experiments.
Whether or not the differential expression of genes in uninfected animals is relevant to the outcome of the infection with T. congolense remains unknown at this stage. Some of these genes do not show differential expression levels at some stages post infection. Only nine of the differentially expressed genes in uninfected mice remained differentially expressed at all times post infection (Table 1).
This study was a first attempt to integrate transcriptional regulation and QTL mapping in a mouse model of trypanotolerance. Although, we identified three differentially expressed genes that map within 1 cM of one of the Tir loci, the possibility of this occurring by chance is relatively high. Additionally, the number of genes investigated by this microarray study was approximately 7000, which in turn restricted the number of genes that are located within QTL interval that are represented on the microarray. Nevertheless, our results indicate at least one pathway, namely complement activation, is related to differences in resistance.15,31 In the case of complement activation, complement component B is situated in close proximity to C3 (Tir1) but is not on the microarray. Our results also substantiate the findings of others, indicating that interferons13,32 and arginase12 are factors associated with susceptibility or resistance. However, the study by Duleu et al. suggested that macrophages of the susceptible strain express higher levels of arginase I and II, whereas we found that arginase I was more highly expressed in the tolerant C57BL/6 strain. This difference might be a time point-dependent effect or due to differences between in vivo and ex vivo analysis. Our data support the hypothesis that it is metabolic pathways and protease activity that should be explored as new anti-parasitic mechanisms.33 Most importantly, our study strongly suggests for the first time a possible role of chemokines and specific ion channels in the host response to trypansosome infection.
Materials and methods
Animals
All animals were housed in the animal facility of the International Livestock Research Institute (ILRI), Nairobi, Kenya. C57BL/6 and A/J mice were used at 5-8 weeks of age. Animals received food and water ad libitum. All experimental procedures were approved by the Institutional Animal Care and Use Committee (IACUC) at ILRI.
Murine model of African trypanosomiasis
T. congolense clone IL 118034 was grown in sub-lethally irradiated Sprague-Dawley rats, and trypanosomes were isolated from infected rat blood by anion exchange column.35 C57BL/6 and A/J mice were infected by intraperitoneal injection of 1 × 10⁴ parasites in 200 μl of phosphate-buffered saline (pH 8.0) containing 1.5% glucose. Naive animals from each strain were used as controls.
Monitoring the disease progress, parasitaemia and anaemia
The first experiment was designed to define the kinetics of the disease and to compare the main characteristics of parasitaemia and anaemia between A/J and C57BL/6 mice. Each mouse was monitored for parasitaemia and anaemia every second day by collecting 5 μl of blood from the tail. Additionally, one group of animals per strain (n = 6) was killed every second day until day 18 post infection and the liver was snap frozen in liquid nitrogen for subsequent RNA isolation. In the second experiment (microarray study), individuals were randomly checked for parasitaemia. Groups of mice (n = 6) were killed at 0, 4, 7, 10 and 17 days post infection, enabling us to group the animals according to five distinct phases of the disease as defined by the first experiment. The stages of disease were: stage 1=non-infected; stage 2=infected, low but increasing parasite counts; stage 3=peak parasitaemia (usually parasite counts ≥107); stage 4=clearance with low parasite counts after the peak; stage 5=recurrence, increasing parasite counts after first peak and first clearance. Again, the liver was snap frozen in liquid nitrogen for subsequent RNA extraction.
Assessment of parasitaemia and anaemia
To determine the animal parasite load, tail blood samples (3 μl) were collected and diluted 1:200 in Alsevers solution (3 mm citric acid, 114 mm dextrose, 72 mm sodium chloride and 27 mm sodium citrate). Parasitaemia, expressed as number of trypanosomes/ml, was evaluated manually by counting the number of parasites in the blood using a haemocytometer. Anaemia was defined indirectly by measuring the relative haemoglobin concentrations. Samples of 2 μl blood per animal were collected from the tail and diluted in 150 μl of distilled water in a 96-well round bottom plate (Costar 3799, Corning Inc., Corning, NY, USA) followed by a 30 min incubation at room temperature. Cell debris was pelleted by centrifugation at 600 g for 10 min. A total of 100 μl of the supernatant was transferred to a new plate and the optical density was measured at 540 nm in an enzyme-linked immunosorbent assay plate reader (Multiscan MCC/340, Titertrek Instruments, Huntsville, AL, USA). Sampling and measurements were carried out in triplicate from each mouse.
RNA isolation
Total RNA from liver was isolated using Trizol Reagent as described previously36
Microarray hybridization
Gene expression differences were assessed in two independent experiments. For the microarray experiment, a pool of liver RNA from groups of five animals per strain and time point was produced to reduce individual variability. Approximately, 60 μg of total RNA was reverse transcribed using oligo dT (T23) primer and MMLV II reverse transcriptase (Invitrogen, Paisley, UK). First-strand cDNA was purified using PCR purification columns (Qiagen, Crawley, UK) and eluted in 50 μl water. From each sample, 20 μl cDNA was labelled with either Cy3 or Cy5 dye (1 mm) and purified with ProbQuant G-50 microcolumns (Amersham, Little Chalfont, UK). For each hybridization, differently labelled cDNAs from both strains at a given time point were combined and hybridized to Compugen 7000 ‘known gene’ oligo arrays at 45°C overnight. Each hybridization (time point) was conducted in triplicate including one colour swap. Slides were washed in a series of 2 × SSC, 0.1 × SSC/0.1% SDS and 0.1 × SSC. Normalization and data analysis was performed using MaxD software (http://umber.sbs.man.ac.uk/microarray/maxd/).
Real-time PCR
Individual RNA samples obtained from an experiment other than the microarray study were used for real-time PCR of a small number of genes showing interesting differences in the microarray assays. Approximately 1 μg of total RNA was treated with DNaseI (Ambion, Huntington, UK) according to the manufacturer’s protocol. The reverse transcription reaction was performed with Stratascript Reverse Trascription kit using 200 ng random hexamer primers. Approximately, 100 ng cDNA was used in each PCR reaction with 6 pmol of the gene-specific forward and reverse primers in a total volume of 20 μl. Reactions were carried out in a Corbett RotorGene thermocycler (Corbett Life Sciences, Cambridge, UK) using Quantitect SYBRgreen PCR mix (Qiagen). PCR reactions were performed in triplicate per individual. Two individuals/strain/group were used and standardized against the beta-actin gene. We used the comparative quantitation (ΔΔCt) to express messenger RNA level differences at each time point between the two strains.
Data analysis
MaxD software was used for the analysis of the microarray data.37 Normalization was performed using standard methodologies.38 For other statistical analysis, we used Prism4 software (GraphPad Inc., San Diego, CA, USA), ANOVA with post tests using the Bonferroni method and test for linear trend. Student’s t-test was used for two-group comparisons. Data are expressed as mean±s.e.m. and P<0.05 was considered statistically significant.
Acknowledgements
We are grateful for the expert assistance of Dr Fuad Iraqi, Moses Ogugo, John Wambugu, Bob King and the staff of the ILRI animal facility. We thank Drs Helen Hilton and Peter Underhill from MRC Harwell for their assistance in performing the microarray study. This work was supported by grants from the Wellcome Trust and from Deutsche Forschungsgemeinschaft (DFG) KI-801.
References
- 1.Torr SJ, Hargrove JW, Vale GA. Towards a rational policy for dealing with tsetse. Trends Parasitol. 2005;21:537–541. doi: 10.1016/j.pt.2005.08.021. [DOI] [PubMed] [Google Scholar]
- 2.Mansfield JM, Paulnock DM. Regulation of innate and acquired immunity in African trypanosomiasis. Parasite Immunol. 2005;27:361–371. doi: 10.1111/j.1365-3024.2005.00791.x. [DOI] [PubMed] [Google Scholar]
- 3.Omamo SW, d’Ieteren GD. Managing animal trypanosomosis in Africa: issues and options. Rev Sci Tech. 2003;22:989–1002. doi: 10.20506/rst.22.3.1448. [DOI] [PubMed] [Google Scholar]
- 4.Nyame AK, Kawar ZS, Cummings RD. Antigenic glycans in parasitic infections: implications for vaccines and diagnostics. Arch Biochem Biophys. 2004;426:182–200. doi: 10.1016/j.abb.2004.04.004. [DOI] [PubMed] [Google Scholar]
- 5.Hill EW, O’Gorman GM, Agaba M, Gibson JP, Hanotte O, Kemp SJ, et al. Understanding bovine trypanosomiasis and trypanotolerance: the promise of functional genomics. Vet Immunol Immunopathol. 2005;105:247–258. doi: 10.1016/j.vetimm.2005.02.004. [DOI] [PubMed] [Google Scholar]
- 6.Maichomo MW, Ndungu JM, Ngare PM, Ole-Mapenay IM. The performance of Orma Boran and Maasai Zebu cross-breeds in a trypanosomosis endemic area of Nguruman, south western Kenya. Onderstepoort J Vet Res. 2005;72:87–93. doi: 10.4102/ojvr.v72i1.225. [DOI] [PubMed] [Google Scholar]
- 7.Williams DJ, Taylor K, Newson J, Gichuki B, Naessens J. The role of anti-variable surface glycoprotein antibody responses in bovine trypanotolerance. Parasite Immunol. 1996;18:209–218. doi: 10.1046/j.1365-3024.1996.d01-76.x. [DOI] [PubMed] [Google Scholar]
- 8.Clapcott SJ, Teale AJ, Kemp SJ. Evidence for genomic imprinting of the major QTL controlling susceptibility to trypanosomiasis in mice. Parasite Immunol. 2000;22:259–263. doi: 10.1046/j.1365-3024.2000.00308.x. [DOI] [PubMed] [Google Scholar]
- 9.Iraqi F, Clapcott SJ, Kumari P, Haley CS, Kemp SJ, Teale AJ. Fine mapping of trypanosomiasis resistance loci in murine advanced intercross lines. Mamm Genome. 2000;11:645–648. doi: 10.1007/s003350010133. [DOI] [PubMed] [Google Scholar]
- 10.Baetselier PD, Namangala B, Noel W, Brys L, Pays E, Beschin A. Alternative versus classical macrophage activation during experimental African trypanosomosis. Int J Parasitol. 2001;31:575–587. doi: 10.1016/s0020-7519(01)00170-9. [DOI] [PubMed] [Google Scholar]
- 11.Buza J, Sileghem M, Gwakisa P, Naessens J. CD5+ B lymphocytes are the main source of antibodies reactive with non-parasite antigens in Trypanosoma congolense-infected cattle. Immunology. 1997;92:226–233. doi: 10.1046/j.1365-2567.1997.00330.x. [DOI] [PMC free article] [PubMed] [Google Scholar]
- 12.Duleu S, Vincendeau P, Courtois P, Semballa S, Lagroye I, Daulouede S, et al. Mouse strain susceptibility to trypanosome infection: an arginase-dependent effect. J Immunol. 2004;172:6298–6303. doi: 10.4049/jimmunol.172.10.6298. [DOI] [PubMed] [Google Scholar]
- 13.Hertz CJ, Mansfield JM. IFN-gamma-dependent nitric oxide production is not linked to resistance in experimental African trypanosomiasis. Cell Immunol. 1999;192:24–32. doi: 10.1006/cimm.1998.1429. [DOI] [PubMed] [Google Scholar]
- 14.Nakamura Y, Naessens J, Takata M, Taniguchi T, Sekikawa K, Gibson J, et al. Susceptibility of heat shock protein 70.1-deficient C57BL/6 J, wild-type C57BL/6 J and A/J mice to Trypanosoma congolense infection. Parasitol Res. 2003;90:171–174. doi: 10.1007/s00436-003-0844-3. [DOI] [PubMed] [Google Scholar]
- 15.Otesile EB, Lee M, Tabel H. Plasma levels of proteins of the alternative complement pathway in inbred mice that differ in resistance to Trypanosoma congolense infections. J Parasitol. 1991;77:958–964. [PubMed] [Google Scholar]
- 16.Tabel H, Kaushik RS, Uzonna J. Experimental African trypanosomiasis: differences in cytokine and nitric oxide production by macrophages from resistant and susceptible mice. Pathobiology. 1999;67:273–276. doi: 10.1159/000028078. [DOI] [PubMed] [Google Scholar]
- 17.Uzonna JE, Kaushik RS, Gordon JR, Tabel H. Immunoregulation in experimental murine Trypanosoma congolense infection: anti-IL-10 antibodies reverse trypanosome-mediated suppression of lymphocyte proliferation in vitro and moderately prolong the lifespan of genetically susceptible BALB/c mice. Parasite Immunol. 1998;20:293–302. doi: 10.1046/j.1365-3024.1998.00156.x. [DOI] [PubMed] [Google Scholar]
- 18.Uzonna JE, Kaushik RS, Gordon JR, Tabel H. Cytokines and antibody responses during Trypanosoma congolense infections in two inbred mouse strains that differ in resistance. Parasite Immunol. 1999;21:57–71. doi: 10.1046/j.1365-3024.1999.00202.x. [DOI] [PubMed] [Google Scholar]
- 19.Miller CG, Justus DE, Jayaraman S, Kotwal GJ. Severe and prolonged inflammatory response to localized cowpox virus infection in footpads of C5-deficient mice: investigation of the role of host complement in poxvirus pathogenesis. Cell Immunol. 1995;162:326–332. doi: 10.1006/cimm.1995.1086. [DOI] [PubMed] [Google Scholar]
- 20.Ooi YM, Colten HR. Genetic defect in secretion of complement C5 in mice. Nature. 1979;282:207–208. doi: 10.1038/282207a0. [DOI] [PubMed] [Google Scholar]
- 21.Joseph SB, Bradley MN, Castrillo A, Bruhn KW, Mak PA, Pei L, et al. LXR-dependent gene expression is important for macrophage survival and the innate immune response. Cell. 2004;119:299–309. doi: 10.1016/j.cell.2004.09.032. [DOI] [PubMed] [Google Scholar]
- 22.Kay JG, Murray RZ, Pagan JK, Stow JL. Cytokine secretion via cholesterol-rich lipid raft-associated SNAREs at the phagocytic cup. J Biol Chem. 2006;281:11949–11954. doi: 10.1074/jbc.M600857200. [DOI] [PubMed] [Google Scholar]
- 23.Manley PN, Ancsin JB, Kisilevsky R. Rapid recycling of cholesterol: the joint biologic role of C-reactive protein and serum amyloid A. Med Hypotheses. 2006;66:784–792. doi: 10.1016/j.mehy.2005.10.018. [DOI] [PubMed] [Google Scholar]
- 24.Hancock JF. Lipid rafts: contentious only from simplistic standpoints. Nat Rev Mol Cell Biol. 2006;7:456–462. doi: 10.1038/nrm1925. [DOI] [PMC free article] [PubMed] [Google Scholar]
- 25.Machleder D, Ivandic B, Welch C, Castellani L, Reue K, Lusis AJ. Complex genetic control of HDL levels in mice in response to an atherogenic diet. Coordinate regulation of HDL levels and bile acid metabolism. J Clin Invest. 1997;99:1406–1419. doi: 10.1172/JCI119300. [DOI] [PMC free article] [PubMed] [Google Scholar]
- 26.Schwarz M, Davis DL, Vick BR, Russell DW. Genetic analysis of intestinal cholesterol absorption in inbred mice. J Lipid Res. 2001;42:1801–1811. [PubMed] [Google Scholar]
- 27.Suto J, Takahashi Y, Sekikawa K. Quantitative trait locus analysis of plasma cholesterol and triglyceride levels in C57BL/6J × RR F2 mice. Biochem Genet. 2004;42:347–363. doi: 10.1023/b:bigi.0000039809.40228.d3. [DOI] [PubMed] [Google Scholar]
- 28.Wang X, Le Roy I, Nicodeme E, Li R, Wagner R, Petros C, et al. Using advanced intercross lines for high-resolution mapping of HDL cholesterol quantitative trait loci. Genome Res. 2003;13:1654–1664. doi: 10.1101/gr.1185803. [DOI] [PMC free article] [PubMed] [Google Scholar]
- 29.Wittenburg H, Lyons MA, Li R, Kurtz U, Wang X, Mossner J, et al. QTL mapping for genetic determinants of lipoprotein cholesterol levels in independent and combined crosses of inbred mouse strains. J Lipid Res. 2006;47:1780–1790. doi: 10.1194/jlr.M500544-JLR200. [DOI] [PubMed] [Google Scholar]
- 30.Naessens J, Kitani H, Nakamura Y, Yagi Y, Sekikawa K, Iraqi F. TNF-alpha mediates the development of anaemia in a murine Trypanosoma brucei rhodesiense infection, but not the anaemia associated with a murine Trypanosoma congolense infection. Clin Exp Immunol. 2005;139:405–410. doi: 10.1111/j.1365-2249.2004.02717.x. [DOI] [PMC free article] [PubMed] [Google Scholar]
- 31.Authie E, Pobel T. Serum haemolytic complement activity and C3 levels in bovine trypanosomosis under natural conditions of challenge - early indications of individual susceptibility to disease. Vet Parasitol. 1990;35:43–59. doi: 10.1016/0304-4017(90)90115-r. [DOI] [PubMed] [Google Scholar]
- 32.Shi M, Pan W, Tabel H. Experimental African trypanosomiasis: IFN-gamma mediates early mortality. Eur J Immunol. 2003;33:108–118. doi: 10.1002/immu.200390013. [DOI] [PubMed] [Google Scholar]
- 33.Lakhdar-Ghazal F, Blonski C, Willson M, Michels P, Perie J. Glycolysis and proteases as targets for the design of new anti-trypanosome drugs. Curr Top Med Chem. 2002;2:439–456. doi: 10.2174/1568026024607472. [DOI] [PubMed] [Google Scholar]
- 34.Nantulya VM, Musoke AJ, Rurangirwa FR, Barbet AF, Ngaira JM, Katende JM. Immune depression in African trypanosomiasis: the role of antigenic competition. Clin Exp Immunol. 1982;47:234–242. [PMC free article] [PubMed] [Google Scholar]
- 35.Lanham SM. Separation of trypanosomes from the blood of infected rats and mice by anion-exchangers. Nature. 1968;218:1273–1274. doi: 10.1038/2181273a0. [DOI] [PubMed] [Google Scholar]
- 36.Chomczynski P, Sacchi N. Single-step method of RNA isolation by acid guanidinium thiocyanate-phenol-chloroform extraction. Anal Biochem. 1987;162:156–159. doi: 10.1006/abio.1987.9999. [DOI] [PubMed] [Google Scholar]
- 37.Hancock D, Wilson M, Velarde G, Morrison N, Hayes A, Hulme H, et al. maxdLoad2 and maxdBrowse: standards-compliant tools for microarray experimental annotation, data management and dissemination. BMC Bioinformatics. 2005;6:264. doi: 10.1186/1471-2105-6-264. [DOI] [PMC free article] [PubMed] [Google Scholar]
- 38.Fang Y, Brass A, Hoyle DC, Hayes A, Bashein A, Oliver SG, et al. A model-based analysis of microarray experimental error and normalisation. Nucleic Acids Res. 2003;31:e96. doi: 10.1093/nar/gng097. [DOI] [PMC free article] [PubMed] [Google Scholar]