Abstract
Clustering of gene expression data collected across time is receiving growing attention in the biological literature since time-course experiments allow one to understand dynamic biological processes and identify genes governed by the same processes. It is believed that genes demonstrating similar expression profiles over time might give an informative insight into how underlying biological mechanisms work. In this paper we propose a method based on Functional Data Analysis (FNDA) to cluster time-dependent gene expression profiles. Consideration of clustering problems using the FNDA setting provides ways to take time dependency into account by using basis function expansion to describe the partially observed curves. We also discuss how to choose the number of bases in the basis function expansion in FNDA. A synthetic cycle data and a real data are used to demonstrate the proposed method and some comparisons between the proposed and existing approaches using the adjusted Rand indices are made.
Keywords: Time-course gene expression, Functional data analysis, Clustering, Principal component analysis
1. Introduction
Microarray technologies in molecular biology make it possible to simultaneously measure the expression levels of thousands of genes for a certain organism. They allow us to gain biological insight at the genome scale and to study the behaviour of thousands of genes simultaneously, under various conditions. Gene expression can be examined from two points of view, static and dynamic. The gene expression in static microarray experiments is a snapshot at a single time, whereas in time-course experiments the expression profiles of genes are repeatedly measured over a time period. In particular, time-course microarray experiments are effective not only in studying gene expression profile levels over a period of time but also in exploring functions of genes and the interactions with their products. Since biological processes are dynamic and complex systems, such characteristics are essential factors in understanding how the underlying mechanisms regulate cellular processes and gene functions. Time-course microarray experiments are the tools for understanding temporal patterns of gene expression and detecting periodically expressed genes.
A number of statistical methods have been recently proposed to analyze time-course gene expression data. Peddada et al. (2003) proposed the order-restricted inference method to cluster and select genes in accordance with temporal or dose profiles arisen from microarray experiments. However, the approach resulted in that the gene profiles with a monotonic pattern but distinct accelerations in the profiles are identified as the same cluster. Johansson et al. (2003) treated genes as variables and employed the method of partial least squares to identify genes with periodic fluctuations in expression levels, coupled with the cell cycle in the budding yeas1t. The measure used for gene selection was the magnitude of frequencies of sinusoidal functions that fit the cyclically expressed data. Schliep et al. (2003) used Hidden Markov Models (HMM) that take time dependency of time-course data into account, where a set of clusters was obtained by the method of maximum likelihood. Luan and Li (2003) introduced the mixed-effects model using B-splines to analyze time-course gene expression data and carried out gene clustering in the framework of a mixture model. The clustering problem is viewed as a mixture model problem by introducing the cluster indicator to be estimated and to be treated as missing data in the estimation of the parameter associated with a mixture model using the EM algorithm. They also compared the proposed method with the model-based clustering method proposed by Fraley and Raftery (2002).
In this paper, we propose a unified approach for gene clustering and dimension reduction based on Functional Data Analysis (FNDA) to group observed curves with respect to their shapes or patterns by using the sample information in time-course microarray experiments.1 The fundamental idea behind FNDA is that the atom, or unit of observation, is considered to be the entire curve rather than just a set of observations (Ramsay and Silverman, 1997, 2002). Our clustering is built upon a basis-space approach, which reduces the dimensionality of the data and allows the time points to be non-equally spaced and to vary between subjects.
We apply this method to a time course microarray data set on the yeast cell cycle, and demonstrate that our method is able to identify tight clusters of genes with expression profiles focused on particular phases of the cell cycle.
2. Methods
2.1 Functional data analysis
Functional data refer to data in which each observation is a partially observed function or curve on some interval where these functions are often assumed to be smooth. What distinguishes FNDA from other conventional statistics is the datum or data unit. Many statistical methods treat numbers or vectors as the units of data. In FNDA, however, data units are functions or curves defined on some interval, rather than focusing on the observed values at particular points in the interval. The nature of functional data makes it necessary to consider function spaces such as Hilbert spaces, and each functional observation is viewed as a realization generated by a random mechanism in these spaces. The books by Ramsay and Silverman (1997, 2002) give useful accounts of the basic considerations of FNDA.
FNDA has a wide range of flexibility in the sense that the observation times are not required to be equally spaced for the subjects, and furthermore, these times can vary from one subject to another. Functional data do not necessarily assume that the values observed at different times for a single subject are independent although it often assumes that data from different subjects are independent.
Consider the situation where we observe sample curves which are partially observed on the subset of the interval. Let {X (t),t ∈ T} be a second order stochastic process defined on T, e.g., X ∈ L2 [a,b]. The stochastic process is a collection {X (t),t ∈ T} defined on a common probability space (Ω, F, P), where (Ω, F) is a measurable space and P is a measure on F with P(Ω) = 1. In order to clarify the use of the index sets in stochastic processes, one needs to write X (t) as a function X (ω,t) of two variables, where t is the time and ω ∈ Ω is the random element. For fixed t ∈ T, the function X (·,t) is a measurable map from Ω into ℜ. For fixed ω ∈ Ω, the function X (ω,·) becomes a sample path of the stochastic process. Denoted by μ(t)
for fixed t, where FX is the distribution function of a probability P on (Ω, F).
For fixed ω, a sample path X (ω,t) is an equivalent class of functions in the function space L2. Since functions in the space can be expressed in terms of basis functions generating the space, a separable Hilbert space, each function in the space can be written as a countable linear combination of the basis functions. Let {φk } be a set of basis functions of L2, then we see that for each X (ω,t) with fixed ω, there is a unique cT= (c1, c2,…) ∈ l2 such that
where l2 is a discrete analogue of L2 space. It should be emphasized that the stochastic process is decomposed into two parts ck and φk (t), and the random mechanism only involves in the coefficients ck = ck (ω) unless setting ω to be fixed.
Once the representation by basis functions is adopted, three types of computational issues need to be addressed: (a) choosing an appropriate type of basis function, (b) determine the number of basis functions, and (c) computing the best linear combination.
The choice of the number of basis functions clearly has implications in determining the assumed underlying smoothness of the process and the degree of dimension reduction provided by the basis representation. Ramsey and Silverman (1998) suggest that 20–30 basis functions are in general enough to extract prominent features. In this paper, we propose a way to select the number of basis functions analogous to determining the number of clusters using the Bayesian Information Criterion (BIC) in model-based clustering illustrated below. In this context, the number of basis functions with the maximum BIC score is selected for representing functional data as basis functions.
Choosing a basis is a more controversial issue since no basis will be universally optimal for all data sets. However there are advisable guidelines depending on specific occasions. For example, if the paths are uniformly smooth with limited features and especially if the curves appear to be periodic, then the Fourier basis seems to be a good choice. On the other hand, a spline basis or a wavelet basis may be a better choice if there are a number of local features which may be relevant for the statistical analysis. Note that for some basis functions, more computationally efficient alternatives are available (e.g. FFT for Fourier and DWT for wavelet). We may write
| (1) |
where is a set of basis functions and is a set of the corresponding coefficients. In reality, X (t) is only observed on a finite set of time interval, and suppose that we have xi(tj), i =1,…,n, j =1,2,…,J, where the time points tj’s can be irregularly spaced. The least squares approach is a standard method to determine the approximating basis expansion by minimizing the sum of squares
| (2) |
where and . The solution vector to the minimization problem (2) is, for i = 1,…,n,
| (3) |
if Φ has full rank. The computation in ci requires to obtain the inverse matrix, which can be challenged with higher dimension. However expensive computation can be lessened if ΦT Φ is a “band matrix” with nonzero elements only close to the diagonal. A special case of band matrices is a diagonal matrix. For instance, ΦT Φ is a diagonal matrix where the tj are equally spaced and a set of orthonormal basis functions is used.
2.2 Functional principal component analysis
Principal component analysis (PCA) is an effective technique for understanding the structure of data and reducing the dimensionality of massive data. Analogous to the classical multivariate PCA, the essential goal of functional PCA (FPCA) is to obtain the first few orthogonal functions, the so-called functional principal components (FPCs), that most efficiently describe the variations in the data. In this section, we will describe PCA in the context of FNDA.
Let {X (t),t ∈ T} be a zero-mean stochastic process where T is some index set which is taken to be a bounded or unbounded interval here. Assume that the sample paths belong to the usual L2 space of measurable functions on T with inner product
Let v be the covariance function of the {X (t)}, i.e. v(s,t) = EX (s)EX (t). The covariance operator V is defined to be
Suppose that V is a compact operator. Then V admits an eigenvalue decomposition (cf. Rynne and Youngson, 2001), namely V has a sequence of eigenvalues ρi and eigenfunctions ξi, i = 1,2,…, satisfying
In practice, we do not know the true function v but rather have a sample xi(t), 1 ≤ i ≤ N, where for each i, xi(t) is observed on a discrete set of points Ti = {ti,1,…,ti,Ji} for some finite Ji. In principle, v can be estimated from the data and the ρi and ξi can then be computed from the estimated covariance operator. Here we adopt the basis function approach. From (1), (2), and (3), the centered approximation of xi(t) is given by
where . Then the sample covariance function is
Hence the estimated covariance operator is
and if , then
which can be conveniently expressed as
where , Φ = [〈 φk , φm 〉], ϕ = (φ 1 ,..., φK)T, and b = b1,…,bK)T.
Hence the eigenvalue problem in the function space
can be expressed as
and can be solved as an eigenvalue problem in the finite dimensional space:
Thus, the jth principal component eigenvector bj of CΦ leads to an estimate ξ̂j = ϕT bj of the jth principal component eigenfunction of V.
Following the above procedure, the jth principal component score of x̂i is defined to be αi,j = 〈x̂i,ξ̂j〉 and we can write x̂i = x̂i,p + ri,p, where and ri,p = x̂i − x̂i,p. Clustering methods will be applied to the principal component score vectors αi =(αi,1,…,αi,p)T, 1 ≤ i ≤ N.
2.3 Model-based clustering
The previous sections elucidated how the basis expansion approaches are used to reconstruct partially observed functional data into function forms and how FPCA is used to reduce the dimensionality of the data by projecting them onto a finite-dimensional space spanned by a few prominent empirical orthonormal basis functions. The vector ci for the ith functional datum contains its coefficients which are a projection of the function onto the subspace spanned by the set of K basis functions and it may be interpreted as summarized information of characteristic which each function shows with respect to the basis functions. Thus it leads to a reduction from an infinite dimensional space to a finite one, such as a K dimensional space. Furthermore, FPCA results in more dimension reduction, and the vectors of the principal component scores αi can be used for clustering the functions using standard clustering methods.
A number of clustering methods are available. Many are hierarchical clustering procedures, for which the clusters are nested, such that one cluster may be fully contained within another cluster, but clusters may not overlap. Various clustering methods differ with respect to the manner in which distances between clusters are defined.
These various clustering techniques have played a pivotal role in analysis of microarray gene expression data, including hierarchical clustering (Eisen et al., 1998), K-means clustering (Tavazoie et al., 1999), and self-organizing maps (Tamayo et al., 1999). However, many of these heuristic clustering techniques have as drawback that they can not determine the number of clusters which in general is unknown. Recently, a model-based clustering method was proposed by Fraley and Raftery (2002) overcomes the above drawback of heuristic clustering methods by estimating the number of clusters. The model-based clustering method assumes the data are generated by a multivariate mixture normal distribution with appropriate means and covariance matrix. We apply this method to clustering of the time-course gene expression after FPCA.
Let y1,…,yn be independent multivariate observations. Each vector of observations is a realization from a multivariate normal mixture density,
where φ(yi | μi,Vi) denotes a multivariate normal distribution with mean vector μi and covariance matrix Vi, πk ’s are the mixing proportion or weights (πk ≥ 0 and ), and θi is the vector of unknown parameters in kth component density in the mixture. MCLUST (http://www.stat.washington.edu/mclust/) is available to perform this model-based clustering based on the mixture model and allows various specifications of the covariance matrix which determines geometric features of each component k.
In model-based clustering, the clustering problem is viewed as a model selection problem over a variety of candidate models specified by different covariance matrices in a multivariate normal mixture distribution and different number of clusters. The best clustering is achieved by choosing the best model in terms of a model selection criterion. The Bayesian Information Criterion (BIC) is often used as an approximation to the Bayes factor and is defined by
where L(θ̂k, Mk) is the maximized likelihood for the model Mk at the maximum likelihood estimate for θk, vk is the number of parameters to be estimated in the model Mk, and n is the number of observations in the fitted model. The model with smaller BIC value is preferred. Hence, in this paper, the criterion is implemented in not only determining the number of clusters in model-based clustering but also choosing the number of basis functions in the functional representation of raw data.
3. Results
3.1 Simulation studies
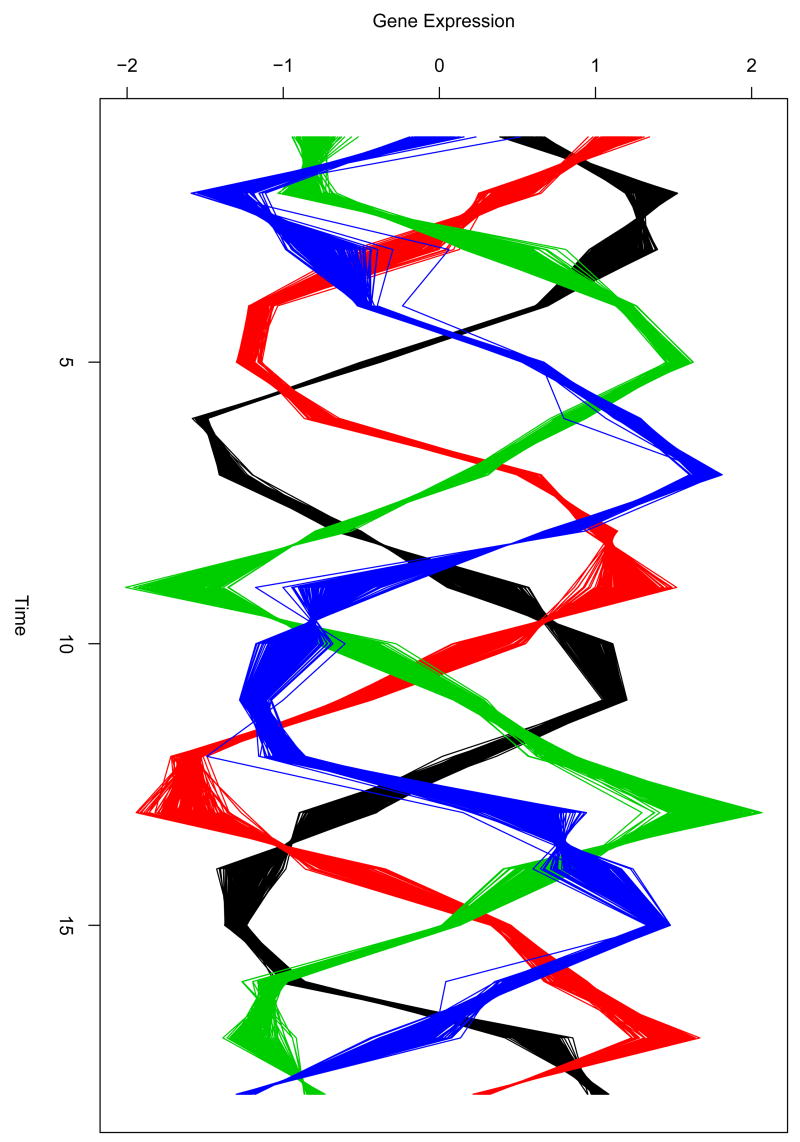
We used a synthetic cyclic data set used in Yeung et al. (2001) to demonstrate the proposed method. To model the data set, let yij =δj + λj(αi + βiφ(i, j)) be the simulated data point in curve i at time point j, where φ(i, j) = sin(2πj/8 − ωk + ε) controls the periodic behaviour. δj is an experimental error, αi is the average of curve i, ε is the noise of curve synchronization, and these are generated from the standard normal distribution. βi and λj control the amplitude of curve i and time j respectively, and the two components are generated from a normal distribution with mean 3 and standard deviation 0.5. Finally, ωk represents phase shift and is generated from the uniform distribution [0,2π]. In the study with a synthetic data, we simulated 200 curves over the 18 time points equally spaced for each class and specified that the number of classes is four (k=4), where i = 1,…,800 and j =1,…,18 (see Fig. 1). It is assumed that the curves in the same class have similar peak time to account for similar periodic behaviour in the same cluster. Each curve is scaled to between 0 and 1 by normalization.
Fig. 1.
800 simulated curves over the 18 time points equally spaced. Each curve is from one of four classes and each class has 200 curves.
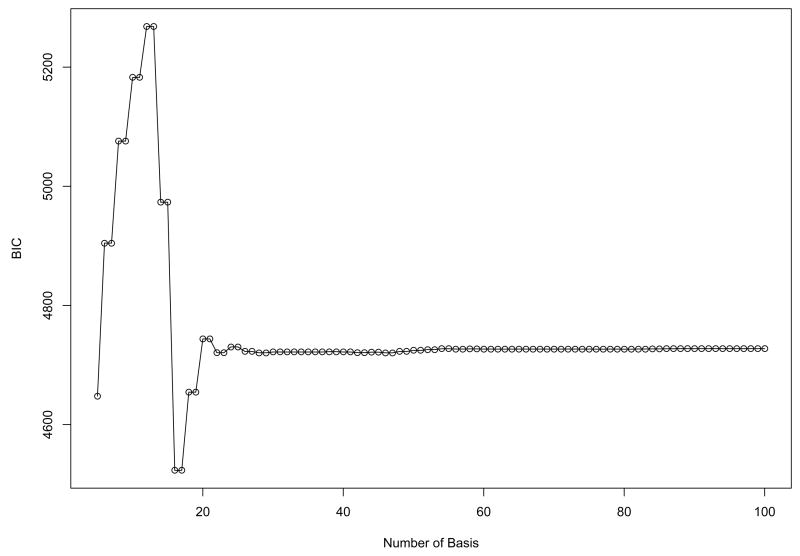
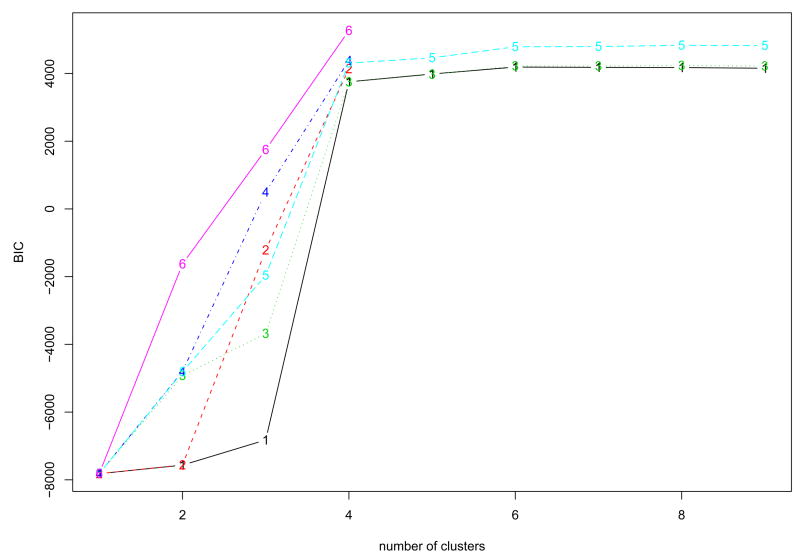
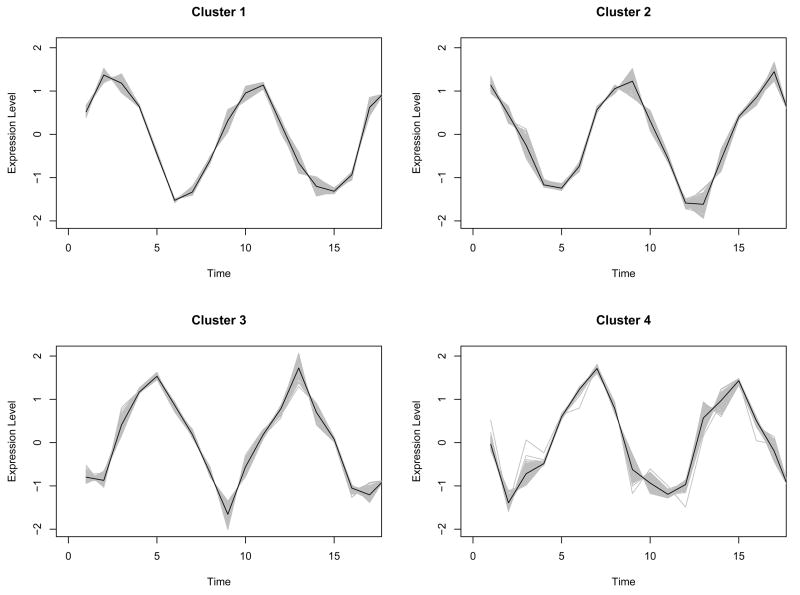
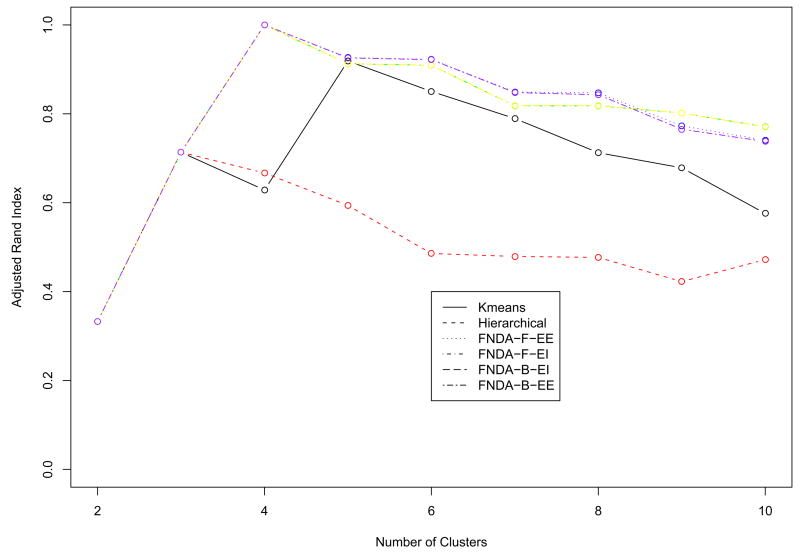
Since the simulated data are designed to have periodical patterns, Fourier basis function was used to convert discretely simulated data into functional form (See Methods). One of important issues in the representation of functional data by basis functions is to determine the number of basis functions (See Methods). We used the Bayesian Information Criterion (BIC) score to evaluate candidate models with different number of basis functions, and the optimal number is chosen from the best model in terms of BIC score. Fig. 2 shows that the model with 12 bases had the highest BIC within the given range of the number of bases, and the discretely sampled simulated data were represented using 12 Fourier bases. To further reduce the dimensionality of the converted data, we applied then FPCA to the data. The number of FPCs was determined by the variation in the functional data. The first two FPCs which account for around 98% variation in the data are selected for the following analysis. Then, we apply model-based clustering method to the vectors of selected FPC scores. Fig. 3 shows BIC scores over several models with different covariance matrix structure. The model with VVV covariance matrix is chosen with four clusters equal to the true number of classes, where VVV represents ellipsoidal, varying volume, shape and orientation. The resulting clusters are shown in Fig. 4. The bold line is the average of curves in each cluster. To validate the proposed method, the agreement between clustering results and true classes is measured using the adjust Rand index (Lawrence and Arabie, 1985). Ten synthetic data sets are generated and applied to FNDA clustering and two common heuristic clustering, K-means and hierarchical clustering. The average indices are plotted in Fig. 5. Two models in model-based clustering, the equal volume spherical (EI) and the equal volume and shape diagonal models (EE), are considered because of computational issues. The indices of all FNDA clustering methods are maximized at four clusters. However, two heuristic clustering techniques result in the maximum at three clusters and five clusters, respectively.
Fig. 2.
The BIC scores from model-based clustering for the synthetic cycle data using Fourier basis function to determine the optimal number of bases. 12 bases are selected.
Fig. 3.
The BIC scores in Model-based clustering for the synthetic cycle data using 12 Fourier bases to determine the number of clusters. Model VVV with four clusters is selected. 1=EII: spherical, equal volume, 2=VII: spherical, unequal volume, 3=EEI: diagonal, equal volume, equal shape 4=VVI: diagonal, varying volume, varying shape, 5=EEE: ellipsoidal, equal volume, shape, and orientation 6=VVV: ellipsoidal, varying volume, shape, and orientation.
Fig. 4.
Model-Based clustering for the synthetic cycle data using Fourier basis function. Bold line in each class is estimated mean curve.
Fig. 5.
The average adjusted Rand indices of ten synthetic cycle data over several clustering techniques. FNDA-F-EE: model-based clustering with diagonal, equal volume, equal shape covariance matrix using Fourier basis, FNDA-F-EI: model-based clustering with spherical, equal volume covariance matrix using Fourier basis, FNDA-B-EE: model-based clustering with diagonal, equal volume, equal shape covariance matrix using B-spline basis, FNDA-B-EI: model-based clustering with spherical, equal volume covariance matrix using B-spline basis.
3.2 Application to the Yeast cell cycle data
The proposed method was also applied to the time-course gene expression data from Spellman et al. (1998) yeast cell cycle microarray experiment. Using cDNA arrays in the experiment, the expression levels of 6178 yeast cycle genes were simultaneously measured. The expression levels for these genes were repeatedly measured every 7 minutes for 119 minutes, yielding a total of 18 time points. These comprise more than two full cell cycles. Out of the 6178 genes, Spellman et al. (1998) identified 800 genes as cell cycle-regulated genes. Among these 800 genes, 612 genes had no missing expression observations over the 18 time points and these genes were analyzed using the proposed method in this study. Spellman et al. (1998) grouped 800 genes into cell cycle phases (M/G1, G1, S, G2 and M) based on the time of peak expression of each gene.
We also applied the FNDA-based clustering method to these data. We considered two different basis functions - B-splines and Fourier. In each case, we computed the basis coefficients, and model-based clustering is performed on the PC scores after FPCA.
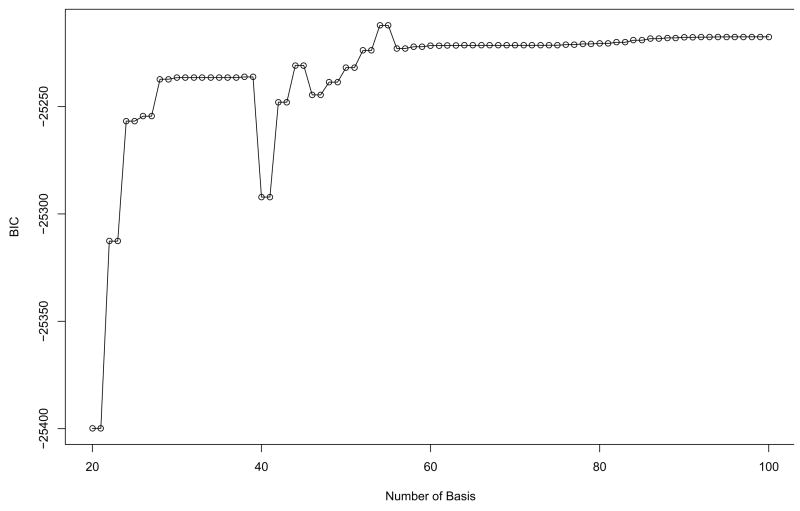
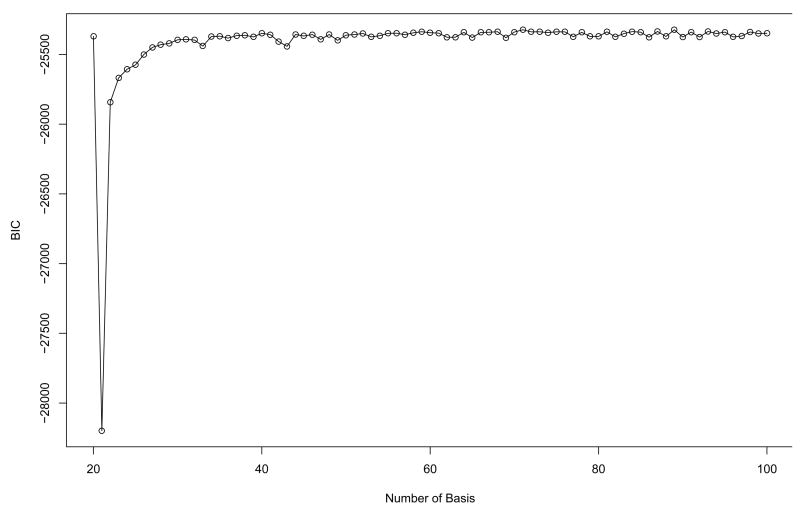
Fig. 6 and 7 show BIC scores for two types of basis functions, Fourier and B-spline, across the different number of basis functions. The models with 55 and 71 bases are selected for the two different basis functions, respectively. Hereafter the coefficients generated from the basis expansion are directly used for the further analysis. In FPCA, the first nine principal components which account for over 90% variation in the data are selected for both types of basis functions. For sensitivity of the clustering results to the different number of PCs, it is found that the number of PCs is constant to nine over the different number of basis functions for both types of basis functions. Then, we apply a model-based clustering method to the vectors of selected FPC scores.
Fig. 6.
The BIC scores from model-based clustering for the Yeast cell cycle data using Fourier basis function in order to determine the optimal number of bases. 55 bases are selected.
Fig. 7.
The BIC scores from model-based clustering for the Yeast cell cycle data using B-spline basis function in order to determine the optimal number of bases. 71 bases are selected.
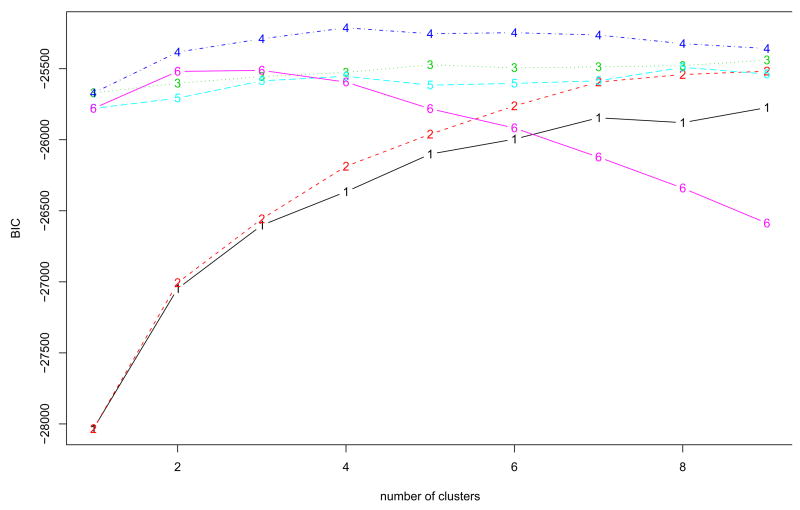
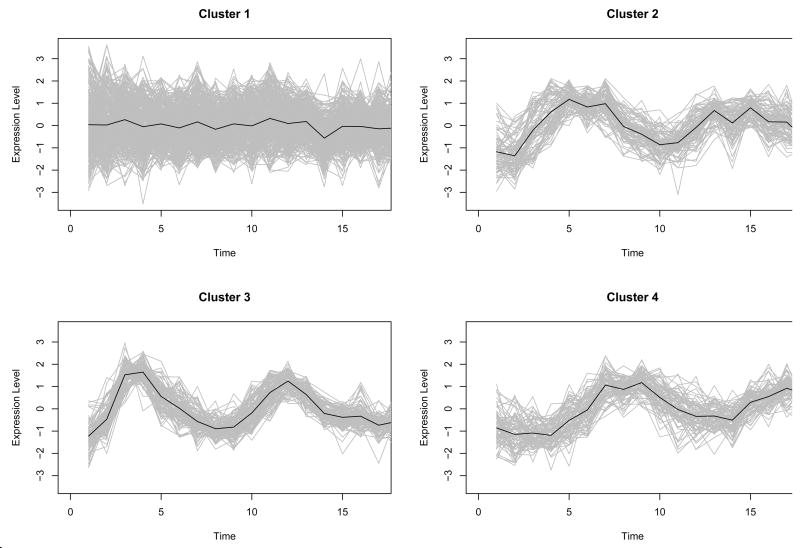
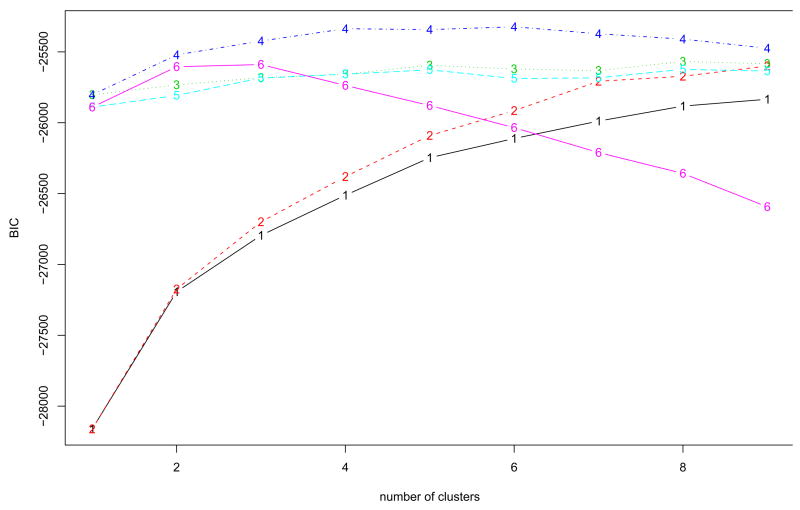
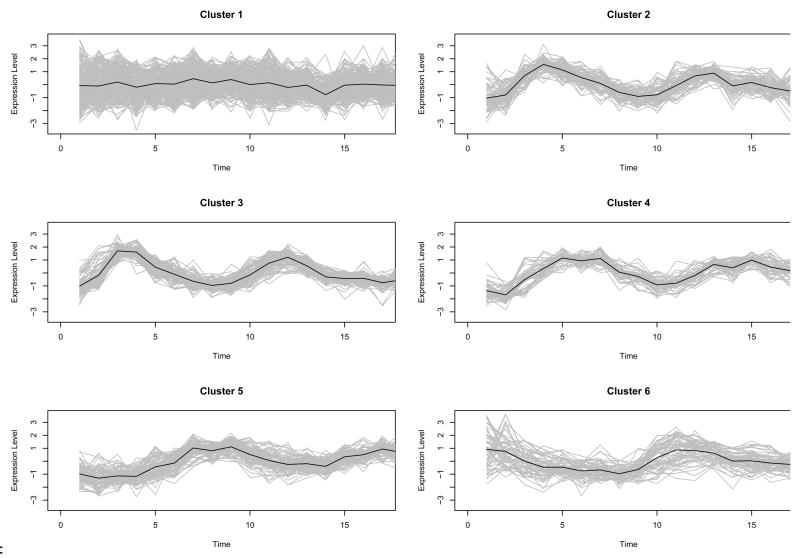
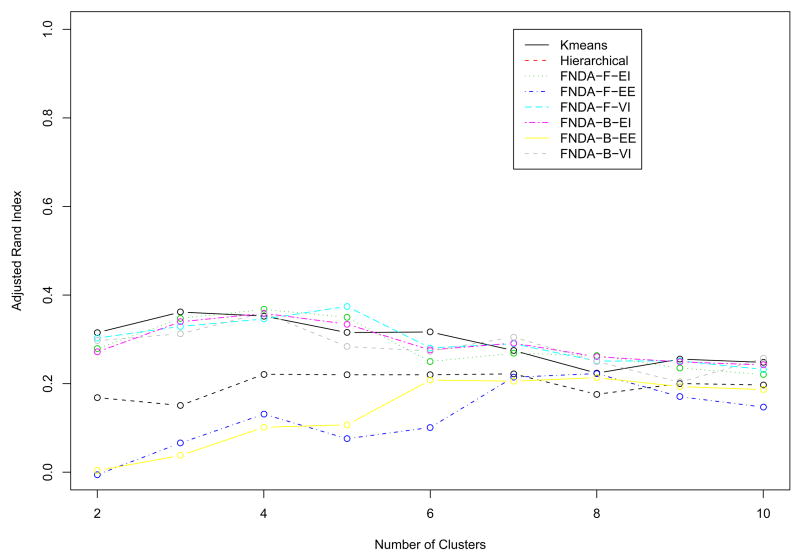
Our main interest is to cluster the genes based on the shapes or patterns, especially according to the five different cell-cycle phases. For Fourier basis function approach, VVI model at 4 clusters are selected in Fig. 8. “VVI” indicates that diagonal, varying volume, and varying shape covariance matrix is used in the multivariate normal mixture model. The clustering results based on the model selected are depicted in Fig. 9 and summarized in Table 1. Cluster 2 includes genes expressed in G1, S, and S/G2 phases. Genes in cluster 3 are expressed in M/G1 and G1 phases. Cluster 4 contains genes expressed in S/G2 and G2/M phases. Cluster 1 seems to be a set of heterogeneous genes. Using the B-spline basis, the best model is VVI model with 6 clusters in Fig. 10, and the resulting clusters are drawn in Fig. 11. Most genes in cluster 2 are expressed in G1 phase. Cluster 3 contains genes expressed in M/G1 and G1 phases. Most genes in cluster 4 and 5 are expressed in two phases, (G1,S) and (S/G2,G2/M), respectively. Similar to cluster 1 in Fourier basis approach, cluster 1 and 5 in B-spline basis approach appear to be sets of heterogeneous genes. To compare the clustering results to these of Spellman et al. (1998), the adjust Rand indices of two heuristic methods and three different models using model-based FNDA approaches are also computed and plotted in Fig. 12. VVI model using Fourier basis achieves the maximum at five clusters. It is interesting that VVI model using B-spline basis reaches the maximum at four clusters. EEI models over two basis functions produce relatively lower agreement with clustering results in Spellman et al. (1998).
Fig. 8.
The BIC scores in model-based clustering for the Yeast cell cycle data using 55 Fourier bases in order to determine the number of clusters. Model VVI with four clusters is selected, where “VVI” represents that diagonal, varying volume, and varying shape covariance matrix is used in model-based clustering. 1=EII: spherical, equal volume, 2=VII: spherical, unequal volume, 3=EEI: diagonal, equal volume, equal shape 4=VVI: diagonal, varying volume, varying shape, 5=EEE: ellipsoidal, equal volume, shape, and orientation 6=VVV: ellipsoidal, varying volume, shape, and orientation.
Fig. 9.
Model-Based clustering for the Yeast cell cycle data using Fourier basis function. Bold line in each class is estimated mean curve.
Table 1.
Arrangement of the cell-cycle regulated genes classified into one of five different phases in Spellman et al. (1998) over the four estimated gene cluster using the proposed method with 55 Fourier bases.
| M/G1 | G1 | S | S/G2 | G2/M | |
|---|---|---|---|---|---|
| Cluster 1 | 78 | 89 | 23 | 49 | 108 |
| Cluster 2 | 0 | 44 | 23 | 15 | 0 |
| Cluster 3 | 14 | 89 | 0 | 0 | 0 |
| Cluster 4 | 0 | 0 | 0 | 29 | 50 |
Fig. 10.
The BIC scores in model-based clustering for the Yeast cell cycle data using 71 B-spline bases in order to determine the number of clusters. Model VVI with six clusters is selected, where “VVI” represents that diagonal, varying volume, and varying shape covariance matrix is used in model-based clustering. 1=EII: spherical, equal volume, 2=VII: spherical, unequal volume, 3=EEI: diagonal, equal volume, equal shape 4=VVI: diagonal, varying volume, varying shape, 5=EEE: ellipsoidal, equal volume, shape, and orientation 6=VVV: ellipsoidal, varying volume, shape, and orientation.
Fig. 11.
Model-Based clustering for the Yeast cell cycle data using B-spline basis function. Bold line in each class is estimated mean curve.
Fig. 12.
The average adjusted Rand indices of the Yeast cell cycle data over several clustering techniques.. FNDA-F-EE: model-based clustering with diagonal, equal volume, equal shape covariance matrix using Fourier basis, FNDA-F-EI: model-based clustering with spherical, equal volume covariance matrix using Fourier basis, FNDA-F-VI: model-based clustering with diagonal, varying volume, and varying shape covariance matrix using Fourier basis, FNDA-B-EE: model-based clustering with diagonal, equal volume, equal shape covariance matrix using B-spline basis, FNDA-B-EI: model-based clustering with spherical, equal volume covariance matrix using B-spline basis, FNDA-B-VI: model-based clustering with diagonal, varying volume, and varying shape covariance matrix using B-spline basis.
4. Discussion
We have proposed a clustering method based on FNDA to group time-course gene expression profiles. FNDA allows us to account for time dependency in gene expression data monitored over a time period unequally spaced. Before clustering, FPCA can be a tool to reduce the dimensionality of the data. A model-based clustering provides a solution to determine the number of clusters.
The proposed method is applied to real data from yeast cell cycle microarray experiment and a synthetic data set with two sets of basis functions, Fourier and B-spline. In the study of the simulated data, we found the proposed method using Fourier basis function correctly cluster the all sampled curves into the true classes. For real yeast cell cycle data, Table 1 and 2 show that the clustering using Fourier basis functions groups gene expression profiles in real data more clearly than using B-spline basis function, which is reasonable because the profiles appear to be periodic over two cell cycles. In additional, it is shown in BIC analysis that Fourier basis approach outperforms B-spline approach. In depth discussion of new clusters interpretation is beyond the scope of current study.
Table 2.
Arrangement of the cell-cycle regulated genes classified into one of five different phases in Spellman et al. (1998) over the six estimated gene cluster using the proposed method with 71 B-Spline Bases.
| M/G1 | G1 | S | S/G2 | G2/M | |
|---|---|---|---|---|---|
| Cluster 1 | 36 | 45 | 25 | 56 | 99 |
| Cluster 2 | 1 | 73 | 0 | 0 | 0 |
| Cluster 3 | 20 | 72 | 0 | 0 | 0 |
| Cluster 4 | 0 | 20 | 20 | 7 | 0 |
| Cluster 5 | 0 | 1 | 0 | 29 | 50 |
| Cluster 6 | 35 | 11 | 2 | 1 | 9 |
Monitoring the behaviour of gene expression over certain time period plays an important role in exploring and investigating regulation of gene expression during cell cycle. Clustering methods have been used for comparative analysis of gene expression data collected over time, which group co-regulated genes that have similar periodic pattern or levels of expression. The FNDA approach to clustering problems allows us to take time dependency into account by adopting basis function expansions to describe the partially observed curves. It results in taking account of the dynamic nature of time-course gene expression profiles. The other advantage of FNDA approach is that the time points where the observations are evaluated are not necessarily required to be equally spaced, and also they may vary from one subject to another. In additional, in combination with FPCA before clustering, it can improve the quality of clustering through reducing dimensionality of data.
The merit of basis function methods in FNDA is that the basis function expansions can be used to reflect the intrinsic time trends in time-course experiments on clustering procedures. There are three computational issues to be addressed in basis function approach (See Methods). We proposed a means to determine the number of basis functions in the context of model selection using BIC score.
FPCA was used to reduce dimensionality before clustering analysis. Yeung and Ruzzo (2001) attempted to study the effectiveness of PCA in extracting clustering structure and addressed that using PCs instead of raw data in clustering analysis does not necessarily improve quality of clustering. In their paper, empirical studies present the first few PCs do not always help to capture clustering structure. It indicates that most explaining sets of PCs are not necessary representing clustering structure of raw data. Hence, it should be a promising future study to find the set of PCs to provide the highest quality of clustering when PCA is used before clustering analysis.
Using a probabilistic model, a normal mixture model, in a model-based clustering resolved one of the difficult problems in clustering analysis to determine the number of clusters. However, this method still has missing value problem to be resolved in order to extract clustering structure from more data. In microarray experiments, many missing values are generated after preprocessing. It is known that missing rate of gene expressions can be up to 50% (Vogl et al., 2005) and quality of clustering can be improved using imputed missing values. However, the proposed methodology in this study naturally takes account of this problem by adopting FNDA approach.
The adjusted Rand index is implemented for validation of resulting clustering in the synthetic data and for comparison to the result of Spellman et al. (1998) in the Yeast cell cycle data. Experimental validation, however, is not readily available, since genes identified from each yeast cell-cycle regulation system were not based on entire expression profile over time. It might make more sense to identify important genes of each cell cycle by determining their peak expression time since that is when they are most active. Over-time expression profiles, on the other hand, might provide different aspect of important genes, for example, finding unknown genes by co-expressed known genes or secondary cell-cycle regulation function.
This study is also promising in ecological studies that are fairly common to reveal environmental process dynamics. For example, Oak Ridge Field Research Center of Natural and Accelerated Bioremediation Research (NABIR) have collected and analyzed groundwater samples to monitor dynamics of uranium degradation related microbial communities and functions (http://www.esd.ornl.gov/nabirfrc/index.html). New type of customized oligo-microarray of microbially-mediated environmental functions is in place to collect information at the level of functional gene, and at this point sophisticated, effective and appropriate tools to extract inference out of huge amount of data is still on demand.
Acknowledgments
This research was partially supported by a start-up fund from University of Arkansas (J. J. Song) and a grant CA-67304 (J. Morris) from the National Cancer Institute.
Footnotes
FNDA is an acronym for Functional Data Analysis instead of FDA because FDA traditionally stands for US Food and Drug Administration.
Publisher's Disclaimer: This is a PDF file of an unedited manuscript that has been accepted for publication. As a service to our customers we are providing this early version of the manuscript. The manuscript will undergo copyediting, typesetting, and review of the resulting proof before it is published in its final citable form. Please note that during the production process errors may be discovered which could affect the content, and all legal disclaimers that apply to the journal pertain.
References
- Eisen M, Spellman P, Brown P, Bostein D. Cluster analysis and display of genome-wide expression patterns. Proc Natl Acad Sci U S A. 1998;95:14863–14868. doi: 10.1073/pnas.95.25.14863. [DOI] [PMC free article] [PubMed] [Google Scholar]
- Fraley C, Raftery AE. Model-based clustering, discriminant analysis, and density estimation. J Am Stat Assoc. 2002;97:611–631. [Google Scholar]
- Johansson D, Lindgren P, Berglund A. A multivariate approach applied to microarray data for identification of genes with cell cycle-coupled transcription. Bioinformatics. 2003;19:467–473. doi: 10.1093/bioinformatics/btg017. [DOI] [PubMed] [Google Scholar]
- Lawrence H, Arabie P. Comparing partitions. J Classif. 1985;2:193–218. [Google Scholar]
- Luan Y, Li H. Clustering of time-course gene expression data using a mixed-effects model with B-splines. Bioinformatics. 2003;19:474–482. doi: 10.1093/bioinformatics/btg014. [DOI] [PubMed] [Google Scholar]
- Peddada S, Lobenhofer EK, Li L, Afshari CA, Weinberg CR, Umbach DM. Gene selection and clustering for time-course and dose-response microarray experiments using order-restricted inference. Bioinformatics. 2003;19:834–841. doi: 10.1093/bioinformatics/btg093. [DOI] [PubMed] [Google Scholar]
- Ramsay JO, Silverman BW. Functional Data Analysis. Springer; New York: 1997. [Google Scholar]
- Ramsay JO, Silverman BW. Functional Data Analysis - Methods and Case Studies. Springer; New York: 2002. [Google Scholar]
- Rynne BP, Youngson MA. Linear Functional Analysis. Springer; London: 2001. [Google Scholar]
- Schliep A, Schönhuth A, Steinhoff C. Using hidden Markov models to analyze gene expression time course data. Bioinformatics Suppl. 2003;19:i255–i263. doi: 10.1093/bioinformatics/btg1036. [DOI] [PubMed] [Google Scholar]
- Spellman PT, Sherlock G, Zhang MQ, Iyer VR, Anders K, Eisen MB, Brown PO, Botstein D, Futcher B. Comprehensive identification of cell cycle-regulated genes of the yeast Saccharomyces cerevisiae by microarray hybridization. Mol Biol Cell. 1998;9:3273–3797. doi: 10.1091/mbc.9.12.3273. [DOI] [PMC free article] [PubMed] [Google Scholar]
- Tamayo P, Slonim D, Mesirov J, Zhu Q, Kitareewan S, Dmitrovsky E, Lander ES, Golub TR. Interpreting patterns of gene expression with self-organizing maps: methods and applications to hematopoietic differentiation. Proc Natl Acad Sci U S A. 1999;96:2907–2912. doi: 10.1073/pnas.96.6.2907. [DOI] [PMC free article] [PubMed] [Google Scholar]
- Tavazoie S, Jughes JD, Campbell MJ, Cho RJ, Church GM. Systematic determination of genetic network architecture. Nat Genet. 1999;22:281–285. doi: 10.1038/10343. [DOI] [PubMed] [Google Scholar]
- Vogl C, Sanchez-Cabo F, Stocker G, Jubbard S, Wolkenhauer O, Trajanoski Z. A fully Bayesian model to cluster gene-expression profiles. Bioinformatics. 2005;21:i130–i136. doi: 10.1093/bioinformatics/bti1122. [DOI] [PubMed] [Google Scholar]
- Yeung KY, Fraley C, Murua A, Raftery A, Ruzzo L. Model-based clustering and data transformations for gene expression data. Bioinformatics. 2001;17:977–987. doi: 10.1093/bioinformatics/17.10.977. [DOI] [PubMed] [Google Scholar]
- Yeung KY, Ruzzo WL. Principal component analysis for clustering gene expression data. Bioinformatics. 2001;17:763–774. doi: 10.1093/bioinformatics/17.9.763. [DOI] [PubMed] [Google Scholar]


