

Abstract
Gap genes are among the first transcriptional targets of maternal morphogen gradients in the early Drosophila embryo. However, it remains unclear whether these gradients are indeed sufficient to establish the boundaries of localized gap gene expression patterns. In this study, we address this question using gap gene circuits, which are data-driven mathematical tools for extracting regulatory information from quantitative wild-type gene expression data. We present new, quantitative data on the mRNA expression patterns for the gap genes Krüppel (Kr), knirps (kni) and giant (gt) during the early blastoderm stage of Drosophila development. This data set shows significant differences in timing of gap gene expression compared to previous observations, and reveals that early gap gene expression is highly variable in both space and time. Gene circuit models fit to this data set were used for a detailed regulatory analysis of early gap gene expression. Our analysis shows that the proper balance of maternal repression and activation is essential for the correct positioning of gap domains, and that such balance can only be achieved for early expression of kni. In contrast, our results suggest that early expression of gt requires local neutralization of repressive input in the anterior region of the embryo, and that known maternal gradients are completely insufficient to position the boundaries of the early central Kr domain, or in fact any Kr-like domain in the central region of the blastoderm embryo. Based on this, we propose that unknown additional regulators must be involved in early gap gene regulation.
Keywords: segment determination, segmentation gene network, maternal morphogen gradient, gap gene, gene regulation, gene circuit, non-linear dynamics, simulated annealing, network inference
1 Introduction
The segmented body plan of Drosophila melanogaster becomes determined during the blastoderm stage, around three hours after egg deposition (AED; Simcox and Sang, 1983). Segment determination involves the establishment of a periodic prepattern of gene expression by the segmentation gene network (reviewed in Akam, 1987; Ingham, 1988), which is subdivided into four hierarchical layers consisting of (1) maternal coordinate, (2) gap, (3) pair-rule and (4) segment-polarity genes (Nüsslein-Volhard and Wieschaus, 1980). Maternal genes are upstream of other segmentation genes in a strict sense, because they are first expressed during oogenesis, while segment polarity genes are downstream in a strict sense because they do not begin to be expressed until gastrulation. While gap and pair-rule genes are both expressed in the blastoderm, it is almost always true that gap genes regulate pair-rule and not the converse. There is extensive cross-regulation among genes within the same hierarchical layer.
The segmentation prepattern arises from initial asymmetries along the antero-posterior (A–P) axis of the embryo, which are provided by spatial gradients of the maternal transcription factors Bicoid (Bcd), Hunchback (Hb) and Caudal (Cad) (reviewed in Johnston and Nüsslein-Volhard, 1992). The Bcd gradient is formed by protein diffusion from the anterior pole where bcd messenger RNA (mRNA) is localized (Frigerio et al., 1986; Berleth et al., 1988; Driever and Nüsslein-Volhard, 1988b; Boring et al., 1993). Bcd in turn is responsible for the formation of the posterior Cad gradient by translational repression of uniformly distributed cad mRNA in the anterior region of the embryo (Mlodzik et al., 1985; Macdonald and Struhl, 1986; Dubnau and Struhl, 1996; Rivera-Pomar et al., 1996). Analogously, ubiquitous maternal hb mRNA is translationally repressed by Nanos (Nos) in the posterior region of the embryo (Tautz et al., 1987; Tautz, 1988; Murata and Wharton, 1995).
The initial expression of gap genes cannot be established by gap-gap cross-regulation. Localized domains of gap gene mRNA are observed during the early blastoderm stage (this work and Knipple et al., 1985; Tautz et al., 1987; Rothe et al., 1989; Mohler et al., 1989; Pritchard and Schubiger, 1996), before zygotic gap proteins can be unambiguously detected (Gaul and Jäckle, 1987; Eldon and Pirrotta, 1991; Kraut and Levine, 1991b; Poustelnikova et al., 2006). Since there is no evidence that gap gene mRNA is involved in transcriptional regulation, this implies that early gap domain boundaries must be established exclusively by maternal cues. This is consistent with evidence that the positions of several of these boundaries depend on maternal regulatory input in a concentration-dependent manner (Driever and Nüsslein-Volhard, 1988a; Struhl et al., 1989; Driever and Nüsslein-Volhard, 1989; Driever et al., 1989; Gao and Finkelstein, 1998). The only known candidate regulators are the spatially non-uniform maternal transcription factors Bcd, Hb and Cad. The maternal terminal system (reviewed in Furriols and Casanova, 2003) cannot play a role, since its regulatory input to Krüppel (Kr), knirps (kni) and giant (gt) is mediated by transcription factors encoded by the zygotic terminal gap genes tailless (tll) and huckebein (hkb) (Weigel et al., 1990; Brönner and Jäckle, 1991). Proteins expressed from these genes are not present when localized gap gene expression is initiated (Pignoni et al., 1990; Brönner and Jäckle, 1991; Poustelnikova et al., 2006).
It is an unanswered question whether or not gradients of Hb, Bcd, and Cad provide sufficient cues for the initial expression of gap genes in localized domains. The concentration profiles of these proteins only show significant gradient slopes in the anterior part of the embryo, while they are surprisingly flat more posteriorly (see Fig. 11B, C), with very small levels of spatial and temporal asymmetry (see Fig. 11D, E). Despite this apparent lack of instructional capacity, it is possible that sufficient cues exist in the posterior region of the embryo to initiate localized gap gene expression. In order to answer this question, an approach more comprehensive than the mere inspection of expression patterns is required.
Figure 11.
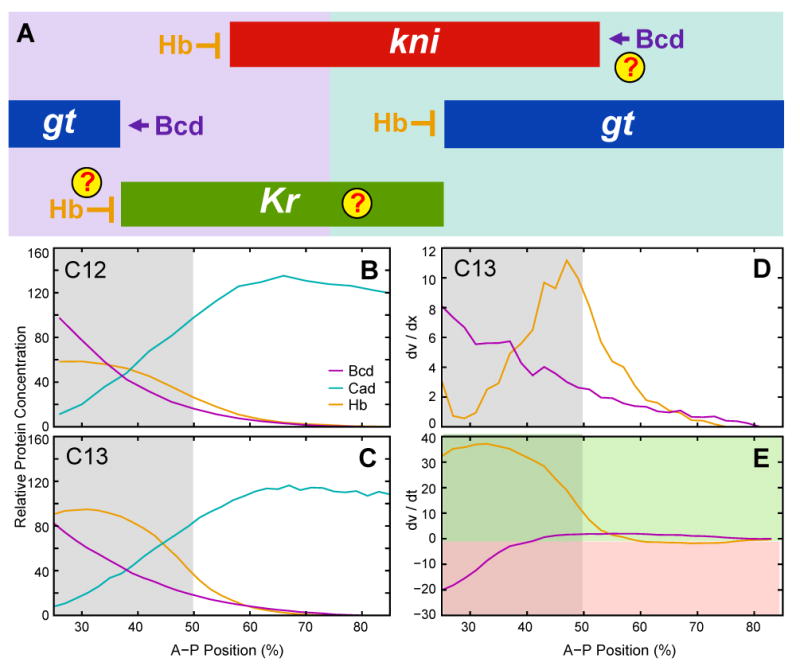
Maternal morphogens and early gap domain boundaries. (A) Expression domains of kni (red), gt (blue) and Kr (green) are shown schematically at early cleavage cycle 13. Anterior is to the left. Background color represents main maternal activating inputs by Bcd (purple) and Cad (turquoise). Arrows indicate boundary control by activation. T-bar connectors indicate boundary control by repression. Question marks indicate unknown interactions or ambiguous evidence. (B, C) Protein concentrations for Bcd (magenta), Hb (orange) and Cad (cyan) are shown at cycle 12 (time class: C12; B) and mid cycle 13 (C13A; C). Graph axes as in Figures 7–9. (D) Concentration differences (dv/dx) between nucleus i and nucleus i + 1 for Bcd (purple) and Hb (orange) at mid cycle 13 (C13). (E) Concentration differences (dv/dt) between cycle 12 (C12) and mid cycle 13 (C13) for Bcd (purple) and Hb (orange). Green background indicates increase, pink background decrease of concentration over time. Note that Hb repression increases while Bcd activation mostly decreases anterior of 50% A–P position, leading to a significant reduction of net activation in that region. Gray background in (B–E) indicates region of 25%–50% A–P position in which we cannot obtain Kr-shaped domains (see Fig. 10) and in which Hb concentration changes rapidly during early blastoderm stage.
Here we address the question of the sufficiency of known maternal gradients for the initiation of gap gene expression by means of a systemic method for calculating the effects of interacting genes on one another. This method, called the gene circuit approach, is based on data-driven mathematical modeling (Mjolsness et al., 1991; Reinitz and Sharp, 1995, 1996; Jaeger et al., 2004b,a; Perkins et al., 2006) which permits precise analysis of the relationship between regulatory effects and expression patterns. Previously published analyses of the gap gene system by this method did not address this question, since these models showed premature appearance of gap protein—and hence gap-gap cross-regulatory interactions—due to the lack of protein production delays in the current gene circuit formalism (Reinitz et al., 1995; Jaeger et al., 2004a). Furthermore, earlier models did not consider gap gene mRNA concentrations. Here we report an analysis of the instructive capacity of maternal gradients to specify the early mRNA expression patterns of Kr, kni and gt. A separate analysis of such early models—instead of adding production delays and mRNA concentrations to existing gap gene circuits (Jaeger et al., 2004b,a)—allows us to keep the analysis numerically tractable.
Gene circuits are computational tools which can be used in two distinct ways. First, they enable us to reconstitute wild type gene expression patterns in silico, infer underlying regulatory interactions from these patterns, and keep track of all direct regulatory interactions in all nuclei at all times (Mjolsness et al., 1991; Reinitz and Sharp, 1995, 1996). In other words, the gene circuit method provides evidence on regulatory interactions which is both independent of, and complementary to evidence gained from studies based on the visual inspection of mutant gene expression patterns (cf. Jaeger et al., 2004a). This is achieved in four main steps: (1) Formulation of a mathematical modeling framework, (2) collection of quantitative gene expression data, (3) fitting of the model to expression data to obtain regulatory parameters, and (4) biological analysis of the resulting gene circuit models (Figure 1; Reinitz and Sharp, 1995; Jaeger et al., 2004b,a).
Figure 1.
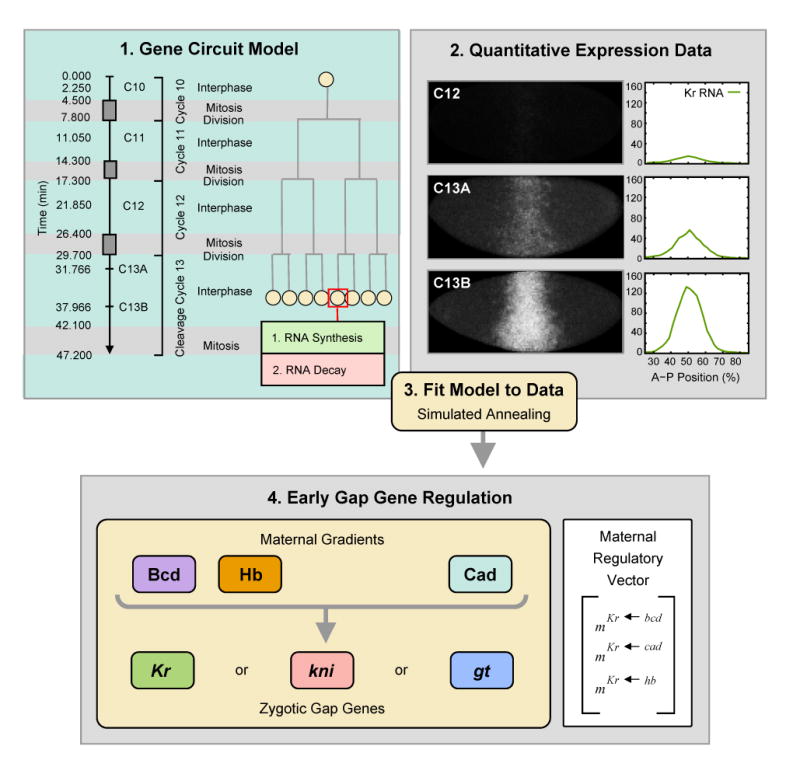
The gene circuit method consists of four main steps: (1) Formulation of a mathematical model, (2) acquisition and processing of quantitative gene expression data, (3) fitting of models to quantitative expression data, and (4) biological analysis of the resulting gene circuits—with their specific maternal regulatory vectors—which yields a detailed picture of the regulatory dynamics underlying early gap gene expression. Models cover the time from the beginning of the blastoderm stage (one minute into interphase of cleavage cycle 10; t = 0.0 min) to the end of cycle 13 (47.2 min). The three rules of the model (interphase, mitosis and nuclear division), and time classes used for comparison of model output to data are shown in (1). The mitotic schedule is based on Foe and Alberts (1983) and Foe (1989). mRNA synthesis (transcription) and decay occur in each nucleus during interphase, while transcription is shut down during mitosis. Nuclei divide instantaneously and equally at the end of each mitosis. Each model includes maternal protein gradients of Bcd, Hb and Cad as external regulatory inputs on a single gap gene (Kr, kni or gt). No gap-gap cross-regulatory interactions occur. (2) Embryos stained against Kr mRNA, shown at time classes C12, C13A and C13B. Anterior is to the left, dorsal is up. Graphs show integrated Kr expression data (green) for each time class. Relative mRNA concentration is plotted versus A–P position in percent (where 0% is the anterior pole). See text for details.
The second way of using gene circuits allows us to test which patterns of target gene expression are possible given a specific set of transcriptional regulators. Gene circuits fail to reproduce expression patterns unless a complete (i. e. sufficient) set of regulators is represented in the model (Reinitz et al., 1995; Jaeger et al., 2004a). This fact was exploited in a study where gene circuits including gap genes and the pair-rule gene even-skipped (eve) were fit to patterns of eve gene expression which had been shifted anteriorly or posteriorly by one or more nuclei (Reinitz et al., 1998). In contrast to the original eve pattern, none of these shifted patterns were reproduced correctly by the model, indicating that the expression pattern of eve is the only pair-rule pattern which can be formed by regulatory input from gap genes alone.
Early gap gene circuits were obtained by optimization of models against a new quantitative data set of gap mRNA expression patterns during the early blastoderm stage of D. melanogaster. This data set increases accuracy and temporal resolution of previous qualitative studies, and reveals large amounts of temporal and spatial variability in early gap gene expression. Early gap gene circuit models were then used for a detailed regulatory analysis of the establishment of kni and gt mRNA domains. This analysis suggests that proper balance of Bcd activation and Hb repression is critical for the correct positioning of early kni and gt expression domain boundaries. In the case of gt, this balance can only be achieved if Hb repression is neutralized in the region of the anterior gt domain. Moreover, we show that known maternal gradients are not able to account for the early expression pattern of Kr, or indeed any gap-like expression domain in the central region of the early Drosophila blastoderm embryo. This strongly suggests that currently known maternal gradients are not sufficient to position the complete set of expression domain boundaries required for correct, localized early gap gene expression.
2 Early Gap Gene Circuit Models
The early gap gene circuit models presented here cover the time from the beginning of the blastoderm stage (one minute into interphase of cleavage cycle 10) to the end of cycle 13 (Foe and Alberts, 1983). They span the region of the embryo from 25% to 85% A–P position (where 0% is the anterior pole), including all early gap domains between the peaks of the anterior and the posterior domains of gt (cf. Figure 6). This region excludes the anterior domains of Kr and kni which depend on factors not considered here (Rothe et al., 1994; Strunk et al., 2001), the anterior border of the anterior gt domain which forms during cycle 11 by an unknown regulatory mechanism (see Results), as well as the posterior border of the posterior gt domain which forms during late cycle 13 through repression by the zygotic terminal gap gene tll (see Figure 6 and Eldon and Pirrotta, 1991; Kraut and Levine, 1991b).
Figure 6.
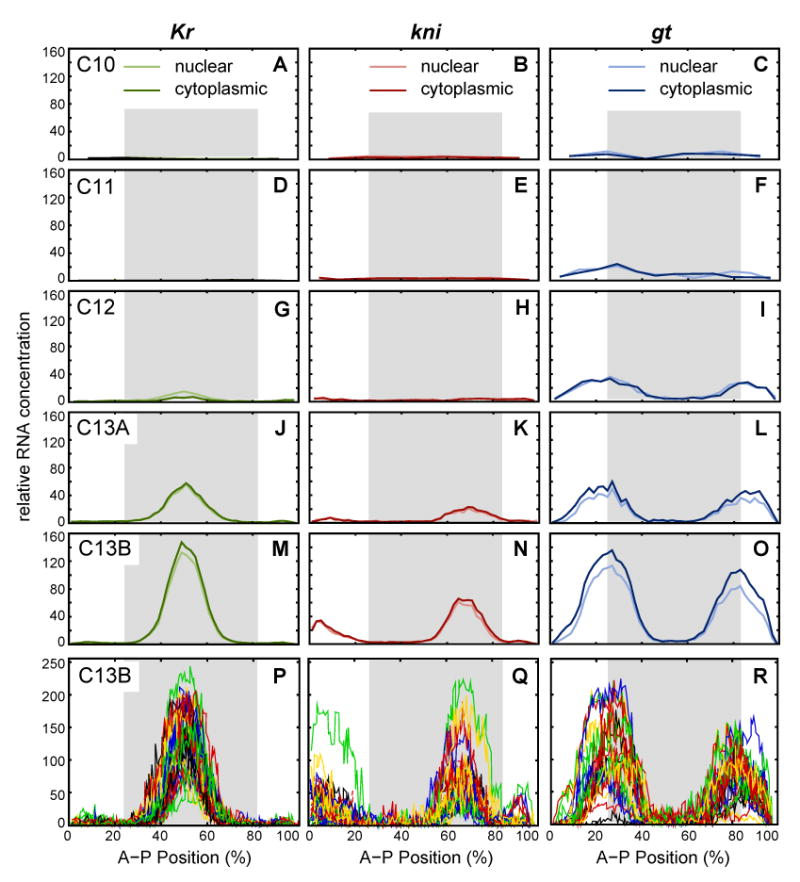
Integrated early gap gene expression data and embryo-to-embryo variability. (A–O) Averaged early mRNA expression patterns of Kr (green), kni (red) and gt (blue) are shown at (from top to bottom) cleavage cycle 10 (time class: C10), cycle 11 (C11), cycle 12 (C12), early cycle 13 (C13A) and late cycle 13 (C13B). Nuclear mRNA levels are shown in light, cytoplasmic levels in dark, saturated color. (P–R) Individual, segmented and background-removed expression patterns are shown for Kr (P), kni (Q) and gt (R) at late cycle 13 (time class: C13B; see Table 1 for numbers of embryos displayed in these graphs). Earlier time classes show comparably high levels of variation. Graph axes represent relative mRNA concentration and A–P position as in Figure 3. Gray shaded background indicates the region of the embryo included in early gap gene circuits. See Figure 1 for time classes.
The basic objects of a gene circuit are dividing blastoderm nuclei denoted by index i. Regulation of the gap gene domains considered here is independent of patterning along the dorso-ventral axis (see, for example, Rothe et al., 1994). Therefore, nuclei are arranged in a one-dimensional row along the A–P axis of the embryo (Figure 1). They divide instantaneously and equally at the end of each mitosis, according to the division schedule established by Foe and Alberts (1983) and Foe (1989) (Figure 1).
Each nucleus i contains maternal proteins (indexed by b) whose concentrations are calculated by linear interpolation (in time) of nuclear protein expression data for Bcd, Hb and Cad from the FlyEx data base (Poustelnikova et al., 2006). These maternal factors regulate the synthesis of zygotic gap gene mRNA during interphase, while transcription is shut down during each mitosis (Figure 1; cf. Edgar and Schubiger, 1986; Edgar et al., 1989).
Nuclear mRNA concentration is denoted by , where index a represents Kr, kni or gt. Each of these gap genes can be modeled separately since we do not consider gap-gap cross-regulatory interactions. Concentrations are the state variables of the system. Early gap gene circuits describe the change in nuclear gap mRNA concentration over time ( ) by systems of ordinary differential equations (ODEs). Each model consists of 30 uncoupled ODEs (which correspond to 30 nuclei within the modeled region at cycle 13), with 6–9 parameters to be determined by optimization. We use use coarse-grained kinetic equations of the general form
| (1) |
which approximate the exact biochemistry of transcription with a sigmoid regulation-expression function , where ua represents the total regulatory input to gap gene a (cf. Mjolsness et al., 1991; Reinitz and Sharp, 1995). Ra is the maximum transcription rate. mRNA decays at a rate λa, which is related to the mRNA's half life by . No diffusion occurs between neighboring nuclei, since we consider nuclear mRNA concentrations only. This means that each nucleus effectively constitutes an isolated dynamical system. We have also obtained and analyzed models based on averaged nuclear and cytoplasmic mRNA concentrations as state variables which include mRNA diffusion between neighboring nuclei. Such models showed no significant differences in expression patterns or regulatory mechanisms when compared to the diffusion-less models of nuclear mRNA presented here (data not shown).
Equation (1) constitutes a generic phemonenological model of transcription in the presence of many regulators. It is widely assumed that in any reasonable model of transcription the effect of a given protein on a promoter depends on the presence of other proteins, and that these other proteins may exert synergistic effects and possibly change the regulatory sign of a given protein. Within the context of the gene circuit model, the sigmoidal function g(u) in equation (1) provides for modulation of the regulatory effect of one regulator according to the presence or absence of others: Such effects can range from synergistic potentiation of regulatory effect (if other proteins move u close to the threshold of g(u)) all the way to the abolition of regulatory effect (if other proteins move u far from threshold of g(u)). Cooperative effects of dimerization or cooperative binding to DNA are representable by high sensitivity of ua to protein concentrations, leading to a steep sigmoid similar to a higher order Hill function (Hill, 1985). Context- or concentration-dependent changes in regulatory sign are permitted by some, but not all, of the formulations of ua considered here.
We explore several formulations of ua which implement regulatory inputs in different ways. Basic gene circuits (GC models) are directly derived from gene circuit models used in previous studies (Mjolsness et al., 1991; Reinitz and Sharp, 1995; Jaeger et al., 2004b,a). In these models,
| (2) |
where M is the total number of maternal regulators b. mb are the elements of a maternal regulatory vector (in the mathematical sense; Figure 1). They characterize the regulatory effect of maternal regulator b on gap gene a as follows: b activates a if mb is positive, b represses a if mb is negative, and there is no effect of b on a if mb is close or equal to zero. Lastly, ha is a threshold parameter representing regulatory contributions of uniformly expressed maternal transcription factors.
We use an extended version of the basic GC model (eGC) to test whether minute—but possibly important—amounts of Kr, Kni, Gt and Tll protein at cleavage cycle 12 and early cycle 13 (indexed by c) participate in the establishment of early gt and Kr domains. In these models,
| (3) |
where represents linearly interpolated protein concentrations for zygotic proteins from the FlyEx data base (Poustelnikova et al., 2006). N is the total number of such zygotic external inputs, and Ec are the corresponding regulatory parameters, analogous to maternal regulatory parameters mb. Note that in eGC models, we consider gap-gap cross-regulatory, but never autoregulatory interactions which cannot be involved in the initial establishment of gap mRNA domains since they themselves require the presence of localized mRNA domains. Including such interactions in eGC models leads to model artifacts where gap protein domains establish their own mRNA domains (data not shown).
Next, we consider the possibility that the effect of a maternal regulator may depend on concentrations of localized maternal co-regulators. We implement such context-dependence of regulatory parameters by a symmetric maternal regulatory matrix mbc, where both indices b and c represent regulator proteins (3D models). This leads to a modified sum of regulatory contributions
| (4) |
which allows for factor b to have a different regulatory effect on gene a whether factor c is present or not.
Another modified gene circuit model allows concentration-dependent switching of the regulatory sign for Hb. This is motivated by experimental studies which proposed a dual regulatory effect of Hb on Kr with activation of Kr at low, and repression at high concentrations of Hb (Hülskamp et al., 1990; Struhl et al., 1992; Schulz and Tautz, 1994). It is implemented by splitting the regulatory term for the input of maternal Hb on Kr such that
| (5) |
where m0 ≥ 0 and m1 ≤ 0. Since the repressive parameter m1 is multiplied by the square of , its regulatory contribution will increase more rapidly with Hb concentration than that of the activating parameter m0, allowing repression to dominate over activation at high Hb concentrations. Note that this version of the gap gene circuit equation corresponds to Equation (2) with a single context-dependent term ( ) added to it (cf. Equation (4)).
Finally, we consider a non-additive version of ua to test whether non-linear dependence of regulatory interactions on regulator concentrations could have an effect on the establishment of gap domain boundaries. Regulatory inputs depend on the logarithm of transcription factor concentrations (Log models). Thus, we write
| (6) |
where ha, mb and represent threshold and regulatory parameters, as well as concentrations of maternal regulators equivalent to Equation (2). For this model, maternal regulator concentrations had to be renormalized to a minimum value of 1 to ensure consistency of regulatory signs for regulatory inputs.
The gene circuit modeling framework does not specify which specific regulatory interactions take place within a gap gene circuit. These interactions are determined by regulatory parameters mb, mbc or Ec in the model equations described above. We seek estimates for the values of these parameters which cause gene circuit models to produce expression patterns that resemble measured gap gene expression as closely as possible. This is achieved by fitting the model to quantitative gap gene mRNA expression data using an optimization method called Lam simulated annealing (Figure 1; Lam and Delosme, 1988a,b; Reinitz and Sharp, 1995, and Experimental Procedures). Sets of parameter values obtained by optimization define specific early gap gene circuits and contain regulatory information extracted from the expression data. This information is then subjected to graphical regulatory analysis as described in detail in the Results and Experimental Procedures sections below.
3 Results
3.1 Gap Gene Expression in the Early Blastoderm
A quantitative, integrated data set of Kr, kni and gt mRNA expression patterns during cleavage cycles 10–13 was prepared according to data acquisition and processing methods described in Experimental Procedures (see Figure 2). The following paragraphs provide a detailed description of the early gene expression patterns of each of these gap genes in turn.
Figure 2.
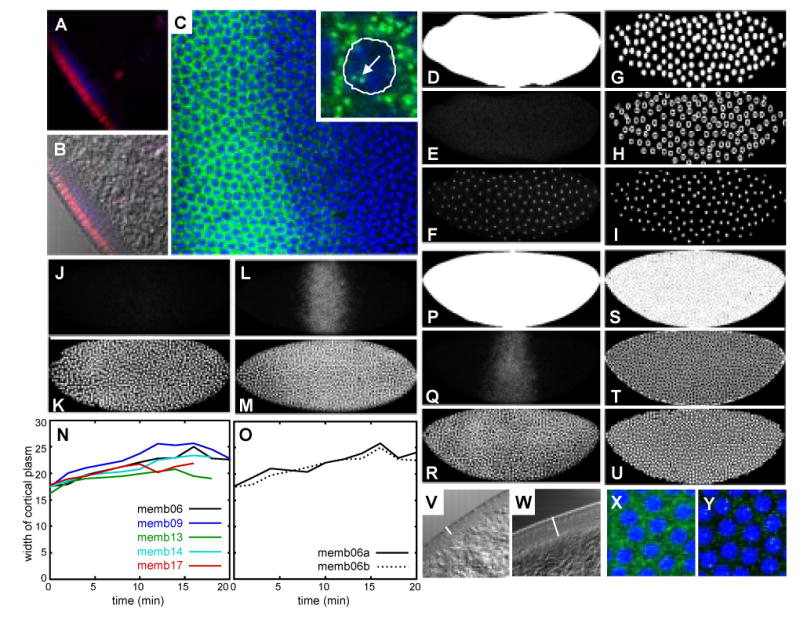
Data quantification and time classification. (A–C) Gap gene mRNA shows complex subcellular localization. (A, B) Apical-basal view of blastoderm embryos stained for Kr mRNA (blue) and Kr protein (red), with DIC image overlay shown in (B). Kr mRNA accumulates in the cytoplasm below the layer of blastoderm nuclei. (C) PicoGreen nuclear dye (blue) and Kr mRNA (green) in a lateral view. Enlarged inset shows outline of nucleus and punctate staining pattern in nuclei (arrow) and cytoplasm. (D, P) Whole-embryo binary mask used for alignment and cropping of embryos. (E, J, L, Q) Kr mRNA expression patterns. (F, K, M, R) PicoGreen nuclear stain. (G, S) Watershed, (H, T) cytoplasmic, and (I, U) nuclear segmentation masks. Anterior is to the left, dorsal is up in embryo images. Embryos shown at cleavage cycle 10 (D–I; time class: C10), early cycle 13 (J, K; C13A), and late cycle 13 (L, M, P–U; C13B). (N, O) Measured width of yolk-free cortical plasm in live embryos during cycle 13. (N) Comparison between different embryos. (O) Two independent measurements on the same embryo to test reproducibility of measurements. (V, W) Apical-basal view of DIC images of embryos at early (V) and late (W) cleavage cycle 13. White bars indicate width of cortical plasm. (X, Y) Magnified views of embryos stained for kni mRNA (green; PicoGreen in blue) at cycle 12 (X) and early cycle 13 (Y) respectively. (X) Image taken using strongly enhanced offset/gain to show uniform background staining. (Y) Nuclear expression dots are clearly distinguishable from faint background staining at this early stage of kni expression. See Experimental Procedures for details.
No Kr mRNA can be detected during interphases of cleavage cycles 10 and 11 (Figure 3A, B, G, H). However, we detect transient Kr mRNA signal in the central region of the embryo during meta- or anaphase of mitoses 10 and 11 (Figure 3A, B, insets; see also Pritchard and Schubiger, 1996). Consistent with earlier observations (Knipple et al., 1985), persistent expression in the central domain of Kr appears during interphase of cleavage cycle 12 (Figure 3C, I). Expression levels are low at this stage. During cycle 13, central Kr expression increases rapidly expanding in both anterior and posterior direction (Figure 3J–L, P–R). Early Kr mRNA patterns show punctate nuclear localization (“nuclear dots”; Figure 3C, J, K)—which correspond to active sites of transcription within nuclei (Kosman et al., 2004)—while later patterns show increasingly cytoplasmic localization and nuclear dots diminish in strength by late cycle 13 (Figure 3L).
Figure 3.
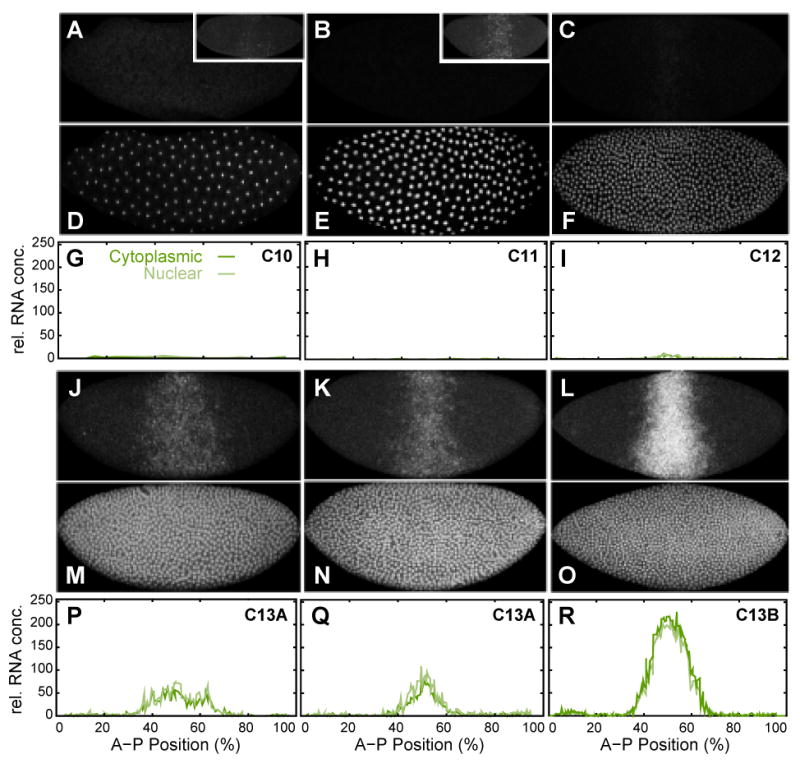
Early mRNA expression pattern of Kr. Kr mRNA (A–C, J–L) and nuclear (D–F, M–O) data channels, as well as segmented Kr mRNA data (G–I, P–R) are shown at cleavage cycle 10 (A, D, G: embryo kaa05), cycle 11 (B, E, H: kaa06), cycle 12 (C, F, I: kaa04), early cycle 13 (J, M, P: kab27; K, N, Q: kab09) and late cycle 13 (L, O, R: kab15). Insets in (A) and (B) show early transient Kr expression during mitosis 10 (A: kab36) and mitosis 11 (B: kab14). Nuclear data channels for kab36 and kab14 suggest that these embryos are in meta-or anaphase (data not shown; cf. Pritchard and Schubiger, 1996). Note the large difference in boundary positions between (J) and (K). Embryo images: Anterior is to the left, dorsal is up. Graph axes represent relative mRNA concentration and percent A–P position (where 0% is the anterior pole). Graphs show nuclear mRNA concentrations in light green, cytoplasmic concentrations in dark green. See Experimental Procedures for details on time classification and data quantification.
In contrast to previous studies (Rothe et al., 1989, 1994; Pritchard and Schubiger, 1996), we are unable to detect any kni mRNA before mitosis 12 (Figure 4A–C, G–I). Notably, we did not observe any transient early cell-cycle dependent kni expression during mitosis as reported in Pritchard and Schubiger (1996) and for Kr above. Low levels of kni mRNA appear within its posterior domain during mitosis 12 (Figure 4J, P). Subsequently, levels of kni mRNA increase rapidly during cycle 13 in the posterior domain as well as in the anterior, ventral domain which is first detected during early cycle 13 (Figure 4K, L, Q, R). As is the case for Kr, kni mRNA becomes increasingly cytoplasmic during cycle 13.
Figure 4.
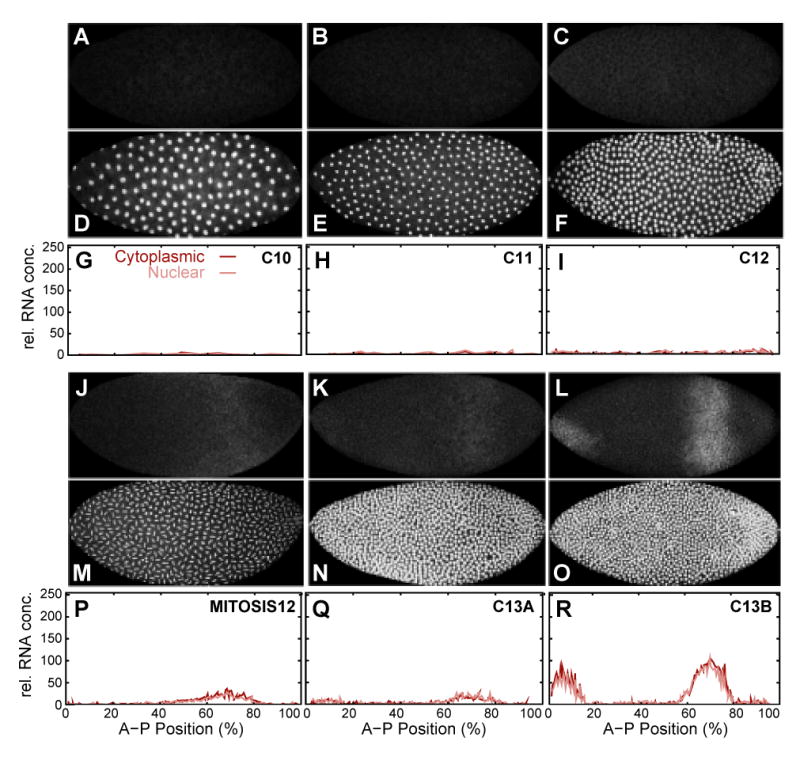
Early mRNA expression pattern of kni. kni mRNA (A–C, J–L) and nuclear (D–F, M–O) data channels, as well as segmented kni mRNA data (G–I, P–R) are shown at cleavage cycle 10 (A, D, G: embryo naa43), cycle 11 (B, E, H: naa45), cycle 12 (C, F, I: naa11), mitosis 12 (J, M, P: naa52), early cycle 13 (K, N, Q: naa08) and late cycle 13 (L, O, R: naa33). Embryo images: Anterior is to the left, dorsal is up. Graph axes represent relative mRNA concentration and A–P position as in Figure 3. Graphs show nuclear mRNA concentrations in pink, cytoplasmic concentrations in dark red. See Experimental Procedures for details on time classification and data quantification.
No gt mRNA could be detected during cycle 10 (Figure 5A, G), and in most embryos during cycle 11 (Figure 5B, H). However, two embryos in cycle 11 (out of 11; cf. Table 1) show nuclear dots of anterior gt expression (Figure 5C, I). This is earlier than previously reported (Mohler et al., 1989; Kraut and Levine, 1991b), and earlier than initial expression of Kr and kni (cf. Figures 3 and 4). Both gt domains are clearly present in all embryos by cycle 12 (Figure 5J, P), showing higher levels of expression than the central domain of Kr at this stage (compare Figure 5J, P with Figure 3C, I). The anterior gt domain forms as a stripe, with an initial anterior boundary (Figure 5J, K, P, Q). The posterior domain forms as a posterior cap, only retracting from the posterior pole during cycle 13 (Figure 5J–L, P–R). gt mRNA becomes increasingly cytoplasmic at early cycle 13, somewhat earlier than Kr or kni mRNA. Both gt domains sharpen as mRNA levels increase during cycle 13 (Figure 5L, R).
Figure 5.
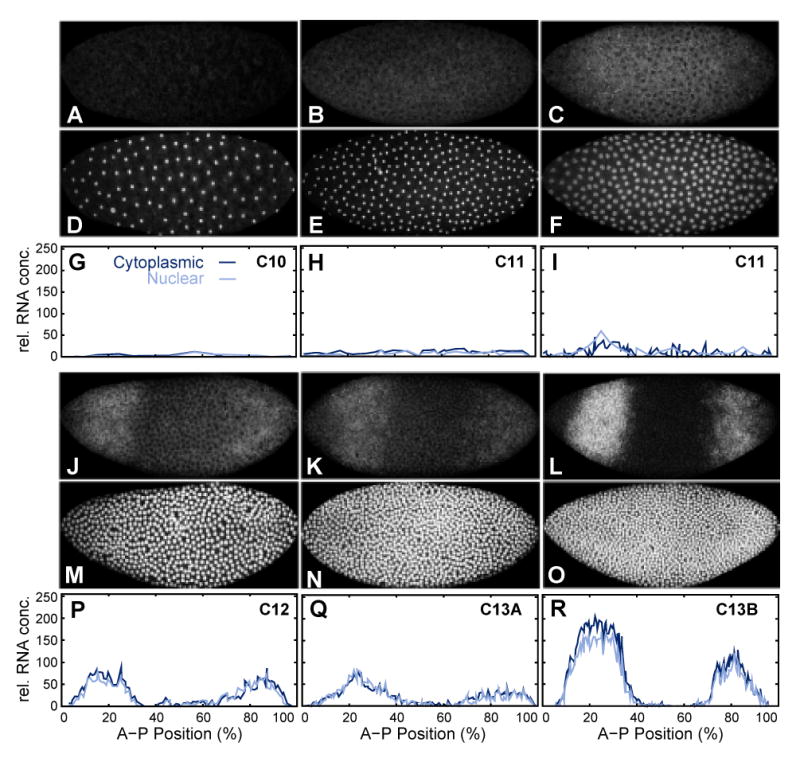
Early mRNA expression pattern of gt. gt mRNA (A–C, J–L) and nuclear (D–F, M–O) data channels, as well as segmented gt mRNA data (G–I, P–R) are shown at cleavage cycle 10 (A, D, G: embryo gaa12), cycle 11 (B, E, H: gaa53; C, F, I: gaa76), cycle 12 (J, M, P: gaa04), early cycle 13 (K, N, Q: gaa36) and late cycle 13 (L, O, R: gaa51). Embryo images: Anterior is to the left, dorsal is up. Graph axes represent relative mRNA concentration and A–P position as in Figure 3. Graphs show nuclear mRNA concentrations in light blue, cytoplasmic concentrations in dark blue. See Experimental Procedures for details on time classification and data quantification.
Table 1.
Number of embryos used for integrated expression data.
| Time Class | Kr | kni | gt | |||
|---|---|---|---|---|---|---|
| C10 | 2 | (3) | 4 | (11) | 2 | (15) |
| C11 | 2 | (3) | 8 | (14) | 2 | (11) |
| C12 | 11 | (15) | 11 | (32) | 7 | (13) |
| C13 | 48 | (56) | 34 | (56) | 33 | (42) |
| C13A | 19 | 13 | 11 | |||
| C13B | 29 | 21 | 21 | |||
|
| ||||||
| Total | 63 | (77) | 57 | (113) | 44 | (81) |
Numbers of embryos per gene and time class used for creating the integrated data set of early gap mRNA expression patterns shown in Figure 6. Numbers in parentheses represent numbers of embryos per gene and cleavage cycle used for the descriptive study of early mRNA expression patterns shown in Figures 3–5. See Figure 1 for time classes.
Integrated expression patterns for Kr, kni and gt based on the entire data set are shown in Figure 6A–O (see also Table 1). Note the large amount of embryo-to-embryo variability in the early expression patterns of all of these genes (Figure 6P–R; see also Discussion).
3.2 Early kni Gene Circuits
The integrated data on early gap gene expression shown in Figure 6A–O were used to fit early gap gene circuit models. We assume that maternal regulation of mRNA must be consistent with regulation of the corresponding protein expression pattern. Therefore, it was our aim in this study to test whether maternal regulatory inputs consistent with those presented in Jaeger et al. (2004a) can account for correct early gap gene expression in the absence of gap-gap cross-regulation. To achieve this, signs of regulatory parameters were constrained during optimization to ensure activation by Bcd and Cad, and repression by Hb (cf. Figure 4 in Jaeger et al., 2004a).
Basic early kni gene circuits (GC model; Equation (2)) reproduce the posterior domain of kni quite accurately, with a very low root mean square (RMS) score of 7.5 (Figure 7; see Experimental Procedures for the definition of RMS scores; see Table 2 for parameter values). Graphical regulatory analysis shows that the anterior boundary of this domain is set by Hb repression (Figure 7C, G, K), while kni is activated by a combination of inputs from Cad and Bcd. Bcd activation is stronger than that by Cad, and decreasing amounts of Bcd toward the posterior pole are responsible for setting the posterior border of kni (Figure 7D, H, L).
Figure 7.
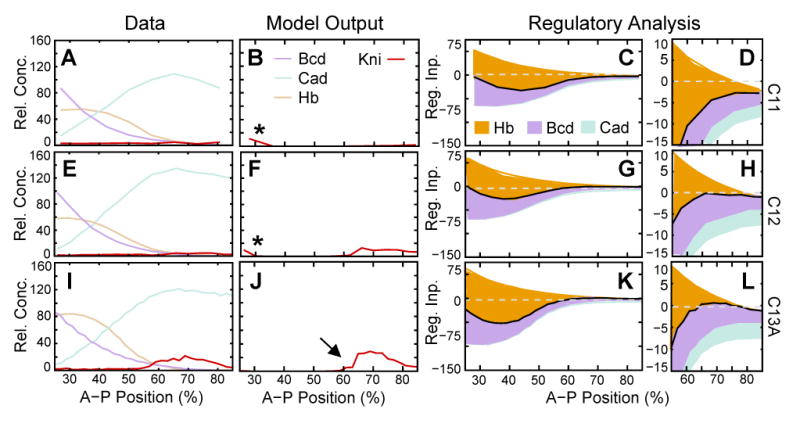
Gene circuit model for early kni expression. (A, E, I) Expression data for kni mRNA (red), as well as Bcd (purple), Hb (beige) and Cad (turquoise) protein. (B, F, J) Model output and (C, D, G, H, K, L) regulatory analysis of an early kni circuit based on Equation (2) (model: GC). (D, H, L) show enlarged plots of the posterior half of (C, G, K). Expression and regulatory graphs are shown at cleavage cycle 11 (time class: C11; A–D), cycle 12 (C12; E–H), and early cycle 13 (C13A; I–L). Asterisks in (B, F) indicate spurious anterior kni expression. Arrow in (J) indicates the posterior shift of the anterior kni boundary in model output compared to data. Vertical axes in expression graphs represent relative mRNA or protein concentration; vertical axes in regulatory graphs represent regulatory input. In regulatory graphs, total regulatory input u is shown as a solid black line. Colored areas represent individual regulatory contributions. The height of each colored area represents strength of regulatory inputs as given by in Equation (2), and indicates the difference in regulation level if a given input is present or absent. Absence of activating inputs leads to a decrease in regulatory levels. Therefore, they appear below the black line. Analogously, repressive inputs appear above the black line. Horizontal dashed lines indicate where regulatory input u = 0.
Table 2.
Estimated parameter values for early gap gene circuits.
| parameter | kGC | k3D | kLog | kdHB | nGC | gGC | geGC | g_ant | g_post | g3D |
|---|---|---|---|---|---|---|---|---|---|---|
| mBcd | 6.601 | 0.000 | 2.042 | 0.000 | 0.923 | 22.475 | 21.855 | 0.084 | 0.161 | 0.239 |
| mCad | 0.000 | 0.001 | 4.355 | 0.065 | 0.032 | 0.015 | 0.003 | 0.000 | 0.014 | 0.144 |
| mHb | −2.208 | 0.000 | 0.000 | - | −1.056 | −14.118 | −13.014 | 0.000 | −1.074 | −0.030 |
| mHb/Bcd | - | −0.002 | - | - | - | - | - | - | - | 18.667 |
| mHb/Cad | - | 0.001 | - | - | - | - | - | - | - | −21.125 |
| mBcd/Cad | - | 0.012 | - | - | - | - | - | - | - | 2.083 |
| - | - | - | 0.158 | - | - | - | - | - | - | |
| - | - | - | −0.001 | - | - | - | - | - | - | |
| EKr | - | - | - | - | - | - | −11.954 | - | - | - |
| EKni | - | - | - | - | - | - | 0.000 | - | - | - |
| ET11 | - | - | - | - | - | - | −0.027 | - | - | - |
| ha(*) | −25.000 | −25.000 | −25.000 | −10.211 | −7.313 | 3.613 | 13.565 | −3.823 | −1.592 | −20.913 |
| Ra(*) | 7.805 | 13.388 | 19.729 | 42.654 | 25.000 | 6.614 | 9.946 | 12.198 | 25.000 | 11.064 |
| 4.366 | 5.000 | 5.000 | 1.264 | 2.406 | 4.978 | 4.930 | 5.000 | 5.000 | 5.000 |
a represents Kr for circuits starting with ‘k’, kni for circuits starting with ‘n’, and gt for circuits starting with ‘g’. For the 3D modeling formalism, mb corresponds to mbc with b = c, such that mBcd corresponds to mBcd/Bcd in Equation (4) and so on. Protein half-lives are in minutes (min). For all circuits except g_post, signs of m parameters were constrained during optimization such that mBcd and mBcd ≥ 0, and mHb ≤ 0.
Saturated parameter values: Increasing the search space for Ra or ha neither significantly improves the RMS score of circuits with saturated parameters, nor results in significant differences in regulatory mechanism.
‘-’ represents parameters not used for a particular model. See text for parameter definitions.
There are two significant patterning defects in early kni gene circuits. First, there is low-level spurious expression of kni expression during cycles 11 and 12 (asterisks in Figure 7B, F). Second, the anterior boundary of the posterior kni domain is shifted posteriorly in model output compared to data (arrow in Figure 7J). Both of these defects are caused by an imbalance of Bcd activation and Hb repression. Strong activation by Bcd is required for setting the posterior boundary of posterior kni. This activation needs to be counterbalanced by strong Hb repression in the anterior part of the embryo, which leads to the slight posterior displacement of the anterior kni domain in the model.
3.3 Early gt Gene Circuits
Extensive exploration of parameter space—including optimization with constrained or unconstrained signs of regulatory parameters—failed to yield any gene circuits based on Equation (2) (GC models) which reproduce both domains of early gt expression correctly. All of these models have very high RMS scores (25.3) caused by displaced domain boundaries and severe leakage of gt expression between its anterior and posterior domains (Figure 8B, H, N). Graphical regulatory analysis reveals that this is caused by an imbalance between Hb repression and Bcd activation (Figure 8S). If Hb repression is too weak, the posterior gt domain expands anteriorly. In the anterior domain, however, strong Hb repression overwhelms activation by Bcd—especially during cycle 13 when Hb levels are rising (cf. Figure 8G, M, S). This cannot simply be compensated by increasing the strength of Bcd activation, since Bcd is responsible for positioning the posterior border of the anterior gt domain, so that increased activation by Bcd leads to posterior expansion of anterior gt expression.
Figure 8.
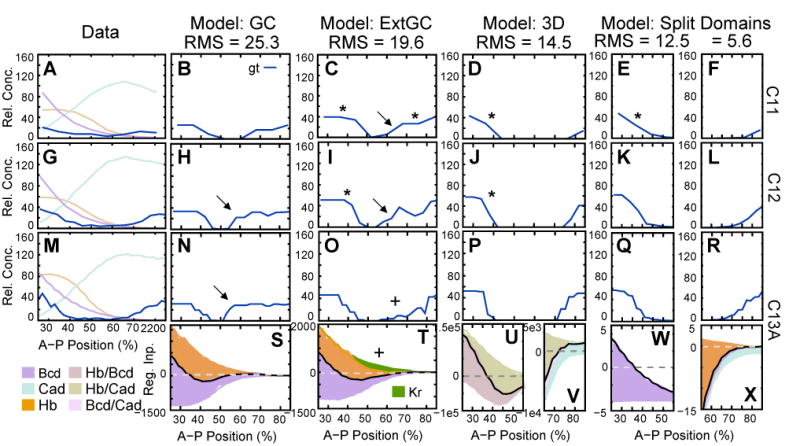
Gene circuit models for early gt expression. (A, G, M) Expression data for gt mRNA (blue), as well as Bcd (purple), Hb (beige) and Cad (turquoise) protein. Model output (B–F, H–L, N–R) and graphical regulatory analyses (S–X) are shown for an early gt circuit (B, H, N, S; model: GC; Equation (2)), for an extended early gt circuit including regulatory input from Kr (C, I, O, T; model: ExtGC; Equation (3)), for a gt circuit with context-dependent maternal regulatory matrix (D, J, P, U, V; model: 3D; Equation (4)), and for split-domain circuits for the anterior (E, K, Q, W) and the posterior (F, L, R, X) domain of gt (both based on Equation (2)). Expression and regulatory graphs are shown at cleavage cycle 11 (time class: C11; A–F), cycle 12 (C12; G–L), and early cycle 13 (C13A; M–X). Asterisks indicate premature expression, arrows indicate central gt leakage, crosses indicate reduced central leakage due to Kr repression. Axes, dashed lines and regulatory contributions as in Figure 7, except that colored areas in (U) and (V) represent strength of regulatory inputs as given by (Equation (4)). For example, represents the regulatory input of Hb in the presence of Cad (or vice versa).
Quantitative gap protein expression data (Poustelnikova et al., 2006) show that minute quantities of Kr protein may already be present in its central domain during cycle 12. We investigated whether this could prevent central gt leakage by including early Kr protein patterns as an external input in early gt gene circuits (eGC models; Equation (3)). Although RMS scores are somewhat lower (19.6) in these models, and central gt leakage is significantly reduced during cycle 13 (due to Kr repression; Figure 8O, T), there is no visible improvement of early gt expression during cycles 11 and 12 (Figure 8C, I).
The requirement for a delicate balance between Bcd activation and Hb repression leads to inconsistent regulatory mechanisms for the early anterior and posterior gt domains. This can only be overcome if Hb repression is locally excluded from the region of the anterior gt domain, which can be achieved in two alternative ways.
First, Hb repression can be neutralized anteriorly by a spatially specific co-regulator. We tested this possibility by using a modified gene circuit formalism with a context-dependent maternal regulatory matrix (3D circuits; Equation (4)). Using this formalism, we obtained gene circuits which reproduce both domains of gt correctly—with an RMS score of 14.5 (Figure 8D, J, P). In these models, regulatory input of Hb on gt depends on the presence of either Bcd or Cad. In combination with Bcd—in the anterior region of the embryo—Hb acts as an activator of gt (Figure 8U). In contrast, Hb acts as a strong repressor where Cad is present, which prevents gt expression in the central region of the embryo (Figure 8U, V). Finally, posterior gt expression is activated by Cad in the absence of Hb (Figure 8V).
Second, we obtained separate gene circuits (based on Equation (2)) for the anterior (g_ant) and the posterior (g_post) gt domains. These circuits cover the same spatial domain as other gene circuits presented here, but were fit to data which was set to zero either in the anterior (25% – 55% A–P position; g_post) or the posterior (55% – 85%; g_ant) half of the model's domain.
Such split early gt models have very low RMS scores of 12.5 for g_ant, and 5.6 for g_post (Figure 8E, F, K, L, Q, R). Graphical regulatory analysis shows that in these models, the anterior gt domain is regulated by Bcd activation in the absence of Hb repression (Figure 8W), while the posterior gt domain is activated by Cad, and its anterior border is set by strong Hb repression (Figure 8X).
3.4 Early Kr Gene Circuits
As is the case for gt, we failed to find any early gap gene circuits based on Equation (2) which reproduce early Kr expression correctly. All of these models show high RMS scores and lack either the anterior (RMS score: 27.7) or the posterior (30.7) boundary of Kr (Figure 9B, G, L; Figure 10B, C). Graphical regulatory analysis shows that this is either due to excessively strong activation by Bcd, which overwhelms Hb repression in the anterior (Figure 8P; Figure 10B), or activation by Cad (Figure 10C), which lacks a repressor counteracting it in the posterior region of the embryo. Almost identical results were obtained using extended early Kr circuits which include early protein expression of Gt, Kni and Tll as external regulatory inputs to Kr (cf. Equation (3)); eGC models; data not shown).
Figure 9.
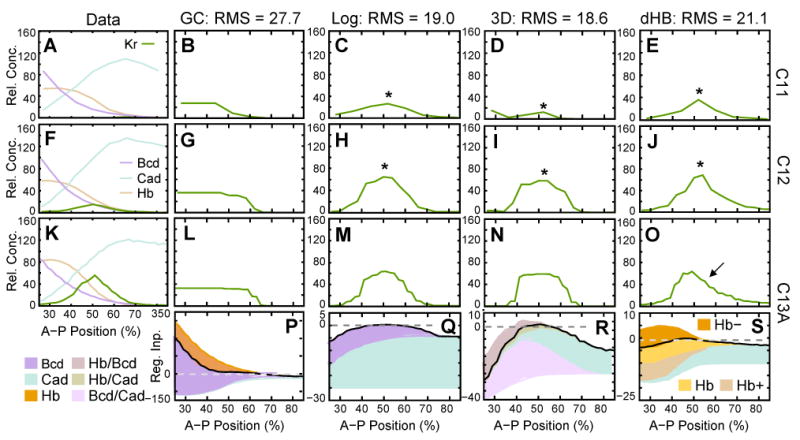
Gene circuit models for early Kr expression. (A, F, K) Expression data for Kr mRNA (green), as well as Bcd (purple), Hb (beige) and Cad (turquoise) protein. Model output (B–E, G–J, L–O) and graphical regulatory analyses (P–S) are shown for an early Kr circuit (B, G, L, P; model: GC; Equation (2)), for a Kr circuit with logarithmic dependence of regulatory contributions on regulator concentrations (C, H, M, Q; model: Log; Equation (6)), for a Kr circuit with context-dependent maternal regulatory matrix (D, I, N, R; model: 3D; Equation (4)), and for a Kr circuit with concentration-dependent activation/repression of Kr by Hb (E, J, O, S; model: dHB; Equation (5)). Expression and regulatory graphs are shown at cleavage cycle 11 (time class: C11; A–E), cycle 12 (C12; F–J), and early cycle 13 (C13A; K–S). Asterisks indicate premature expression, arrow indicates asymmetrical domain. Axes, dashed lines and regulatory contributions as in Figures 7 and 8, except for (S), where Hb+ (beige) corresponds to , Hb- (orange) to , and Hb (yellow) to the sum of Hb+ and Hb-, representing the net effect of combined Hb repression and activation.
Figure 10.
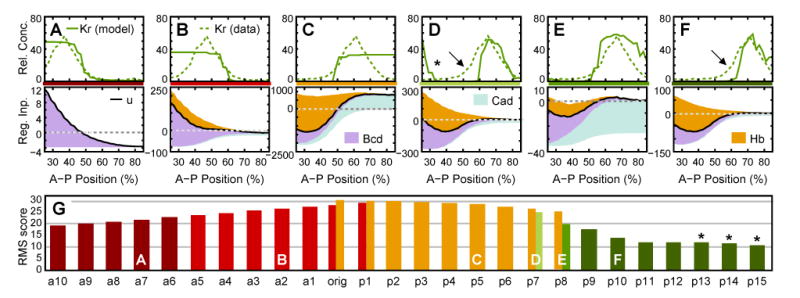
Spatial constraints for early gap domain boundaries. Early gene circuits (Equation (2)) were fit to Kr RNA expression data shifted anteriorly and posteriorly along the A–P axis. Expression data, model output and regulatory analyses are shown at early cycle 13 (time class: C13A) for all six different types of expression patterns and mechanisms observed (A–F). Asterisk indicates anterior leakage, arrows indicate displaced anterior boundary. Note that patterning defects and mechanism in (D) are very similar to those shown for kni in Figure 7. Axes and regulatory graphs as in Figures 7–9. (G) RMS scores and patterns/mechanisms (see color code in A–F) are shown for all Kr-like circuits. ‘an’ represents models fit to Kr data shifted anteriorly by n nuclei; ‘orig’ represents model fit to original Kr data; ‘pn’ represents models fit to data shifted posteriorly by n nuclei. If two bars are shown for the same data, different solutions were obtained in different optimization runs. Letters indicate positions of patterns/mechanisms shown in (A–F). Asterisks indicate lacking posterior boundary in data used for fitting.
We were able to obtain early Kr gene circuits which reproduce both boundaries of the central Kr domain using different modified modeling formalisms. In gene circuits with logarithmic dependence of regulatory contributions on regulator concentrations (Log circuits; Equation (6))—which have an RMS score of 19.0—the anterior border of Kr is set by Cad, and the posterior border is set by Bcd, while Hb shows no interaction with Kr (Figure 9C, H, M, Q). In gene circuits with a context-dependent maternal regulatory matrix (3D circuits; Equation (4))—with an RMS score of 18.6—we observe a similar mechanism of Kr regulation (Figure D, I, N, R). Both anterior and posterior borders of Kr are set through combined activation by Bcd and Cad. Auxiliary regulatory input for setting the anterior boundary is provided by Hb repression in combination with Bcd (Figure 9R).
Both of the above models have RMS scores which are far higher than those of comparable early gt or kni gene circuits. Although both borders of Kr are present, the dynamics of Kr expression are largely incorrect. In the expression data, the central Kr domain forms as a narrow central stripe in cycle 12 (Figure 9F). This stripe widens as it intensifies during cycle 13 (Figure 9K). Both models, on the other hand, show prematurely strong and wide Kr expression early on during cycle 12 (Figure 9H, I).
Gene circuits which allow for the postulated concentration-dependent regulatory effect of Hb on Kr (dHB circuits; Equation (5)) also show two borders of Kr. However, RMS scores (21.1) are even higher than for Log or 3D models due to asymmetry of the Kr domain during cycle 13 (arrow in Figure 9O), in addition to the severe patterning defects observed in the other two models (Figure 9E, J, O). Moreover, a concentration-dependent switch from Hb activation to repression—although explicitly allowed—does not occur in these models. Instead, Hb has a net activating effect, which sets the posterior boundary of Kr, while the anterior boundary is positioned by Cad activation (Figure 9S).
3.5 Spatial Constraints for Maternal Regulation of Gap Gene Domains
Our regulatory analysis of early gap gene circuits suggests that correct positioning of early gap domain boundaries relies crucially on a proper balance between Hb repression and activation by Bcd and/or Cad. In gene circuits based on Equation (2), such balance is only approximately achieved for kni, whereas no correct solutions could be obtained for Kr or gt (see above). This raises the question whether there are zones along the A–P axis in which gap-like domains can, and zones in which such domains cannot be positioned by the maternal gradients of Bcd, Hb and Cad.
The following numerical experiment was performed to address this question (cf. Reinitz et al., 1998). Early mRNA expression patterns of Kr were shifted anteriorly or posteriorly to obtain a series of artificial data sets by displacing the Kr domain to different positions along the A–P axis (Figure 10). These data sets were then used to fit early gene circuits based on Equation (2) (GC model).
A large majority of these models lacks either one of the domain boundaries present in the data (Figure 10A–C, G). Only Kr-shaped domains in the posterior region of the embryo (with boundaries lying within the region of 50%–85% A–P Position) yield gene circuit models that produce a gap-like domain with two boundaries (Figure 10D–F, G). Graphical regulatory analyses of shifted Kr-like circuits are shown in Figure 10A–F). Circuits which lack an anterior boundary consistently show strong activation by Bcd compared to relatively weak repression by Hb (Figure 10A, B). In contrast, circuits which lack a posterior boundary show excessively strong activation by Cad (Figure 10C). Hb repression increases as the Kr-like pattern shifts posteriorly and spatial overlap between maternal Hb and gap gene mRNA is reduced (compare Figure 10A, B to C–F). In all models with two domain boundaries the anterior boundary is set by Hb repression while the posterior boundary is set by Bcd activation (Figure 10D–F), similar to the regulatory mechanism observed in early kni gene circuits (see Figure 7).
4 Discussion
4.1 Establishment of Early Gap Gene Domains
The data set presented here extends previous qualitative studies of early gap gene expression by increasing accuracy and temporal resolution of embryo staging, and by enabling us to quantitate relative mRNA levels in both nuclei and cytoplasm. Gap gene mRNA is first detected in punctate nuclear patterns during cleavage cycles 11–12, and becomes increasingly more cytoplasmic during cycle 13. Only very low levels of Kr, kni and gt mRNA are present before cycle 13, while all of these genes show a rapid and massive increase in mRNA expression during cycle 13 (Figure 6A–O). Consistent with the idea that gap gene regulation can be divided into early maternal and late zygotic phases, none of the early gap domains show detectable anterior shifts in the position of their domain boundaries before late cycle 13, i. e. before the onset of gap-gap cross-regulatory interactions which are responsible for shifts in gap domain boundaries during cycle 14A (Jaeger et al., 2004b). Another new finding of this study concerns the timing of kni and gt expression. We were unable to detect any kni mRNA before mitosis 12, while expression of gt in both of its domains is initiated early compared to Kr and kni (Figure 6A–O). In contrast, previous reports had suggested that all of these gap genes initiate persistent transcription during cycle 12 (Knipple et al., 1985; Rothe et al., 1989; Mohler et al., 1989; Kraut and Levine, 1991b; Rothe et al., 1994; Pritchard and Schubiger, 1996).
It is possible that our fluorescent in situ hybridization method fails to detect low levels of kni mRNA signal before mitosis 12. However, even strongly enhanced images of embryos stained for kni during interphase 12 show only non-specific background—which is uniform across nuclei and cytoplasm (Figure 2X)—while we observe very clear and strong nuclear dots of kni transcription in mitosis 12 and early interphase of cycle 13—when overall kni expression levels are very low (Figure 2Y; Figure 4J, K, P, Q). Furthermore, we detect expression of Kr and gt at the same stage or earlier than reported in previous studies which used non-fluorescent hybridization protocols (Knipple et al., 1985; Mohler et al., 1989; Kraut and Levine, 1991b), suggesting that both staining methods achieve a comparable level of sensitivity.
Our data show low amounts of Kr expression in its anterior domain at late cycle 13 (Figure 3L, R), whereas earlier studies had not reported any expression in this domain before cycle 14A (Knipple et al., 1985; Harding and Levine, 1988). The presence of such early mRNA expression in the anterior Kr domain is unexpected, since the corresponding protein domain does not form until almost 30 min later—during mid cycle 14A (Poustelnikova et al., 2006). This delay is much larger than the 10–15 min between appearance of Kr mRNA and Kr protein in the central region of the embryo (Figure 3 and Poustelnikova et al., 2006) suggesting that translational regulation may be involved in establishing the anterior Kr protein domain.
4.2 Variability of Early Gap Gene Expression
As shown in Figure 6P–R, the variability in expression levels and boundary positions is very large for all early gap mRNA patterns. Boundaries of early Kr mRNA domains vary by as much as 10% embryo length between individual embryos within the same temporal class (compare Figure 3J, P with K, Q). This range of boundary positions is much larger than spatial variability observed for boundary positions of gap protein domains at any time during cycles 13 and 14A (Myasnikova et al., 2001; Houchmandzadeh et al., 2002; Spirov and Holloway, 2003).
High variability was also observed for the relative expression levels of the anterior, compared to the posterior early gt domain. In most embryos during cycles 12 and 13, the anterior gt domain shows higher levels of mRNA than the posterior domain (e. g.Figure 5K, L, Q, R). However, variability in expression levels is high and some embryos show almost indistinguishable levels of expression in both gt domains (Figure 5J, P). Such within-embryo variability cannot be caused by experimental error, since experimental conditions are uniform across each embryo, suggesting that the observed variability of early gap expression patterns is an intrinsic feature of the embryo.
Early gap gene domains also exhibit significant variability in timing of expression. Expression of gt appears to be initiated in different cleavage cycles (11 or 12) in different embryos (cf. Figure 5). Similarly, many embryos in cycle 12 show stronger Kr expression than embryos in early cycle 13 (data not shown). Similar temporal variability of early Kr and kni expression has been reported previously by Pritchard and Schubiger (1996).
Taken together, this confirms earlier evidence suggesting that initiation of transcription and establishment of early gap domain boundaries is a highly stochastic process, and that positional precision is only established later—during cleavage cycles 13 and 14A (cf. Pritchard and Schubiger, 1996; Houchmandzadeh et al., 2002; Spirov and Holloway, 2003).
4.3 Boundaries of gt and kni are Established by Maternal Gradients
We have used gene circuit models as tools for a detailed regulatory analysis of early gap gene regulation by the maternal gradients of Bcd, Hb and Cad. The results of our analysis are summarized in Figure 11A. In the remainder of the Discussion, we provide a detailed discussion of these results in light of published experimental evidence.
The establishment of several posterior gap domain boundaries depends on the Bcd gradient. The fact that Bcd binds to the hb regulatory region (Driever and Nüsslein-Volhard, 1989; Driever et al., 1989), and that expression of hb expands posteriorly as Bcd dosage is increased (Struhl et al., 1989) implies that the posterior boundary of the anterior domain of hb is established by Bcd activation. Our analysis suggests similar mechanisms for the establishment of the posterior boundaries of the anterior gt and the posterior kni domains. In the case of gt, this is consistent with the anterior gt domain being absent in embryos from bcd mutant mothers (Eldon and Pirrotta, 1991; Kraut and Levine, 1991b). In the case of kni, however, it is not clear whether this mechanism occurs in vivo for reasons outlined at the end of the following section.
Our analysis indicates that the anterior boundaries of the posterior domains of kni and gt are established through repression by maternal Hb. This is supported by the following evidence, kni expression expands anteriorly in hb mutants, but ectopic kni expression is weaker in zygotic hb mutants than in embryos mutant for both maternal and zygotic hb (Hülskamp et al., 1990). Moreover, the posterior kni and gt domains are absent in embryos with ubiquitous maternal Hb (Nauber et al., 1988; Rothe et al., 1989; Eldon and Pirrotta, 1991; Kraut and Levine, 1991b; Rothe et al., 1994), or in embryos overexpressing hb by a heat-shock promoter (Kraut and Levine, 1991a). Lastly, ectopic kni and gt expression in the anterior region of embryos lacking maternal Bcd and Hb is repressed in a dosage-dependent way by reintroducing increasing copy-numbers of maternal hb (Struhl et al., 1992; Schulz and Tautz, 1995).
4.4 Balance between Bcd Activation and Hb Repression
Our models show that proper balance between Bcd activation and Hb repression is crucial for correct early expression of gt and kni. In the case of gt, this balance cannot be achieved unless Hb repression is excluded from the region of the anterior gt domain where it otherwise overwhelms activation by Bcd (see Figure 8). This implies that the regulatory effect of Hb on early gt expression cannot be simply proportional to the Hb concentration profile at the early blastoderm stage.
Two additional factors could be in effect. First, there is evidence that the early anterior and posterior gt domains are regulated by different regulatory elements, implementing different regulatory mechanisms (Berman et al., 2002; Schroeder et al., 2004). Computational analyses have found a significant number of predicted Hb binding sites in the posterior element, while few such predicted sites were detected in the anterior one (Schroeder et al., 2004; Ochoa-Espinosa et al., 2005). Note, however, that it remains unclear how regulatory input from such separate regulatory elements is integrated into regulation of the intact, endogenous gene (cf. Reinitz et al., 2003; Buchler et al., 2003).
Alternatively, Hb regulatory activity could be modulated by the presence of Bcd in the anterior, and Cad in the central part of the presumptive germ-band region (cf. Figure 8D, J, P, U, V). A similar, context-dependent mechanism is involved in regulation of eve stripes two and three (see Fig. 7 in Reinitz et al., 1998), where Hb activates stripe two with Bcd as its co-activator, while it represses stripe three on its own (Stanojevic et al., 1989, 1991; Small et al., 1992, 1996).
Imbalance between Bcd activation and Hb repression also causes patterning defects in models for early kni expression (see Figure 7). This is due to the high level of Bcd activation required for setting the posterior boundary of the posterior kni domain which occurs in a region of extremely low Bcd concentration (Figure 7A, E, I). This mechanism is supported by a molecular study which identified a regulatory element of kni that responds to extremely low levels of Bcd in a concentration-dependent manner (Rivera-Pomar et al., 1995). However, the Bcd gradient is extremely shallow this far posterior in the embryo (Figure 11B, C, D). Moreover, in embryos from bcd mutant mothers, maternal Cad is sufficient to activate kni in a pattern which has a posterior boundary (Hülskamp et al., 1990; Rothe et al., 1994; Rivera-Pomar et al., 1995). Finally, kni expression expands all the way to the posterior pole in loss-of-function mutants of the terminal system (Rothe et al., 1994). Therefore, it is likely that the terminal system—instead of Bcd—is responsible for setting the posterior boundary of kni. Note that this boundary only forms shortly before the onset of cycle 13 (see Figure 4), a stage at which Tll protein becomes detectable in the posterior pole region of the blastoderm (Poustelnikova et al., 2006).
4.5 Early Kr Boundaries Require Additional Factors
In contrast to kni or gt, all gene circuit models of early Kr expression show severe patterning defects (see Figure 9). Moreover, those models which reproduce both Kr boundaries exhibit patterning mechanisms which are inconsistent with experimental evidence. Circuits based on the Log and 3D models require activation by both Cad and Bcd to position anterior and posterior Kr borders (Figure 9Q, R). However, Kr is expressed with both its boundaries present in embryos from bcd mutant mothers, and in embryos derived from germ-line clones lacking both maternal and zygotic Cad (Gaul and Jäckle, 1987; Olesnicky et al., 2006, and J.J. unpublished data). Moreover, the anterior border of Kr is positioned correctly in embryos overexpressing cad by a heat-shock promoter (Mlodzik et al., 1990). Similarly, circuits based on the dHB formalism exhibit a regulatory mechanism which requires activation of Kr by Hb for setting the posterior Kr boundary, but lack any repression of Kr by Hb (Figure 9S). This is incompatible with the fact that the central Kr domain expands anteriorly in maternal and zygotic hb mutants (Jäckle et al., 1986; Hülskamp et al., 1990), and that maternal Hb represses Kr in the anterior part of embryos with no or reduced activity of Bcd and the terminal system (Struhl et al., 1992; Schulz and Tautz, 1994).
Experimental evidence (Jäckle et al., 1986; Hülskamp et al., 1990) and previously published gap gene circuit models (Jaeger et al., 2004a; Perkins et al., 2006) suggest that the anterior border of Kr is set by Hb repression similar to the anterior boundaries of the posterior domains of kni and gt (see Figure 11A). However, our numerical experiments with early Kr gene circuits and shifted Kr-like patterns (see Figures 9 and 10) indicate that the required balance between Hb repression and Bcd activation—the latter being the only possible mechanism for setting the posterior Kr boundary in these models—cannot be achieved in the region of the central Kr domain. This is due to the rapid increase in Hb protein levels during cycles 12 and 13 in the region anterior of approximately 50% A–P position (Figure 11B, C, E), which overwhelms Bcd activation and prevents a stable balance between maternal activation and repression in that region. This precludes the formation of stationary gap domain boundaries in exactly the region where maternal gradient slopes are expected to be high enough to reliably convey positional information (Figure 11D, E).
In summary, the above results imply that given the gradients of Bcd, Hb and Cad as the only spatially specific maternal inputs, it is impossible to establish an early Kr mRNA domain without invoking regulatory mechanisms which contradict published experimental evidence on gap gene expression in maternal mutant backgrounds. It is important to note that to the best of our knowledge, all of this evidence is from embryos at late blastoderm stage—or cleavage cycle 14A. Therefore, it remains possible that early gap regulation is qualitatively different from regulation at later stages. This may be caused by regulatory mechanisms at the chromatin level which could allow or inhibit access to different sets of transcription factor binding sites in gap gene regulatory regions during early and late stages of regulation. Careful analyses of early gap gene expression patterns will be required to resolve this issue.
Obviously, our analysis depends crucially on the choice of models used. The gene circuit models presented here are not only highly generic but even in their most restrictive formulation they describe the later gap patterns more faithfully than other proposed models (Perkins et al., 2006). Of course, we cannot eliminate the possibility that some other mathematical formulation—incorporating potentially surprising regulatory effects caused by complex interactions among transcription factors or enhancer elements, for instance—could reproduce early gap gene expression correctly. However, it is difficult to see how such interactions could eliminate the necessity for spatially specific regulatory inputs based on the graded distributions of either activators or repressors. Since these regulator distributions change rapidly and significantly in the central region of the embryo in a way which is inconsistent with the establishment of a stable domain boundary (see Figure 11B, C, E), it seems unlikely that known maternal gradients of Bcd, Hb and Cad can provide sufficient positional information for correct initiation of localized Kr expression.
Given the caveats mentioned above, our results suggest that we are currently missing an important maternal regulator of early Kr expression. This factor could either consist of an additional activator, or a repressor counteracting Cad activation in the posterior region of the embryo. Such a regulator must act in a spatially specific way, since uniform regulatory effects would be captured by the threshold term ha in our models (see, for example, Equation (2)), and in any case could not account for positioning of a domain boundary. It could have been missed in saturation mutagenesis screens for maternal factors (see, for example, Schüpbach and Wieschaus, 1986; Nüsslein-Volhard et al., 1987), due to combined maternal and zygotic lethality of mutations in the factor in question, or due to the fact that incorrect initial positioning of Kr boundaries may be corrected at later stages leading to a non-lethal phenotype for such mutations. Alternatively, it is possible that the missing regulator is not a transcription factor at all. Posterior repression could be mediated by a microRNA, several of which are expressed in spatially specific patterns in the Drosophila blastoderm (Kosman et al., 2004; Biemar et al., 2005). Lastly, we cannot exclude the possibility that spatially inhomogeneous effects on gene expression could be mediated by entirely non-genetic factors, such as localized mechanical stress (Farge, 2003) or localized ionic potentials (see, for example, Webster and Goodwin, 1996).
A missing posterior regulator has also been proposed—based on theoretical evidence—to account for size regulation and precise positioning of the posterior border of the anterior hb domain (Houchmandzadeh et al., 2005; Howard and ten Wolde, 2005; McHale et al., 2006). The posterior gradient of this factor must be correlated with variability in Bcd expression (Houchmandzadeh et al., 2005) or interfere with activation of hb by Bcd through repression of Bcd activity (Howard and ten Wolde, 2005; McHale et al., 2006). No such specific requirements are necessary for the posterior regulator postulated here. Therefore, it remains unclear whether both regulation of early Kr and late hb expression could involve the same unknown regulator, or whether two distinct posterior signals are required to explain the observed phenomena.
As a final note, it must be pointed out that early gap gene regulation by maternal factors is at least partially redundant with later interactions involving zygotic gap-gap cross-regulation. For example, embryos from homozygous hb mutant mothers can be rescued by a single copy of paternal zygotic hb (Lehmann and Nüsslein-Volhard, 1987; Hülskamp et al., 1989; Irish et al., 1989; Struhl, 1989; Simpson-Brose et al., 1994). This—together with the observed reduction in variability of gene expression over time—strongly suggests considerable error-correcting capabilities of the gap gene system.
5 Experimental Procedures
5.1 Data Acquisition and Processing
Gap gene mRNA was fluorescently labeled by in situ hybridization using slightly modified standard protocols (Hughes and Krause, 1998; Wu et al., 2001; Kosman et al., 2004). Wild-type (OregonR) embryos were collected at 0–3 hrs AED. Fixed embryos were hybridized using fluorescein-labeled riboprobes (made from full-length cDNA) against Kr, kni or gt (Tsai and Gergen, 1994). Embryos were permeabilized using acetone (Nagaso et al., 2001). After hybridization, gap gene mRNA was visualized by incubation with rabbit anti-fluorescein antibody, followed by secondary anti-rabbit antibody labeled with Alexa Fluor 647. Nuclei were visualized using PicoGreen nuclear dye.
Laterally oriented embryos were scanned using confocal microscopy as described in Janssens et al. (2005). Only one optical section was scanned to minimize processing time. Embryo images were cropped and aligned using whole-embryo masks (Figure 2D, P; Janssens et al., 2005). Image segmentation was performed as described in Janssens et al. (2005) with the following exceptions: Gap gene mRNA shows complex and dynamic subcellular localization in both nuclei and cytoplasm (Figure 2A–C). mRNA concentrations in nuclei and their surrounding cytoplasm were quantified using different segmentation masks created from gray-scale images of PicoGreen staining (Figure 2F, R). For embryos in cycles 12 and 13, watershed and nuclear masks (Figure 2S, U) were created as described in Janssens et al. (2005). Cytoplasmic masks were obtained by subtracting nuclear masks from watershed masks (Figure 2T). In contrast, watershed segmentation is problematic for embryos in cleavage cycles 10 and 11 because it tends to create artifactual watershed domains between widely spaced nuclei. Since fusion of segmentation subdomains is rarely a problem in early masks, simple threshold-based nuclear masks were obtained for these embryos (Figure 2I). Threshold values were chosen interactively to ensure that all nuclei are captured by the mask. Masks covering both nuclei and surrounding cytoplasm were obtained by dilation of nuclear masks (Figure 2G). The number of dilations is chosen interactively to ensure a minimum number of fused subdomains. Finally, cytoplasmic masks were obtained by subtracting nuclear masks from masks covering nuclei and cytoplasm as described for cycle 12 and 13 embryos above (Figure 2H).
Embryo images are assigned to specific cleavage cycles between cycle 10 and cycle 13 (C10–C13) based on the number of nuclei present in the segmented data. Embryos undergoing mitosis were used for the descriptive study of expression patterns (see Figures 3–5), but were excluded from the integrated data set used for model fitting (Figure 6). Subdivision of cycle 13 into two separate time classes (C13A/C13B) is based on careful visual inspection of morphological markers and gap gene expression dynamics at the mRNA level. Note that none of these criteria on its own proved sufficiently reliable and a combination of criteria had to be used for accurate classification. Kr, kni and gt show a strong and rapid increase in their mRNA levels during cycle 13 (compare Figure 2J and L, see also Figure 6). Thus, expression levels can be used as a criterion for time classification under the assumption that lower expression levels precede higher ones. However, large variability in timing of expression between embryos may lead to inaccurate classification.
Therefore, two morphological features were used as additional classification criteria. First, changes in nuclear spacing and shape can be observed during cycle 13. Embryos in early cycle 13 show widely spaced, rounded nuclei which are somewhat flattened (Figure 2K, V). In contrast, embryos at late cycle 13 show more densely packed nuclei with somewhat square shapes when viewed along the basal-apical axis (Figure 2M, W). Second, the yolk-free zone of cytoplasm at the periphery of the embryo—called the cortical cytoplasm—widens perceptibly during cycle 13 (Figure 2N, V, W; see also Foe and Alberts, 1983). This marker is not very reliable for two reasons: First, the boundary between cortical and yolk-containing cytoplasm is not very regular and sometimes ill-defined, since yolk granule density decreases rather gradually into the cortical zone (Figure 2V,W). Still, independent control measurements suggest that fairly reliable measurement is possible (Figure 2O). Second, variability in the width of the cortical cytoplasm itself is large, especially between fixed and live embryos (compare Figure 2N with V and W). For these reasons, this criterion was only used for additional staging information in case expression patterns and nuclear morphology/shape were inconclusive.
Non-specific background staining was removed as described in Myasnikova et al. (2005). This method can be applied to early gap mRNA patterns since they closely resemble gap proteins patterns at early cycle 14A (see Myasnikova et al., 2005). For unknown reasons, most C10 and C11 embryos stained for kni or gt showed extremely high levels of background causing the background-removal procedure to fail. These embryos had to be excluded from the integrated data set (see Table 1 and Figure 6).
Expression patterns from all embryos stained for a specific gap gene and belonging to a specific time class were then averaged to yield an integrated expression pattern. For data averaging, 7 (C10), 13 (C11), 25 (C12), and 50 (C13A/B) equal-sized bins were denned along the A–P axis. Bin numbers were chosen based on the fact that in embryos at cleavage cycle 14A, approximately 100 nuclei span the entire length of the A–P axis (Foe and Alberts, 1983). Expression data from the middle 10% along the D–V axis were assigned to bins according to the x-coordinate of their centroids. Concentration values for nuclei in each bin were then averaged for each gene in each time class to yield integrated one-dimensional expression patterns. Numbers of embryos used for both the descriptive study and the integrated data set for fitting of early gap gene circuits are summarized in Table 1.
5.2 Numerical Solution and Optimization of Models
Initial conditions and external maternal inputs for gap gene regulation are calculated by linearly interpolating integrated protein expression patterns for Bcd, Cad and Hb taken from the FlyEx data base (Myasnikova et al., 2001; Poustelnikova et al., 2004, 2006). ODEs were solved numerically using a Bulirsch-Stoer adaptive step-size method (Press et al., 1992). Solutions were tested for numerical stability by solving them at different levels of accuracy.
The cost function for our optimization problem is given by the sum of squared differences
| (7) |
where is the concentration of the product of gene a in nucleus i for time class t obtained by numerical integration of the model, while is the corresponding concentration value in the data. Summation is performed over the total number of data points Nd, i. e. the number of protein measurements across all genes a, nuclei i and time classes t for which we have data. Each of the data sets used for optimization of early gap gene circuits contains Nd = 86 data points. Note that we use the root-mean-square (RMS) score
| (8) |
as a measure for the quality of a gene circuit. In contrast to the cost function E, the RMS score is independent of Nd and represents the average absolute difference between protein concentrations in data and model output.
Epenalty is a penalty term used for search space control, given by
| (9) |
where each Пi term represents a function which is zero for parameter values within, and infinite for values outside of each parameter's search space limits. Initial search spaces were established based on previous experience with gap gene circuits (Jaeger et al., 2004a). Search spaces were enlarged whenever optimization yielded model solutions which did not correctly reproduce expression data, or whenever parameter values were saturated close to a search space limit, until optimization solutions did not improve significantly anymore.
We minimize cost function E by using a global optimization method called Lam simulated annealing (LSA; see Figure 1; Kirkpatrick et al., 1983; Lam and Delosme, 1988a,b; Reinitz and Sharp, 1995). LSA is a heuristic method that has been very effective in obtaining solutions for much larger gene circuit problems than those considered here (Reinitz and Sharp, 1995; Jaeger et al., 2004a). It is computationally very intensive, but yields better solutions than other optimization strategies on this kind of problem (J. R. unpublished data and Perkins et al., 2006). LSA optimization runs took approximately 2–12 hrs each on single 3.0Ghz Pentium P4 Xeon processors. Five independent optimization runs were performed for each model presented above. Unless noted otherwise, different solutions for the same model and parameter search space show RMS scores and parameter values which are identical up to at least the third decimal digit. Estimated values for gene circuit parameters used in this study are summarized in Table 2.
5.3 Online Resources
Expression data and early gap gene circuit models are available for download at: http://flyex.ams.sunysb.edu/lab/gaps.html. Source code for model and optimization code is available from the authors upon request.
Acknowledgments
J. P. Gergen kindly provided DNA constructs for making gap gene riboprobes. We would like to thank Manu for interpolation code and assistance with numerical solvers, H. Janssens and C. E. Vanario-Alonso for crucial help with embryo stainings and confocal microscopy, as well as S. Surkova, K.N. Kozlov, E. Myasnikova and M. Samsonova for help with data processing methods and code. This work was supported financially by the National Institutes of Health, Grant RR07801.
Footnotes
Publisher's Disclaimer: This is a PDF file of an unedited manuscript that has been accepted for publication. As a service to our customers we are providing this early version of the manuscript. The manuscript will undergo copyediting, typesetting, and review of the resulting proof before it is published in its final citable form. Please note that during the production process errors may be discovered which could affect the content, and all legal disclaimers that apply to the journal pertain.
References
- Akam M. The molecular basis for metameric pattern in the Drosophila embryo. Development. 1987;101:1–22. [PubMed] [Google Scholar]
- Berleth T, Burri M, Thoma G, Bopp D, Richstein S, Frigerio G, Noll M, Nüsslein-Volhard C. The role of localization of bicoid RNA in organizing the anterior pattern of the Drosophila embryo. The EMBO Journal. 1988;7:1749–1756. doi: 10.1002/j.1460-2075.1988.tb03004.x. [DOI] [PMC free article] [PubMed] [Google Scholar]
- Berman BP, Nibu Y, Pfeiffer BD, Tomancak P, Celniker SE, Levine M, Rubin GM, Eisen MB. Exploiting transcription factor binding site clustering to identify cis-regulatory modules involved in pattern formation in the Drosophila genome. Proceedings of the National Academy of Sciences USA. 2002;99:757–762. doi: 10.1073/pnas.231608898. [DOI] [PMC free article] [PubMed] [Google Scholar]
- Biemar F, Zinzen R, Ronshaugen M, Sementchenko V, Manak JR, Levine MS. Spatial regulation of microRNA gene expression in the Drosophila embryo. Proceedings of the National Academy of Sciences USA. 2005;102:15907–15911. doi: 10.1073/pnas.0507817102. [DOI] [PMC free article] [PubMed] [Google Scholar]
- Boring L, Weir M, Schubiger G. Egg ligation alters the bcd protein gradient and segmentation gene expression in embryo of Drosophila. Mechanisms of Development. 1993;42:97–111. doi: 10.1016/0925-4773(93)90102-4. [DOI] [PubMed] [Google Scholar]
- Brönner G, Jäckle H. Control and function of terminal gap gene activity in the posterior pole region of the Drosophila embryo. Mechanisms of Development. 1991;35:205–211. doi: 10.1016/0925-4773(91)90019-3. [DOI] [PubMed] [Google Scholar]
- Buchler NE, Gerland U, Hwa T. On schemes of combinatorial transcription logic. Proceedings of the National Academy of Sciences USA. 2003;100:5136–5141. doi: 10.1073/pnas.0930314100. [DOI] [PMC free article] [PubMed] [Google Scholar]
- Driever W, Nüsslein-Volhard C. The Bicoid protein determines position in the Drosophila embryo in a concentration-dependent manner. Cell. 1988a;54:95–104. doi: 10.1016/0092-8674(88)90183-3. [DOI] [PubMed] [Google Scholar]
- Driever W, Nüsslein-Volhard C. A gradient of Bicoid protein in Drosophila embryos. Cell. 1988b;54:83–93. doi: 10.1016/0092-8674(88)90182-1. [DOI] [PubMed] [Google Scholar]
- Driever W, Nüsslein-Volhard C. The Bicoid protein is a positive regulator of hunchback transcription in the early Drosophila embryo. Nature. 1989;337:138–143. doi: 10.1038/337138a0. [DOI] [PubMed] [Google Scholar]
- Driever W, Thoma G, Nüsslein-Volhard C. Determination of spatial domains of zygotic gene expression in the Drosophila embryo by the affinity of binding sites for the Bicoid morphogen. Nature. 1989;340:363–367. doi: 10.1038/340363a0. [DOI] [PubMed] [Google Scholar]
- Dubnau J, Struhl G. RNA recognition and translational regulation by a homeodomain protein. Nature. 1996;379:694–649. doi: 10.1038/379694a0. [DOI] [PubMed] [Google Scholar]
- Edgar BA, Odell GM, Schubiger G. A genetic switch, based on negative regulation, sharpens stripes in Drosophila embryos. Developmental Genetics. 1989;10:124–142. doi: 10.1002/dvg.1020100303. [DOI] [PubMed] [Google Scholar]
- Edgar BA, Schubiger G. Parameters controlling transcriptional activation during early Drosophila development. Cell. 1986;44:871–877. doi: 10.1016/0092-8674(86)90009-7. [DOI] [PubMed] [Google Scholar]
- Eldon ED, Pirrotta V. Interactions of the Drosophila gap gene giant with maternal and zygotic pattern-forming genes. Development. 1991;111:367–378. doi: 10.1242/dev.111.2.367. [DOI] [PubMed] [Google Scholar]
- Farge E. Mechanical induction of twist in the Drosophila foregut/stomodeal primordium. Current Biology. 2003;13:1365–1377. doi: 10.1016/s0960-9822(03)00576-1. [DOI] [PubMed] [Google Scholar]
- Foe VE. Mitotic domains reveal early commitment of cells in Drosophila embryos. Development. 1989;107:1–25. [PubMed] [Google Scholar]
- Foe VE, Alberts BM. Studies of nuclear and cytoplasmic behaviour during the five mitotic cycles that precede gastrulation in Drosophila embryogenesis. The Journal of Cell Science. 1983;61:31–70. doi: 10.1242/jcs.61.1.31. [DOI] [PubMed] [Google Scholar]
- Frigerio G, Burri M, Bopp D, Baumgartner S, Noll M. Structure of the segmentation gene paired and the Drosophila PRD gene set as part of a gene network. Cell. 1986;47:735–746. doi: 10.1016/0092-8674(86)90516-7. [DOI] [PubMed] [Google Scholar]
- Furriols M, Casanova J. In and out of torso RTK signaling. The EMBO Journal. 2003;22:1947–1952. doi: 10.1093/emboj/cdg224. [DOI] [PMC free article] [PubMed] [Google Scholar]
- Gao Q, Finkelstein R. Targeting gene expression to the head: the Drosophila orthodenticle gene is a direct target of the bicoid morphogen. Development. 1998;125:4185–4193. doi: 10.1242/dev.125.21.4185. [DOI] [PubMed] [Google Scholar]
- Gaul U, Jäckle H. Pole region-dependent repression of the Drosophila gap gene Krüppel by maternal gene products. Cell. 1987;51:549–555. doi: 10.1016/0092-8674(87)90124-3. [DOI] [PubMed] [Google Scholar]
- Harding K, Levine M. Gap genes define the limits of antennapedia and bithorax gene expression during early development in Drosophila. The EMBO Journal. 1988;7:205–214. doi: 10.1002/j.1460-2075.1988.tb02801.x. [DOI] [PMC free article] [PubMed] [Google Scholar]
- Hill TL. Cooperativity Theory in Biochemistry: Steady-State and Equilibrium Systems. Springer-Verlag; 1985. [Google Scholar]
- Houchmandzadeh B, Wieschaus E, Leibler S. Establishment of developmental precision and proportions in the early Drosophila embryo. Nature. 2002;415:798–802. doi: 10.1038/415798a. [DOI] [PubMed] [Google Scholar]
- Houchmandzadeh B, Wieschaus E, Leibler S. Precise domain specification in the developing Drosophila embryo. Physical Review E. 2005;72 doi: 10.1103/PhysRevE.72.061920. 061920. [DOI] [PubMed] [Google Scholar]
- Howard M, ten Wolde PR. Finding the center reliably: Robust patterns of developmental gene expression. Physical Review Letters. 2005;95 doi: 10.1103/PhysRevLett.95.208103. 208103. [DOI] [PubMed] [Google Scholar]
- Hughes SC, Krause HM. Single and double FISH protocols for Drosophila. In: Paddock SW, editor. Confocal Microscopy Methods and Protocols. Vol 122 of Methods in Molecular Biology. Humana Press; Totowa, NJ: 1998. pp. 93–101. [DOI] [PubMed] [Google Scholar]
- Hülskamp M, Pfeifle C, Tautz D. A morphogenetic gradient of Hunchback protein organizes the expression of the gap genes Krüppel and knirps in the early Drosophila embryo. Nature. 1990;346:577–580. doi: 10.1038/346577a0. [DOI] [PubMed] [Google Scholar]
- Hülskamp M, Schröder C, Pfeifle C, Jäckle H, Tautz D. Posterior segmentation of the Drosophila embryo in the absence of a maternal posterior organizer gene. Nature. 1989;338:629–632. doi: 10.1038/338629a0. [DOI] [PubMed] [Google Scholar]
- Ingham PW. The molecular genetics of embryonic pattern formation in Drosophila. Nature. 1988;335:25–34. doi: 10.1038/335025a0. [DOI] [PubMed] [Google Scholar]
- Irish V, Lehmann R, Akam M. The Drosophila posterior-group gene nanos functions by repressing hunchback activity. Nature. 1989;338:646–648. doi: 10.1038/338646a0. [DOI] [PubMed] [Google Scholar]
- Jäckle H, Tautz D, Schuh R, Seifert E, Lehmann R. Cross-regulatory interactions among the gap genes of Drosophila. Nature. 1986;324:668–670. [Google Scholar]
- Jaeger J, Blagov M, Kosman D, Kozlov KN, Manu, Myasnikova E, Surkova S, Vanario-Alonso CE, Samsonova M, Sharp DH, Reinitz J. Dynamical analysis of regulatory interactions in the gap gene system of Drosophila melanogaster. Genetics. 2004a;167:1721–1737. doi: 10.1534/genetics.104.027334. [DOI] [PMC free article] [PubMed] [Google Scholar]
- Jaeger J, Surkova S, Blagov M, Janssens H, Kosman D, Kozlov KN, Manu, Myasnikova E, Vanario-Alonso CE, Samsonova M, Sharp DH, Reinitz J. Dynamic control of positional information in the early Drosophila embryo. Nature. 2004b;430:368–371. doi: 10.1038/nature02678. [DOI] [PubMed] [Google Scholar]
- Janssens H, Kosman D, Vanario-Alonso CE, Jaeger J, Samsonova M, Reinitz J. A high-throughput method for quantifying gene expression data from early Drosophila embryos. Development, Genes and Evolution. 2005;215:374–381. doi: 10.1007/s00427-005-0484-y. [DOI] [PubMed] [Google Scholar]
- Johnston DS, Nüsslein-Volhard C. The origin of pattern and polarity in the Drosophila embryo. Cell. 1992;68:201–219. doi: 10.1016/0092-8674(92)90466-p. [DOI] [PubMed] [Google Scholar]
- Kirkpatrick S, Gelatt CD, Vecchi MP. Optimization by simulated annealing. Science. 1983;220:671–680. doi: 10.1126/science.220.4598.671. [DOI] [PubMed] [Google Scholar]
- Knipple DC, Seifert E, Rosenberg UB, Preiss A, Jäckle H. Spatial and temporal patterns of Krüppel gene expression in early Drosophila embryos. Nature. 1985;317:40–44. doi: 10.1038/317040a0. [DOI] [PubMed] [Google Scholar]
- Kosman D, Mizutani CM, Lemons D, Cox WG, McGinnis W, Bier E. Multiplex detection of RNA expression in Drosophila embryos. Science. 2004;305:846. doi: 10.1126/science.1099247. [DOI] [PubMed] [Google Scholar]
- Kraut R, Levine M. Mutually repressive interactions between the gap genes giant and Krüppel define middle body regions of the Drosophila embryo. Development. 1991a;111:611–621. doi: 10.1242/dev.111.2.611. [DOI] [PubMed] [Google Scholar]
- Kraut R, Levine M. Spatial regulation of the gap gene giant during Drosophila development. Development. 1991b;111:601–609. doi: 10.1242/dev.111.2.601. [DOI] [PubMed] [Google Scholar]
- Lam J, Delosme JM. Tech Rep 8816. Yale Electrical Engineering Department; New Haven, CT: Sep, 1988a. An efficient simulated annealing schedule: Derivation. [Google Scholar]
- Lam J, Delosme JM. Tech Rep 8817. Yale Electrical Engineering Department; New Haven, CT: Sep, 1988b. An efficient simulated annealing schedule: Implementation and evaluation. [Google Scholar]
- Lehmann R, Nüsslein-Volhard C. hunchback, a gene required for segmentation of an anterior and posterior region of the Drosophila embryo. Developmental Biology. 1987;119:402–417. doi: 10.1016/0012-1606(87)90045-5. [DOI] [PubMed] [Google Scholar]
- Macdonald PM, Struhl G. A molecular gradient in early Drosophila embryos and its role in specifying the body pattern. Nature. 1986;324:537–545. doi: 10.1038/324537a0. [DOI] [PubMed] [Google Scholar]
- McHale P, Rappel WJ, Levine H. Embryonic pattern scaling achieved by oppositely directed morphogen gradients. Physical Biology. 2006;3:107–120. doi: 10.1088/1478-3975/3/2/003. [DOI] [PubMed] [Google Scholar]
- Mjolsness E, Sharp DH, Reinitz J. A connectionist model of development. The Journal of Theoretical Biology. 1991;152:429–453. doi: 10.1016/s0022-5193(05)80391-1. [DOI] [PubMed] [Google Scholar]
- Mlodzik M, Fjose A, Gehring WJ. Isolation of caudal, a Drosophila homeo box- containing gene with maternal expression, whose transcripts form a concentration gradient at pre-blastoderm stage. The EMBO Journal. 1985;4:2961–2969. doi: 10.1002/j.1460-2075.1985.tb04030.x. [DOI] [PMC free article] [PubMed] [Google Scholar]
- Mlodzik M, Gibson G, Gehring WJ. Effects of ectopic expression of caudal during Drosophila development. Development. 1990;109:271–277. doi: 10.1242/dev.109.2.271. [DOI] [PubMed] [Google Scholar]
- Mohler J, Eldon ED, Pirrotta V. A novel spatial transcription pattern associated with the segmentation gene, giant, of Drosophila. The EMBO Journal. 1989;8:1539–1548. doi: 10.1002/j.1460-2075.1989.tb03538.x. [DOI] [PMC free article] [PubMed] [Google Scholar]
- Murata Y, Wharton RP. Binding of Pumilio to maternal hunchback mRNA is required for posterior patterning in Drosophila embryos. Cell. 1995;80:747–756. doi: 10.1016/0092-8674(95)90353-4. [DOI] [PubMed] [Google Scholar]
- Myasnikova E, Samsonova A, Kozlov K, Samsonova M, Reinitz J. Registration of the expression patterns of Drosophila segmentation genes by two independent methods. Bioinformatics. 2001;17:3–12. doi: 10.1093/bioinformatics/17.1.3. [DOI] [PubMed] [Google Scholar]
- Myasnikova E, Samsonova M, Kosman D, Reinitz J. Removal of background signal from in situ data on the expression of segmentation genes in Drosophila. Development, Genes and Evolution. 2005 doi: 10.1007/s00427-005-0472-2. In Print. [DOI] [PubMed] [Google Scholar]
- Nagaso H, Murata T, Day N, Yokoyama KK. Simultaneous detection of RNA and protein by in situ hybridization and immunological staining. The Journal of Histochemistry and Cytochemistry. 2001;49:1177–1182. doi: 10.1177/002215540104900911. [DOI] [PubMed] [Google Scholar]
- Nauber U, Pankratz MJ, Kienlin A, Seifert E, Klemm U, Jäckle H. Abdominal segmentation of the Drosophila embryo requires a hormone receptor-like protein encoded by the gap gene knirps. Nature. 1988;336:489–492. doi: 10.1038/336489a0. [DOI] [PubMed] [Google Scholar]
- Nüsslein-Volhard C, Frohnhofer HG, Lehmann R. Determination of anteroposterior polarity in Drosophila. Science. 1987;238:1675–1687. doi: 10.1126/science.3686007. [DOI] [PubMed] [Google Scholar]
- Nüsslein-Volhard C, Wieschaus E. Mutations affecting segment number and polarity in Drosophila. Nature. 1980;287:795–801. doi: 10.1038/287795a0. [DOI] [PubMed] [Google Scholar]
- Ochoa-Espinosa A, Yucel G, Kaplan L, Pare A, Pura N, Oberstein A, Papatsenko D, Small S. The role of binding site cluster strength in Bicoid-dependent patterning in Drosophila. Proceedings of the National Academy of Sciences USA. 2005;102:4960–4965. doi: 10.1073/pnas.0500373102. [DOI] [PMC free article] [PubMed] [Google Scholar]
- Olesnicky EC, Brent AE, Tonnes L, Walker M, Pultz MA, Leaf D, Desplan C. A caudal mRNA gradient controls posterior development in the wasp Nasonia. Development. 2006;133:3973–3982. doi: 10.1242/dev.02576. [DOI] [PubMed] [Google Scholar]
- Perkins TJ, Jaeger J, Reinitz J, Glass L. Reverse engineering the gap gene network. PLoS Computational Biology. 2006;2:e51. doi: 10.1371/journal.pcbi.0020051. [DOI] [PMC free article] [PubMed] [Google Scholar]
- Pignoni F, Baldarelli RM, Steingrimsson E, Diaz RJ, Patapoutian A, Merriam JR, Lengyel JA. The Drosophila gene tailless is expressed at the embryonic termini and is a member of the steroid receptor superfamily. Cell. 1990;62:151–163. doi: 10.1016/0092-8674(90)90249-e. [DOI] [PubMed] [Google Scholar]
- Poustelnikova E, Pisarev A, Blagov M, Samsonova M, Reinitz J. A database for management of gene expression data in situ. Bioinformatics. 2004;20:2212–2221. doi: 10.1093/bioinformatics/bth222. [DOI] [PubMed] [Google Scholar]
- Poustelnikova E, Pisarev A, Blagov M, Samsonova M, Reinitz J. FlyEx database. 2006 http://urchin.spbcas.ru/flyex.
- Press WH, Teukolsky SA, Vetterling WT, Flannery BP. Numerical Tecipes in C. 2. Cambridge University Press; Cambridge, UK: 1992. [Google Scholar]
- Pritchard DK, Schubiger G. Activation of transcription in Drosophila embryos is a gradual process mediated by the nucleocytoplasmic ratio. Genes and Development. 1996;10:1131–1142. doi: 10.1101/gad.10.9.1131. [DOI] [PubMed] [Google Scholar]
- Reinitz J, Hou S, Sharp DH. Transcriptional control in Drosophila. ComPlexUs. 2003;1:54–64. [Google Scholar]
- Reinitz J, Kosman D, Vanario-Alonso CE, Sharp DH. Stripe forming architecture of the gap gene system. Developmental Genetics. 1998;23:11–27. doi: 10.1002/(SICI)1520-6408(1998)23:1<11::AID-DVG2>3.0.CO;2-9. [DOI] [PubMed] [Google Scholar]
- Reinitz J, Mjolsness E, Sharp DH. Cooperative control of positional information in Drosophila by bicoid and maternal hunchback. The Journal of Experimental Zoology. 1995;271:47–56. doi: 10.1002/jez.1402710106. [DOI] [PubMed] [Google Scholar]
- Reinitz J, Sharp DH. Mechanism of eve stripe formation. Mechanisms of Development. 1995;49:133–158. doi: 10.1016/0925-4773(94)00310-j. [DOI] [PubMed] [Google Scholar]
- Reinitz J, Sharp DH. Gene Circuits and Their Uses. In: Collado J, Magasanik B, Smith T, editors. Integrative Approaches to Molecular Biology. Ch. 13. MIT Press; Cambridge, Massachusetts, USA: 1996. pp. 253–272. [Google Scholar]
- Rivera-Pomar R, Lu X, Perrimon N, Taubert H, Jäckle H. Activation of posterior gap gene expression in the Drosophila blastoderm. Nature. 1995;376:253–256. doi: 10.1038/376253a0. [DOI] [PubMed] [Google Scholar]
- Rivera-Pomar R, Niessing D, Schmidt-Ott U, Gehring WJ, Jäckle H. RNA binding and translational suppression by Bicoid. Nature. 1996;379:746–749. doi: 10.1038/379746a0. [DOI] [PubMed] [Google Scholar]
- Rothe M, Nauber U, Jäckle H. Three hormone receptor-like Drosophila genes encode an identical DNA-binding finger. The EMBO Journal. 1989;8:3087–3094. doi: 10.1002/j.1460-2075.1989.tb08460.x. [DOI] [PMC free article] [PubMed] [Google Scholar]
- Rothe M, Wimmer EA, Pankratz MJ, González-Gaitán M, Jäckle H. Identical transacting factor requirement for knirps and knirps-related gene expression in the anterior but not in the posterior region of the Drosophila embryo. Mechanisms of Development. 1994;46:169–181. doi: 10.1016/0925-4773(94)90069-8. [DOI] [PubMed] [Google Scholar]
- Schroeder MD, Pearce M, Fak J, Fan HQ, Unnerstall U, Emberly E, Rajewsky N, Siggia ED, Gaul U. Transcriptional control in the segmentation gene network of Drosophila. PLoS Biology. 2004;2:e271. doi: 10.1371/journal.pbio.0020271. [DOI] [PMC free article] [PubMed] [Google Scholar]
- Schulz C, Tautz D. Autonomous concentration-dependent activation and repression of Krüppel by hunchback in the Drosophila embryo. Development. 1994;120:3043–3049. doi: 10.1242/dev.120.10.3043. [DOI] [PubMed] [Google Scholar]
- Schulz C, Tautz D. Zygotic caudal regulation by hunchback and its role in abdominal segment formation of the Drosophila embryo. Development. 1995;121:1023–1028. doi: 10.1242/dev.121.4.1023. [DOI] [PubMed] [Google Scholar]
- Schüpbach T, Wieschaus E. Maternal effect mutations altering the anterior-posterior pattern of the Drosophila embryo. Roux Archives of Developmental Biology. 1986;195:302–317. doi: 10.1007/BF00376063. [DOI] [PubMed] [Google Scholar]
- Simcox AA, Sang JH. When does determination occur in Drosophila embryos? Developmental Biology. 1983;97:212–221. doi: 10.1016/0012-1606(83)90078-7. [DOI] [PubMed] [Google Scholar]
- Simpson-Brose M, Treisman J, Desplan C. Synergy between the Hunchback and Bicoid morphogens is required for anterior patterning in Drosophila. Cell. 1994;78:855–865. doi: 10.1016/s0092-8674(94)90622-x. [DOI] [PubMed] [Google Scholar]
- Small S, Blair A, Levine M. Regulation of even-skipped stripe 2 in the Drosophila embryo. The EMBO Journal. 1992;11:4047–4057. doi: 10.1002/j.1460-2075.1992.tb05498.x. [DOI] [PMC free article] [PubMed] [Google Scholar]
- Small S, Blair A, Levine M. Regulation of two pair-rule stripes by a single enhancer in the Drosophila embryo. Developmental Biology. 1996;175:314–324. doi: 10.1006/dbio.1996.0117. [DOI] [PubMed] [Google Scholar]
- Spirov AV, Holloway D. Making the body plan: precision in the genetic hierarchy of Drosophila embryo segmentation. Silico Biology. 2003;3(0009) http://www.bioinfo.de/isb/2003/03/0009/ [PubMed]
- Stanojevic D, Hoey T, Levine M. Sequence-specific DNA-binding activities of the gap proteins encoded by hunchback and Krüppel in Drosophila. Nature. 1989;341:331–335. doi: 10.1038/341331a0. [DOI] [PubMed] [Google Scholar]
- Stanojevic D, Small S, Levine M. Regulation of a segmentation stripe by overlapping activators and repressors in the Drosophila embryo. Science. 1991;254:1385–1387. doi: 10.1126/science.1683715. [DOI] [PubMed] [Google Scholar]
- Struhl G. Differing strategies for organizing anterior and posterior body pattern in Drosophila embryos. Nature. 1989;338:741–744. doi: 10.1038/338741a0. [DOI] [PubMed] [Google Scholar]
- Struhl G, Johnston P, Lawrence PA. Control of Drosophila body pattern by the hunchback morphogen gradient. Cell. 1992;69:237–249. doi: 10.1016/0092-8674(92)90405-2. [DOI] [PubMed] [Google Scholar]
- Struhl G, Struhl K, Macdonald PM. The gradient morphogen Bicoid is a concentration-dependent transcriptional activator. Cell. 1989;57:1259–1273. doi: 10.1016/0092-8674(89)90062-7. [DOI] [PubMed] [Google Scholar]
- Strunk B, Struffi P, Wright K, Pabst B, Thomas J, Qin L, Arnosti DN. Role of CtBP in transcriptional repression by the Drosophila Giant protein. Developmental Biology. 2001;239:229–240. doi: 10.1006/dbio.2001.0454. [DOI] [PubMed] [Google Scholar]
- Tautz D. Regulation of the Drosophila segmentation gene hunchback by two maternal morphogenetic centres. Nature. 1988;332:281–284. doi: 10.1038/332281a0. [DOI] [PubMed] [Google Scholar]
- Tautz D, Lehmann R, Schnürch H, Schuh R, Seifert E, Kienlin A, Jones K, Jäckle H. Finger protein of novel structure encoded by hunchback, a second member of the gap class of Drosophila segmentation genes. Nature. 1987;327:383–389. [Google Scholar]
- Tsai C, Gergen JP. Gap gene properties of the pair-rule gene runt during Drosophila segmentation. Development. 1994;120:1671–1683. doi: 10.1242/dev.120.6.1671. [DOI] [PubMed] [Google Scholar]
- Webster G, Goodwin BC. Form and Transformation: Generative and Relational Principles in Biology. Cambridge University Press; Cambridge, UK: 1996. [Google Scholar]
- Weigel D, Jürgens G, Klingler M, Jäckle H. Two gap genes mediate maternal terminal pattern information in Drosophila. Science. 1990;248:495–498. doi: 10.1126/science.2158673. [DOI] [PubMed] [Google Scholar]
- Wu X, Vasisht V, Kosman D, Reinitz J, Small S. Thoracic patterning by the Drosophila gap gene hunchback. Developmental Biology. 2001;237:79–92. doi: 10.1006/dbio.2001.0355. [DOI] [PubMed] [Google Scholar]