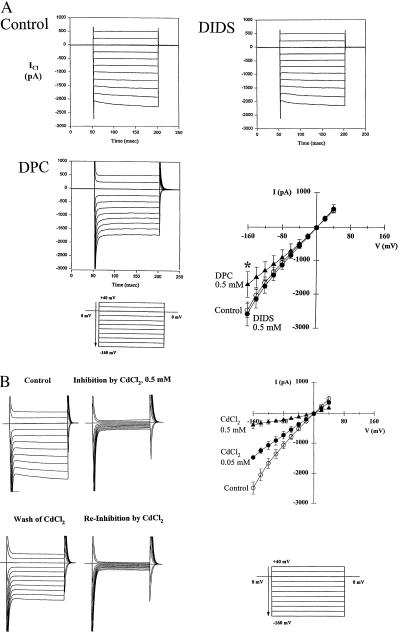
Figure 5.
Inhibition by DPC and cadmium of HACCs generated in cells overexpressing ClC-2. (A) Representative current records illustrating the effect of DIDS (0.5 mM) and DPC (0.5 mM) and I–V plot of mean values ± SEM of S2 cells to DIDS (solid circles; n = 5) and DPC (solid triangles; n = 6). Currents were insensitive to DIDS whereas DPC inhibited the HACCs at hyperpolarizing voltages only, eliminating the rectification of the I–V plot. Asterisk indicates significant difference (P < 0.05) from control (open circles; n = 5) by paired Student’s t test. (B) Representative current recordings illustrating the reversible inhibitory effect of CdCl2 (0.5 mM), and I–V plots summarizing HACCs generated in the presence of 0.5 mM CdCl2 (solid triangles; n = 6) or 0.05 mM CdCl2 (solid circles; n = 6) in the bath solution. Asterisks indicate a significant difference (P < 0.05) from control (open circles; n = 6) by paired Student’s t test.

