Abstract
Destructive interference from phase fluctuations caused by motion during 1H magnetic resonance spectroscopy (MRS) stimulated-echo acquisition mode (STEAM) and point-resolved spectroscopy (PRESS) acquisitions can significantly diminish the traditional √N-gain in signal-to-noise ratio (SNR) afforded by averaging N signals, especially in the torso. The SNR loss is highly variable among individuals, even when identical acquisition protocols are used. This paper presents a theory for the SNR loss, assuming that the phase fluctuates randomly. It is shown that SNR in conventional averaging is reduced by the factor sinc(σφ√3/π), where σφ is the standard deviation (SD) of the phase. “Constructive averaging,” whereby each individual acquisition is phase-corrected using the phase of a high-SNR peak before averaging, reverses the SNR loss from motion-induced dephasing, resulting in a {1/sinc(σφ√3/π)}-fold SNR improvement. It is also shown that basing phase corrections on an average of √N adjacent points both improves correction accuracy and effectively eliminates false signal artifacts when corrections are based on low-SNR peaks. The theory is validated over a sevenfold range of variation in signal loss due to motion observed in 1H STEAM and PRESS data acquired from 17 human subjects (heart: N = 16; leg: N = 1). Constructive averaging should be incorporated as a routine tool for in vivo 1H MRS. Magn Reson Med 56:754–760, 2006.
Keywords: 1H magnetic resonance spectroscopy, MRS; motion correction, spectral processing, artifact reduction
Averaging N localized in vivo magnetic resonance spectroscopy (MRS) acquisitions does not always deliver the full theoretical √N-fold benefit in signal-to-noise ratio (SNR). The application of cardiac-gated proton (1H) stimulated-echo acquisition mode (STEAM) and point-resolved spectroscopy (PRESS) spin-echo MRS to measure total myocardial creatine (CR) in humans, for example, yields spectra with 3–9 ml resolution after 3–5 min of averaging at 1.5 Tesla (1–3). However, such performance matches neither the submilliliter resolution of CR measurements achieved in the brain at 1.5 Tesla (4) nor the predicted 45-fold SNR improvement over phosphorus (31P) MRS of cardiac phosphocreatine (PCr) due to the higher nuclear concentration and sensitivity of the CR {−CH3} moiety. Evidently, something is amiss.
The fact that motion causes signal loss during averaging of PRESS and STEAM proton (1H) spectra acquired from the torso is evidenced by improvements in metabolite SNR achieved by cardiac-gating (1,3), respiratory gating or breath-holding (5,6), or combined cardiac/respiratory gating (2,7,8) of acquisitions from the brain, abdomen, and thorax. Evidently, motion in the presence of field gradients changes the phase of the echo signal (9), resulting in destructive interference when consecutive signals are averaged. One straightforward solution is to reverse the phase-cancellation by collecting each raw acquisition separately and individually phase-correcting them prior to averaging (9–15). The periodic rediscovery of this excellent “constructive averaging” solution and its variants is perhaps more reflective of failures in adopting it into commercial MRS product upgrades than any difficulty in implementation. Note that while constructive averaging does not address the other deleterious effects of voxel dislocation due to motion, as a simple postprocessing tool it requires no special pulse sequences, patient cooperation, or sacrifice in scan time, and is easily implemented with data acquired with any of the gating and breath-holding strategies (1–3,5–8).
The usual implementation of constructive averaging for 1H MRS requires the residual water signal in the ith acquisition to have sufficient SNR to permit a reliable determination of its phase, φi, at the specified chemical shift in each acquisition (9,10,12,14). The entire ith spectrum is then simply rotated by –φi before it is added to all of the other phase-corrected acquisitions. If the phase of the water peak is too corrupted by water suppression, other intense peaks (such as a lipid resonance) or even phasing based on the metabolite of interest itself (12) can be used similarly, provided care is taken to avoid false peaks that arise, for example, when random noise signals are phased and rendered coherent.
While constructive averaging works (9,11–15), it is certainly frustrating that the gain in SNR that results from its implementation is highly variable, at least for cardiac 1H MRS. Indeed, the SNR gain realized is currently not predictable on an experimental basis, although a numerical expression that includes the phase dispersion has been noted (8,11). It is critical to know just how much SNR gain or loss is attributable to motion-induced dephasing effects in 1H MRS of the torso in order to determine whether motion correction is working, and to account for the observed SNR of the in vivo experiment.
The purpose of this paper is to provide a theory to quantitatively explain the SNR loss from motion-induced dephasing compared to averaging in the absence of motion-induced dephasing, and, conversely, how much SNR can be gained by constructive averaging. A simple expression is derived that relates the SNR loss to experimental measures of the phase variance. The theory is tested and validated on real data acquired for constructive averaging covering a wide range of variation in SNR improvement.
THEORY
Assuming that the underlying SNR does not vary during the course of acquiring the N signals being averaged for a spectrum, the measured complex MRS signal of a given peak in the ith acquisition can be represented as a unit vector. Phase variations will cause the unit vector to rotate. The phase accumulated prior to acquisition depends on many random factors, including the velocity, acceleration, and duration of motion, as well as the magnitude of gradients applied during the motion. We therefore assume that the motion-induced phase shifts in all of the N acquisitions are random, and that they are independent and identically distributed (IID) uniformly in the interval [Φ1, Φ2]. This is a common assumption for random variables without a priori favored distributions (16). The constructive component of averaging these vectors will therefore sum to a direction oriented toward Φm = (Φ1 + Φ2)/2. We introduce Φp = (Φ2-Φ1)/2 as half of the range of the phase variation. Then Φp is related to the standard deviation (SD) of the phase, σφ by the well-known relation or (16). The parameter Φp is a measure of the severity of the phase variation with a value of 180° corresponding to complete destructive averaging.
Signal Loss in Conventional Averaging
First we consider the effect of this random phase on a conventionally averaged spectrum. The constructive component is the average of the projections, si = cos(φi – Φm), of each of these vectors on an axis oriented toward Φm:
| [1] |
where φi is the phase of the ith acquisition. The average signal has mean
| [2] |
and variance
| [3] |
where sinc(x) = sin(πx)/πx. Thus, the mean value of the conventionally averaged signal is reduced by a factor of sinc(Φp/π) due to the randomness of the phase. This results in a corresponding reduction in SNR. Equation [2] is plotted in Fig. 1.
FIG. 1.
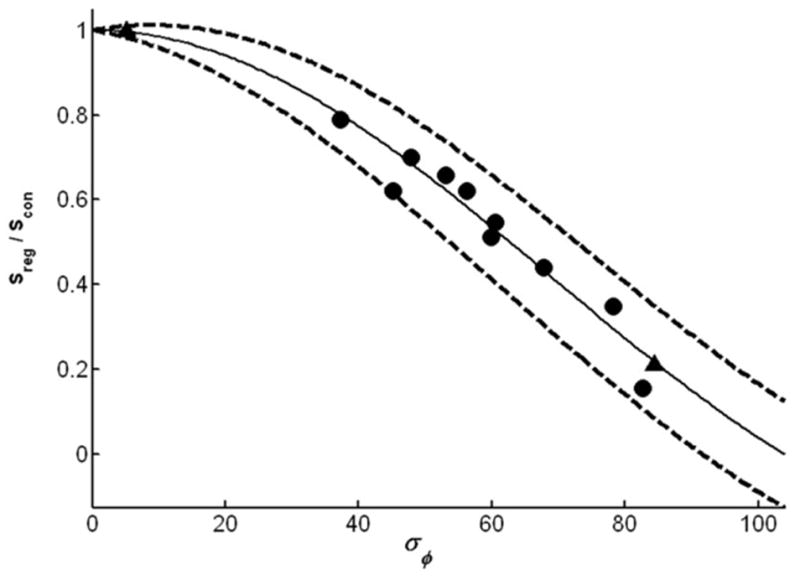
Predicted SNR reduction of conventionally averaged signals as a function of the SD of the phase of individual acquisitions, σφ (solid line), as given by Eq. [2]. This curve is the same as the ratio of conventional to constructive averaged signals, Sreg/Scon. Dashed curves enclose the 95% confidence intervals (based on Eq. [3]). The reciprocal of the curve is the expected SNR gain from constructive averaging. Experimental data points derive from constructively averaged 1H MRS spectra from the human heart (circles) and from a leg without (left triangle) and with (right triangle) tremor, all at 1.5 T.
Signal Gain From Constructive Averaging
Constructive averaging first requires a best estimate of the phase, φi, of the spectral peak that is selected for phase-correcting each ith acquisition. Because the peak is typically comprised of multiple frequency points, it seems reasonable to use the average phase of M adjacent points in the peak to minimize phase fluctuations due to noise. Although there are many sources of noise and artifacts in spectra acquired in vivo, Gaussian distribution is the predominant choice for modelling noise. Assuming that the real and imaginary parts of the spectrum, x and y, are IID with normal distributions with means μx and μy, and the same SDs σ, then those fluctuations in phase φ = arctan(y/x) of the M individual points due to random noise are given by the Rician distribution (17) with probability density function:
| [4] |
where is the SNR of the peak, α = tan−1(μy/μx), and . For Ψ ≥ 3, this phase distribution is well-approximated by a normal distribution with mean phase μφ = α and SD σφ = 1/Ψ, assuming that the M adjacent samples have the same SNR level. Although this assumption may not be exactly true for sharp peaks, the approximation only slightly affects the mean and variance of the distribution provided that the SNR is sufficiently high for all M samples. The effect of miss-setting the M points relative to the peak center merely offsets the zero-order phase of the averaged peak by the same amount in each acquisition, which is easily remedied by standard phase correction post-averaging. Thus, averaging the phase of M adjacent point samples yields a correction phase φ̄ with mean α and a reduced standard error in the mean, , compared to taking only M = 1 point.
Now consider a constructively averaged spectrum with each acquisition phase-corrected before addition. The constructively-averaged spectrum has signal
| [5] |
where φ̃i = φi − φ̄i is the residual phase of the selected peak in the ith acquisition after correction using the estimated phase φ̄i. The residual phase, φ̃, has a normal distribution with zero mean and SD, . Thus, Scon has mean:
Completing the square in the exponent and using an integral table, the integral reduces to (18):
| [6] |
The variance is similarly derived as:
| [7] |
For good SNR (Ψ ≥ 3) and sufficiently large M, μcon ∼ 1, σcon goes to zero, and Scon becomes deterministic with a value of ∼1. Because the noise distribution is random and unaffected by phasing, the SNR improvement is given by the ratio of the signals, that is, Scon/Sreg. Therefore, the expected SNR improvement factor due to use of constructive averaging is given by the reciprocal of Eq. [2]. This is 1/sinc(Φp/π), or 1/sinc(σφ√3/π) in terms of the observed SD of the phase variation.
Note that while this analysis addresses only phase fluctuations, variations in the underlying signal amplitudes can be accounted for by including an amplitude factor, ai, in Eqs. [1] and [5], and can potentially be factored out as an expectation value without affecting the phase analysis. Regardless, amplitude fluctuations do not significantly affect the resulting 1/sinc(σφ√3/π) gain in SNR from constructive averaging (Fig. 1) because this gain is measured relative to conventional averaging, which is equivalently degraded by amplitude fluctua-tions.
Signal Artifact From Constructive Averaging
Thus far, we have considered constructive averaging based on the phase of a high-SNR peak, such as water or lipid, that is independent of the low-SNR metabolite of interest. What happens if phasing is based on the low-SNR metab-olite signal directly? If the metabolites’ phase varies sig-nificantly because of its low SNR, constructive averaging can falsely augment it. Consider the worst case in which the peak selected for phasing contains no signal but is entirely noise, and phase correction is based on M = 1 noise point. By definition, Ψ = 1 for this point in each acquisition. Averaging N acquisitions with such a point always in phase creates a false peak with SNR Ψ = √N at the selected point, again because the surrounding noise, being random, is unaffected by rephasing. This false peak can be eradicated by choosing M > 1 to average enough points to render the phase of the N acquisitions incoherent, so that the average SNR of the noise points falls to Ψ ∼ 1
The phase of pure noise is uniformly distributed over [−π, π), corresponding to unit vectors that span the whole unit circle. The average phase of M points in the noise is . After correcting by −φ̄, each of the M points has phase (φk − φ̄) and its signal is given by
| [8] |
The mean and variance of the noise sample after correction are:
| [9] |
and
| [10] |
respectively.
Equation [9] is plotted in Fig. 2. It has a maximum value of 1 at M = 1, and falls rapidly for M > 1. The curve shows that the mean value of the signal can be reduced to the level of the noise if sufficiently large M is chosen. Because Eq. [9] is well approximated by μnoise ∼ 1/M (Fig. 2), and because the false peak has an expected SNR of √N, setting M ∼√N suffices to reduce the false peak to the noise floor. For example, for N = 64 averages, choosing M ∼ 8 points both eliminates the likelihood that constructive averaging will create an artificial peak in the case of noise, and reduces the error in estimating the correcting phase by nearly threefold (∼√8) when real signal is present.
FIG. 2.
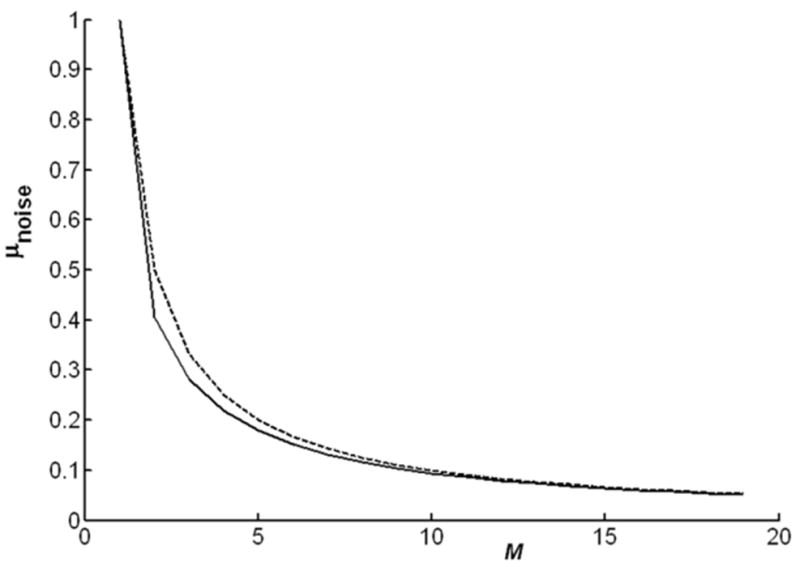
The mean signal that results from averaging the phase of M noise points in an acquisition (solid curve), as given by Eq. [9]. The dashed line follows μnoise = 1/M.
MATERIALS AND METHODS
Experiment
Twelve sets of N = 64 or 128 (NEX) unaveraged water-suppressed STEAM 1H spectra (TE = 10–15 ms, TM = 14 ms) were collected on a GE 1.5 T Signa scanner from the hearts of 12 healthy volunteers using a 13-cm surface receiver coil, and from the leg of a volunteer at rest and during tremor, using a 1H MRI extremity transmit/receive coil. For heart studies, the subjects were positioned prone on the surface coil with TR ∼ 1.7 s gated at twice the cardiac period (1). Voxels of 2–8 cm3 were prescribed from scout MRI after automatic shimming. A conventionally averaged spectrum was generated from each data set by adding the individual acquisitions without phasing. A constructively averaged spectrum was then obtained from the same data set by averaging the phase of M = √N points centered on the lipid peak of each individual acquisition. The SNR of the conventional and constructively averaged spectra were quantified from an intense lipid resonance, σφ(determined) and Sreg/Scon (calculated).
A statistical Kolmogorov-Smirnov goodness-of-fit test (19) was used to evaluate the uniformity of the phase distribution in each data set, and the amplitude variation was measured in individual data sets. To test whether constructive averaging creates false peaks when low-SNR signals are selected for phasing individual acquisitions, and whether they can be eradicated by averaging √N points, we performed phasing using signal-free (noise) portions of the 1H spectra.
Finally, six cardiac-gated, navigator-echo, double-triggered PRESS (TE = 40 ms, NEX = 128) and STEAM (TE = TM = 20 ms; TR ∼ 3.5s; NEX = 128; outer volume suppression) 1H MRS data sets were acquired from an additional four healthy volunteers on a Philips 3T MRI scanner to test whether constructive averaging afforded any additional advantage to the cardiac-respiratory double triggering strategy (8,11).
RESULTS
The effect of applying constructive and conventional averaging to a data set acquired from a voxel in the tremoring leg is illustrated in Fig. 3. In this example constructive averaging resulted in an SNR gain of about fivefold over conventional averaging. The gain is manifest across the spectrum, independently of chemical shift or which water or lipid peak is used to phase the individual acquisitions. In the 13 cardiac and leg 1.5 T data sets, the SNR gain from constructive averaging ranged from 0% to about 700%. The average SNR improvement for the heart 1H spectra was 2.3(±1.5)-fold. The experimental measurements of SNR as a function of the observed phase variation are plotted in Fig. 1. Importantly, all of the experimental data fall within the 95% confidence intervals of the predicted curve given by Eqs. [2] and [3].
FIG. 3.
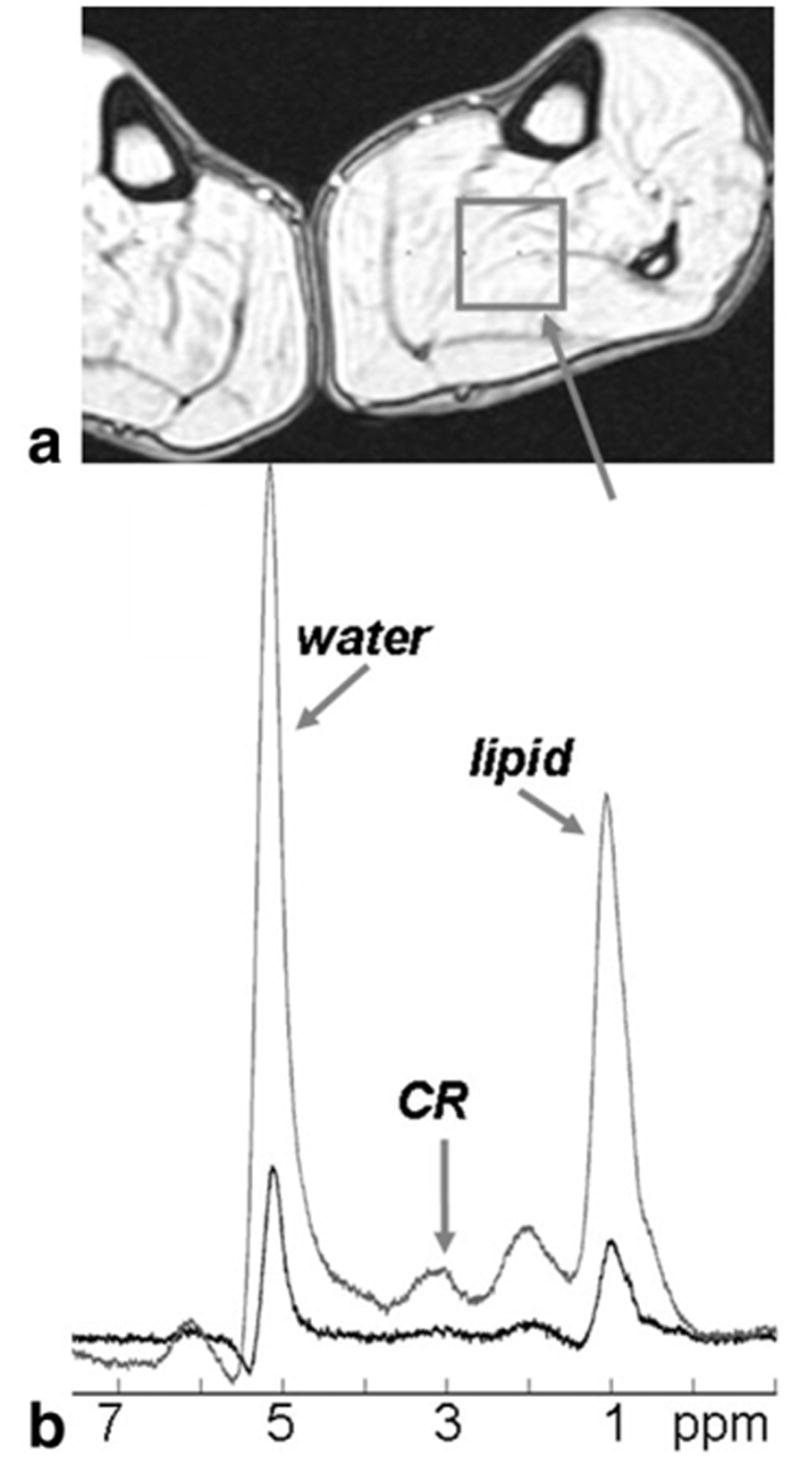
Annotated gradient refocused echo MRI (a) showing the location of an N = 64 NEX STEAM data set acquired from a human leg with conventional averaging (b, lower spectrum) and constructive averaging (b, upper spectrum) of the identical data set acquired at 1.5 Tesla. In this case, the leg was tremored continuously during the acquisition. Constructive averaging based on phasing either the lipid resonance (–CH2–) or the incompletely suppressed water resonance yielded the same result—about a fivefold increase in SNR. The experimental range of phase variation is 334°, and σφ = 88°.
The Kolmogorov-Smirnov goodness-of-fit test results were consistent with the hypothesis that the experimental phase distribution is uniform in 50% of the data sets (P > 0.05). Note that this test is limited by N, which in turn is limited by the averaging time in real in vivo acquisitions. Even so, any variations in individual distributions from uniformity were not enough to affect the fit to the curve in Fig. 1. Similarly, a measured 50% or more variation in amplitude in individual data sets did not affect the fit to Fig. 1 because the conventional average is degraded equivalently by these variations, as noted above.
The effect of applying constructive averaging to noise in a 1.5 T cardiac spectrum is shown in Fig. 4. With N = 64 NEX and M = 1, a sizeable spike with SNR ∼ 8 is generated at the chosen point. This false peak attenuates with M = 3, and is essentially eliminated by using a phase correction based on M = 8 points, consistent with the theory. This result is robust for all of the data sets.
FIG. 4.
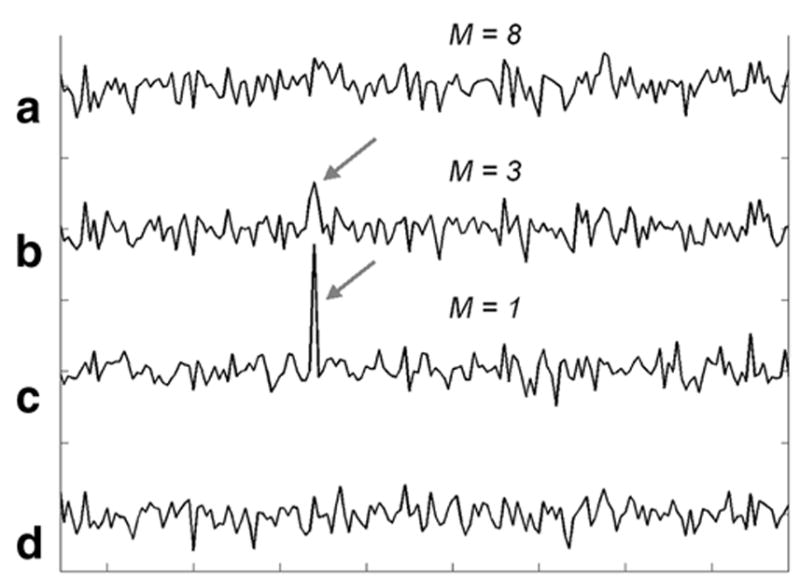
Portion of an N = 64 NEX, 1024-point, 1-kHz, water-suppressed STEAM spectrum acquired from a 6-ml voxel in the heart showing only noise. Spectra are constructively averaged based on M = 8 points (a), M = 3 points (b), and M = 1 point (c). Constructive averaging creates a false peak (gray arrow) with M = 1, which is demolished by increasing M. The conventional averaged spectrum appears at the bottom (d). Spectra are displayed unfiltered. Each division on the horizontal axis corresponds to 20 frequency domain points. High-SNR peaks show no benefit from noise-based constructive averaging.
In the additional six cardiac double-gated 3T PRESS data sets, the phase variations (σφ) were smaller, and constructive averaging afforded a more limited SNR improvement averaging 8.4% over conventional averaging. The effect of constructive averaging on the Cr resonance from a cardiac-gated, navigator-echo triggered NEX = 128 STEAM spectrum acquired in the human heart at 3T is exemplified in Fig. 5. Here, constructive averaging produced a measured 15% SNR improvement, identical to a calculated 15% improvement from Eq. [2], based on the measured phase variation of σφ= 30.3°.
FIG. 5.
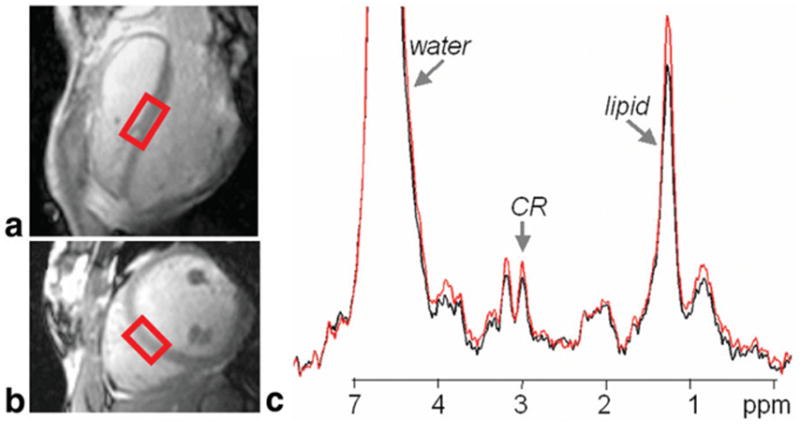
Long-axis (a) and short-axis (b) views of a cardiac and navigator echo-triggered 1.4 × 2.5 × 3.0 cm STEAM voxel (in red) acquired at 3T in the septum of a supine normal volunteer with a surface coil. The corresponding conventional (black) and constructively averaged (red) 1H spectra from the same data set are overlaid in c, and demonstrate a 15% SNR gain for constructive averaging.
DISCUSSION
The agreement between the experimental results and the theory demonstrates that the dephasing effect of motion on STEAM and PRESS spin-echo acquisitions can be successfully modeled by a purely random variation in the phase of individual acquisitions. This phase randomization diminishes and can even reverse the √N-fold SNR gain that is conventionally associated with averaging N signals. With this model, the SNR that is lost when acquisitions dephased by motion are averaged is a simple sinc-function of the measured SD of the phase. The observed signal losses are highly variable among subjects and studies, and can vary manifold for the same protocol applied to motion-prone organs, such as the heart. Consequently, motion-induced dephasing may constitute the prominent source of signal variability in such studies. Moreover, we show that constructive averaging involving phase correction of individual acquisitions using the phase of a high-SNR peak, such as water or lipid, prior to averaging is an effective postprocessing remedy for motion-induced dephasing. With this method the SNR may be largely restored to expected levels.
Phase correction of individual acquisitions is most conveniently achieved by measuring the phase at the chemical shift of the selected peak and applying a zero-order phase shift of opposite sign to the whole acquisition. We have shown that if the peak chosen for phase-correction has low SNR(∼1), constructive averaging can falsely augment or create a false peak at the chosen chemical shift. However, averaging the phase of M ∼ √N adjacent points at the selected chemical shift both effectively eliminates false signal artifacts when SNR is low, and improves phase estimates when high-SNR peaks are chosen for phasing. When constructive averaging was applied to cardiac 1H MRS PRESS data acquired with both cardiac and respiratory (navigator echo) gating, the additional SNR benefit that accrued (∼10%) was more modest because phase variations in these data were already small. Even so, phase correction was able to remedy a limited number of dephased outliers among these data sets, and, unlike navigator echo, it avoids outright data rejection with its associated efficiency loss.
In conclusion, constructive averaging is a simple, easily automated, and effective method for compensating for motion-induced dephasing of localized, averaged, spin-echo 1H MRS data, especially in the torso, where motion limits the efficacy of signal averaging. Constructive averaging cannot restore signals that are entirely lost from spin echoes or are artificially line-broadened due to motion (14,15), nor address spatial blurring nor partial volume errors in voxels due to motion, although this is more problematic for chemical shift imaging (CSI) methods (20–23). Nevertheless, given the consensus of various authors over the past dozen years regarding its virtues (9,11–15), there seems to be little reason why the method should not now be incorporated as a routine tool for in vivo 1H MRS.
Acknowledgments
We thank Ray F. Lee for initial help with this work. Some of the 3T double-gated cardiac data analyzed were collected in collaboration with M.S. while he was at the Institute for Biomedical Engineering, University of Zurich, and the Swiss Federal Institute of Technology, Zurich, Switzerland.
Footnotes
Grant sponsor: NIH; Grant numbers: RO1HL56882; HL61912; Grant sponsor: Donald W. Reynolds Foundation.
References
- 1.Bottomley PA, Weiss RG. Noninvasive MRS detection of localized creatine depletion in non-viable, infarcted myocardium. Lancet. 1998;351:714–718. doi: 10.1016/S0140-6736(97)06402-7. [DOI] [PubMed] [Google Scholar]
- 2.Felblinger J, Jung B, Slotboom J, Boesch C, Kreis R. Methods and reproducibility of cardiac/respiratory double-triggered 1H-MR spectroscopy of the human heart. Magn Reson Med. 1999;42:903–910. doi: 10.1002/(sici)1522-2594(199911)42:5<903::aid-mrm10>3.0.co;2-n. [DOI] [PubMed] [Google Scholar]
- 3.Nakae I, Mitsunami K, Omura T, Yabe T, Tsutamoto T, Matsuo S, Takahashi M, Morikawa S, Inubushi T, Nakamura Y, Kinoshita M, Horie M. Proton magnetic resonance spectroscopy can detect creatine depletion asssociated with the progression of heart failure in cardio-myopathy. J Am Coll Cardiol. 2003;42:1587–1593. doi: 10.1016/j.jacc.2003.05.005. [DOI] [PubMed] [Google Scholar]
- 4.Nelson SJ, Vigneron DB, Star-Lack J, Kurhanewicz J. High spatial resolution and speed in MRSI. NMR Biomed. 1997;10:411–422. doi: 10.1002/(sici)1099-1492(199712)10:8<411::aid-nbm496>3.0.co;2-8. [DOI] [PubMed] [Google Scholar]
- 5.Katz-Brull R, Rofsky NM, Lenkinski RE. Breathhold abdominal and thoracic proton MR spectroscopy at 3T. Magn Reson Med. 2003;50:461–467. doi: 10.1002/mrm.10560. [DOI] [PubMed] [Google Scholar]
- 6.Dixon RM, Frahm J. Localized proton MR spectroscopy of the human kidney in vivo by means of short echo time STEAM sequences. Magn Reson Med. 1994;31:482–487. doi: 10.1002/mrm.1910310503. [DOI] [PubMed] [Google Scholar]
- 7.Schär M, Kozerke S, Boesiger P. Navigator gating and volume tracking for double-triggered cardiac proton spectroscopy at 3 Tesla. Magn Reson Med. 2004;51:1091–1095. doi: 10.1002/mrm.20123. [DOI] [PubMed] [Google Scholar]
- 8.Felblinger J, Kreis R, Boesch C. Effects of physiologic motion of the human brain upon quantitative 1H-MRS: analysis and correction by retrogating. NMR Biomed. 1998;11:107–114. doi: 10.1002/(sici)1099-1492(199805)11:3<107::aid-nbm525>3.0.co;2-i. [DOI] [PubMed] [Google Scholar]
- 9.Posse S, Cuenod CA, LeBihan D. Motion artifact compensation in 1H spectroscopic imaging by signal tracking. J Magn Reson. 1993;102:222–227. [Google Scholar]
- 10.Zhu G, Gheorghiu D, Allen PS. Motional degradation of metabolite signal strengths when using STEAM: a correction method. NMR Biomed. 1992;5:209–211. doi: 10.1002/nbm.1940050408. [DOI] [PubMed] [Google Scholar]
- 11.Ziegler A, Decorps M. Signal-to-noise improvement in in vivo spin-echo spectroscopy in the presence of motion. J Magn Reson B. 1993;102:26–34. [Google Scholar]
- 12.Bottomley PA, Lee RF, Weiss RG. Constructive averaging increases SNR of creatine MRS in the presence of motion. Proceedings of the 7th Annual Meeting of ISMRM; Philadelphia, PA, USA. 1999. p. 687. [Google Scholar]
- 13.Star-Lack JM, Adalsteinsson E, Gold GE, Ikeda DM, Spielman DM. Motion correction and lipid suppression for 1H magnetic resonance spectroscopy. Magn Reson Med. 2000;43:325–330. doi: 10.1002/(sici)1522-2594(200003)43:3<325::aid-mrm1>3.0.co;2-8. [DOI] [PubMed] [Google Scholar]
- 14.Helms G, Piringer A. Restoration of motion-related signal loss and line-shape deterioration of proton MR spectra using the residual water as intrinsic reference. Magn Reson Med. 2001;46:395–400. doi: 10.1002/mrm.1203. [DOI] [PubMed] [Google Scholar]
- 15.Bolan PJ, Henry PG, Baker EH, Meisamy S, Garwood M. Measurement and correction of respiration-induced B0 variations in breast 1H MRS at 4 Tesla. Magn Reson Med. 2004;52:1239–1245. doi: 10.1002/mrm.20277. [DOI] [PubMed] [Google Scholar]
- 16.Stark H, Woods JW. Probability and random processes with applications to signal processing. Englewood Cliffs, NJ: Prentice Hall; 2002. [Google Scholar]
- 17.Gudbjartsson H, Patz S. The Rician distribution of noisy MRI data. Magn Reson Med. 1995;34:910–914. doi: 10.1002/mrm.1910340618. [DOI] [PMC free article] [PubMed] [Google Scholar]
- 18.Richards MA. Coherent integration loss due to white Gaussian phase noise. IEEE Signal Proc Lett. 2003;10:208–210. [Google Scholar]
- 19.D’Agostino R, Stephens M. Goodness-of-fit techniques. New York: Marcel Dekker, Inc.; 1986. [Google Scholar]
- 20.Haupt CI, Kiefer AP, Maudsley AA. In-plane motion correction for MR spectroscopic imaging. Magn Reson Med. 1998;39:749–753. doi: 10.1002/mrm.1910390512. [DOI] [PubMed] [Google Scholar]
- 21.Doyle VL, Howet FA, Griffiths JR. The effect of respiratory motion on CSI localized MRS. Phys Med Biol. 2000;45:2093–2104. doi: 10.1088/0031-9155/45/8/303. [DOI] [PubMed] [Google Scholar]
- 22.Kozerke S, Schär M, Lamb HJ, Boesiger P. Volume tracking cardiac 31P spectroscopy. Magn Reson Med. 2002;48:380–384. doi: 10.1002/mrm.10182. [DOI] [PubMed] [Google Scholar]
- 23.Kim DH, Adalsteinsson E, Spielman DM. Spiral readout gradients for the reduction of motion artifacts in chemical shift imaging. Magn Reson Med. 2004;51:458–463. doi: 10.1002/mrm.20004. [DOI] [PubMed] [Google Scholar]


