

Abstract
Magnetometry analysis of brain tissue sub-samples from two neuroferritinopathy patients provides a preliminary indication that the amount of magnetic iron compounds associated with this rare disease is significantly larger than in age/sex-matched controls from the same region of the brain. The primary iron compounds contributing to the remanant magnetization of the tissue above 50 K and at body temperature, are both blocked and superparamagnetic (SPM) biogenic magnetite (Fe3O4) and/or maghemite (γ-Fe2O3). The concentration of SPM magnetite is significant and appears to be proportional to the concentration of ferritin, which varies with progression of the disease. The mutated ferritin protein appears to be responsible for the presence of iron oxide nano-particules, which in turn could be responsible for extensive damage in the brain.
Keywords: Neuroferritinopathy, magnetite, Verwey transition, SQUID magnetometry, iron, nanoparticles, biomineralization, neurodegenerative disease
1. Introduction
Neuroferritinopathy (NF) is a rare genetic disorder resulting directly from a known mutation in the gene encoding for the ferritin light polypeptide. NF has a late onset at ca. 40 years of age [1], and results in the accumulation of aggregates of ferritin-like clusters and iron in the basal ganglia and also throughout the brain and is also often associated with a low serum ferritin level. [2] Magnetic resonance imaging (MRI) is currently used to confirm the location and amount of iron deposition [2,3] of NF pathology by mapping iron concentrations.
Although a malfunction in the way that ferritin handles iron is at the root of NF, the specific iron compounds associated with the disease remain unknown [1]. Understanding which iron compounds are present is also important for determining the potential mechanisms of neuronal damage. It is well known that Ferrous (Fe2+) iron can promote free radical damage via the Fenton reaction. The magnetic iron biomineral magnetite is a mixed-valence iron oxide providing a potential source of redox-active ferrous iron. In addition, biogenic magnetite may also generate free radicals via triplet state stabilization due to the strong magnetic fields associated with it. [4–6]
The study of NF is highly relevant to other diseases, such as Alzheimer’s, Parkinson’s and Huntington’s diseases. A major feature of virtually all neurodegenerative diseases is the accumulation of excess iron. This association was first discovered in Alzheimer’s disease more than 50 years ago [7] and it is thought that iron and other metals promote pathogenesis through oxidative stress [8–12]. This is particularly important for ferrous iron as its presence can lead to radical production via the Fenton reaction. However, it is only within the past few years that advances in the techniques used to study brain iron have started to lead to a better understanding of the specific iron compounds present and the brain structures with which they are associated [13–15]. Recently, Smith, Perry and others have begun to make progress in this area using modified staining techniques [16,17]. They have demonstrated that redox-active iron is closely associated with AD plaques and neurofibrillary tangles. This work has demonstrated that lesion-associated iron is distinct from iron sequestered in ferritin and has provided indirect evidence of the presence of Fe(II) in AD tissue. Other groups have used transmission electron microscopy and synchrotron x-ray analysis to demonstrate that Fe2+-bearing iron oxides are associated with pathogenic tissue in AD [14,18,19].
For most of these diseases, however, the underlying pathogenic mechanism is not known. By examining related neurodegenerative disorders, such as NF - which is well characterized and arises from a specific genetic defect - we may be able to shed light on the potential role of iron in the pathogenesis of other, more common conditions. Therefore, in order to characterize and identify specific iron oxides associated with neuroferritinopathy, we have evaluated the magnetic properties of brain tissue samples from two NF cases using highly sensitive Superconducting Quantum Interference Device (SQUID) magnetometry.
2. Materials and methods
Fresh frozen neuroferritinopathy brain tissue samples were obtained from the Newcastle Brain Tissue Resource at the Institute for Ageing and Health, University of Newcastle. The horse spleen ferritin was purchased from Biogenisis and was freeze-dried prior to SQUID magnetometry measurement.
Five brain tissue samples of ca. 0.7g from the basal ganglia, were taken from two neuroferritinopathy female subjects of ca. 70 years of age. [Given the rarity of neuroferritinopathy, the exact ages of the patients in this study is not published to preserve anonymity.] All samples were sub-sectioned with a ceramic knife, stored at −80°C, and subsequently freeze-dried. Each freeze-dried sub-sample was introduced into a plastic straw and pressed into a pellet 4 mm high and 5 mm in diameter using a custom-made, non-magnetic press following procedures developed in our laboratory. [13,20] Control samples were taken post-mortem from the hippocampus of three females (mean age = 77). Samples were frozen and measured without tissue fixation.
A change in iron metabolism associated with neurodegenerative diseases is believed to lead to the formation of iron oxides with distinct magnetic properties [18,19,21,22]. Therefore, the measurement of the magnetic properties of all samples were characterized using a Quantum Design MPMS-7 (SQUID) magnetometer. Potential iron contamination has been examined by our group and the tissues were handled accordingly [23].
The performed measurements included isothermal remnant magnetization (IRM), a measurement which probes the ability of a material to retain its magnetization in the absence of an external field, following step-wise exposure to an increasingly higher fields.
The temperature dependence of magnetization (M vs. T) measured upon warming, after both cooling the sample in zero field (Zero-field-cooled; ZFC) and in an applied field (Field-cooled; FC) provides information on the magnetic blocking temperatures for magnetic compounds within the tissue and may be compared to horse spleen ferritin, which has been well characterized and is widely used as an analogue for non-pathogenic ferrihydrite/ferritin. [24–26] A more detailed analysis of the M vs. T measurements, looking at the difference in magnetization between the FC and the ZFC curve, can also reveal the presence of superparamagnetic nanoparticles.
Finally, because it has been hypothesized that a mishandling of iron by the ferritin protein may result in the formation of magnetite under pathogenic conditions related to neurodegeneration [21,22,27] and because magnetite nano particles have been identified by Quintana et al.[19], qualitative thermal decay of remanence (TDR) measurements were performed in order to check for the presence of the Verwey transition. This is a crystallographic transformation leading to a loss of magnetization upon warming at ca. 120 K which is diagnostic of the presence of magnetite. [28] Conventionally the decay of the remnant magnetization in TDR measurements is shown upon warming. For identification purpose and in order to gain in sensitivity, the measurement was performed upon cooling. The sample was exposed to a magnetic field of 1 T at 170 K, above the Verwey transition, the magnetic field was then quenched, and the remanent magnetization was measured upon cooling.
3. Results
3.1. IRM curves at 5 and 50 K
IRM measurements at 50 K, shown in Fig. 1, reveal blocked particles which reach their saturation magnetization at ca. 300 Oe, a typical feature of magnetite (Fe3O4) and/or its oxidation product maghemite (γ-Fe2O3) with a diameter larger than ca. 13nm [29,30]. The 5 K IRM curves, also shown in Fig. 1, do not reach saturation and highlight the presence of an antiferromagnetic material [31,32] with magnetization behaviour consistent with ferrihydrite, the most abundant magnetically ordered iron species in human tissues.
Fig. 1.
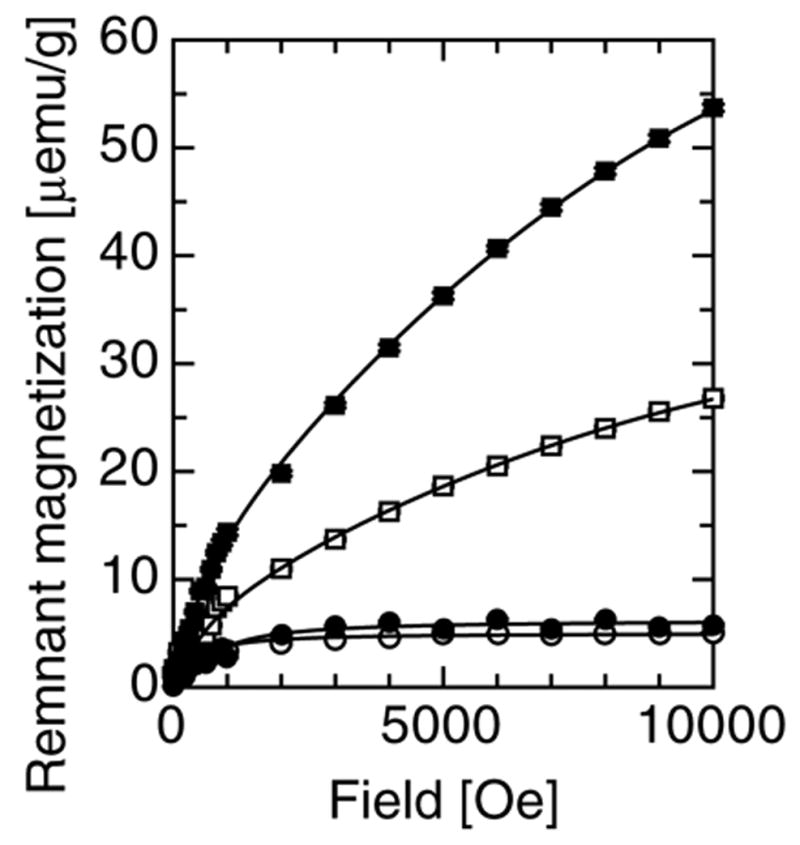
The isothermal remanence of magnetization and their empirical fit to eq. 1, for sample 1 fraction 1 at 5 K (■) and 50 K (●), and for sample 2 fraction 1 at 5 K (□) and 50 K (○).
3.2. IRM of HSF at 5 K
Comparison to ferritin standards allows for the quantification of the various magnetic iron-containing species in the tissue samples. The 5 K IRM curve of HSF shown in Fig. 2 is the measured curve from which a trivial, blocked magnetite contribution measured at 30 K of ca. 0.01% in mass was subtracted according to the same procedure as the one used below. The obtained empirical fit of this IRM curve to a second-degree polynomial [2.142 10−5H – 6.407 10−10 H2] is used as a reference in other fits.
Fig. 2.
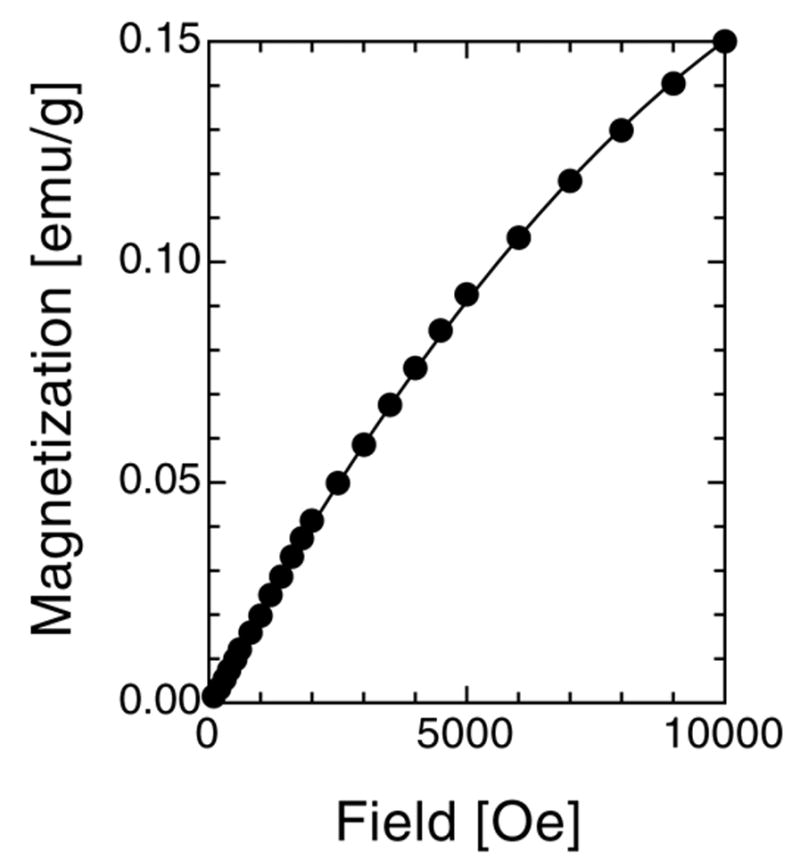
IRM curve of HSF measured at 5 K and fit to a second-degree polynomial: 2.142 10−5H – 6.407 10−10 H2.
3.3. Quantitative analysis of IRM curves
The fit of any IRM curve measured on biological tissue is likely to contain a blocked magnetite contribution which can be measured at 50 K and empirically fit to a Langevin function (Eq. 1 with the first term only). At 5 K, a non-saturating contribution from ferritin will be modelled with our standard second-degree polynomial, where only the ferritin fraction is fit. At 5 K, a third contribution to the remanence arises from magnetite particles ordering magnetically between 50 and 5 K and this contribution is also empirically fit to a Langevin function which appears in the second term of Eq. 1. The IRM curves are therefore fit to a three term empirical expression displayed in Eq. 1,
| (Eq. 1) |
where Ms/2 is the saturation magnetization in emu/g assuming a uniaxial non-interacting assembly of particles [33], μ1 and μ2 are empirical parameters, and fB fSPM and fFTN are the respective fractions of blocked magnetite, SPM magnetite and ferritin expressed in g/gWet Tissue. The first term is fit on its own using the 50 K IRM data and constrained to its value in the analysis of the 5 K data.
The various contributions are distinct from each other and allow an accurate quantification of the concentration of ferritin, magnetite that blocks at 50 K, and smaller magnetite particles which order magnetically between 50 and 5 K. Such detailed analysis was performed on patient 1 fraction1 and patient 2 fraction 1 and the results are reported in Table I. As expected, ferritin is more abundant by three orders of magnitude. The blocked magnetite level measured in neuroferritinopathy tissue is between 57 and 128 ng/gWet Tissue (96 ± 32), higher than is normally measured in age/sex matched freeze-dried control tissues from the same region of the brain (12–27 ng/gWet Tissue ), as reported in Table I. The concentration of SPM magnetite particles appears to vary with the concentration of ferritin which, in turn, varies with the evolution of the disease. SPM magnetite concentrations were of the order of 50 to 100 ng/g, bringing the total amount of magnetite in the tissue to 100–200 ng/g.
Table I.
IRM measurements at 1 T of neuroferritinopathy samples
| Patient - Fraction | IRMsat,50K, μemu/g(WT) | [MagnBl], ng/g(WT) | [MagnSPM], ng/g(WT) | [Ferritin], μg/g(WT) | [Ferritin]/[MagnSPM] | ||
|---|---|---|---|---|---|---|---|
| 50K | 150K | 300K | |||||
| 1-1 | 6.3* | 1.9 | - | 128[4]* | 96[9]* | 286[7]* | 2.98* |
| 1-2 | - | 2.8 | - | 57[3] | - | - | - |
| 1-3 | - | 3.4 | - | 69[17] | - | - | - |
| 2-1 | 5.0* | 2.6 | - | 102[4]* | 44[14]* | 132[6]* | 3.00* |
| 2-2 | - | 6.1 | - | 124[21] | - | - | - |
|
| |||||||
| - | - | 0.6 | 12 | - | - | - | |
| Controls | - | - | 0.6 | 12 | - | - | - |
| - | - | 1.3 | 27 | - | - | - | |
numbers based on an empirical fit of an IRM curve rather than a measurement at saturation. The error is based on an instrumental error for single point measurements and on the variance of the refined parameter for sample 1-1 and 2-1.
3.4. SPM particles
Additional evidence of the presence of these SPM magnetite particles is given in the field cooled and zero-field cooled results measured in 200 Oe and is shown in Fig. 3. The shape of the FC and ZFC curve in Fig. 3 is similar to those observed in horse spleen ferritin[24–26] but the difference between the FC and ZFC curves is significantly different. For ferritin, this difference decreases sharply from 5 to 25 K and is trivial at higher temperatures. [24–26] The difference between the FC and ZFC curve exhibit a rapid decrease of the magnetization between 5 and 25K which is characteristic of ferritin. In order to remove any ferritin contribution from the magnetisazation shown in the inset of Fig. 3, the difference curve of FC-ZFC was plotted between 25 and 300 K. The observed non-trivial magnetization is compatible with SPM or blocked magnetite with a coercivity larger than 200 Oe, thereby reinforcing conclusions drawn from the IRM measurements.
Fig. 3.
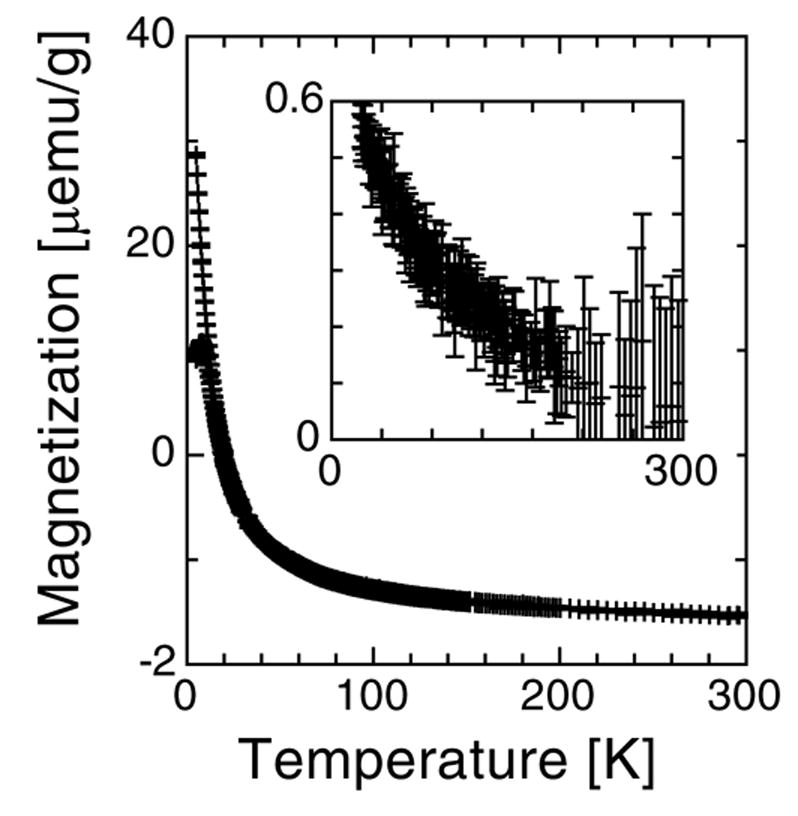
Temperature dependence of the magnetization of patient 1 fraction 1, measured in zero-field cooled and field cooled conditions with a field of 200 Oe. The inset shows the difference between the two curves above 25 K where there is no contribution from ferritin.
3.5. Identification of magnetite
The field at which the remnant magnetization saturates suggests the presence of magnetite/maghemite. The observation of a strong Verwey transition [28] at ca. 125 K in the TDR measurement of one of the two samples reported shown in Fig. 4 confirms that at least part of the measured magnetization in that sample is due to magnetite. Measurement on the other samples were a lot noisier and inconclusive because of a low signal. Maghemite, a ferric iron oxide with magnetic properties similar to magnetite, is generally formed via the oxidation of ferrous iron in magnetite and could be responsible for a possible absence of the Verwey transition in some of the samples.
Fig. 4.
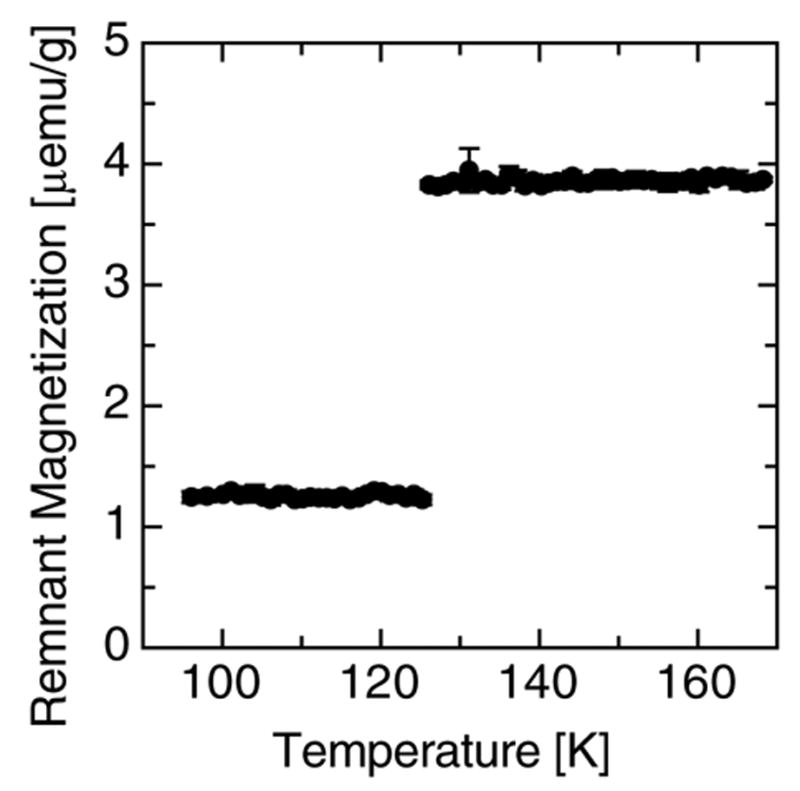
The thermal decay of remanence measured on patient 2 fraction 2, through the Verwey transition, in zero-field, and upon cooling; after having applied a field of 1 Tesla.
4. Discussion
While some of the magnetic measurement techniques employed here cannot unequivocally identify magnetite, the magnetization data is completely consistent with this iron oxide or its oxidation product, maghemite. In addition, the presence of the Verwey transition measured in one of the two samples is clearly indicative of magnetite. Therefore, the preliminary results reported here indicate that in Neuroferritinopathy, the malfunction of the ferritin light polypeptide appears to lead to the formation of SPM magnetite. The presence of magnetite may reduce the bioavailability of iron, and potentiate free radical production via the Fenton reaction and/or triplet state stabilization [4–6]. The characterization of intermediate magnetic iron compounds associated with the mineral bio-transformation of iron, which can lead to the formation of magnetite, in neurodegenerative disorders such as Neuroferritinopathy and others can be performed by SQUID magnetometry[13,24–26] and nuclear magnetic resonance[15,34]. Using such knowledge, it may be possible to develop new pulse sequences for MRI-based early diagnosis. This is particularly important for diseases such as Alzheimer’s, where treatments in development are aimed primarily at slowing or halting progression of the disease rather than reversing its effects. In this case, diagnosis and intervention at the earliest possible stage should lead to better treatment outcomes.
The coercivity data presented here, as well as TEM imaging conducted on magnetic extracts from hippocampal tissue [6,21], indicate that larger, blocked magnetite particles are present within the tissue as well. The origin of these remains unknown but they may grow from nucleation sites within ferritin followed by a breakdown of the protein shell. While in situ TEM analysis would help to clarify this conundrum, the low concentration of blocked magnetite in the tissue (on the order of –ng/g of wet tissue) means that finding them in tissue sections is not a trivial exercise. This is the main reason for the recent development of automated scanning techniques which employ micro-focused synchroton x-ray analysis [15,35].
Recent electron microscopy analysis of ferritin from Alzheimer’s tissue indicates that cubic, mixed-valence iron oxides may be forming within the protein related to pathogenesis [19,36]. This provides an indication that neuroferritinopathy may be a good model system for studying the effects of disruptions in ferritin function in other neurodegenerative diseases.
Although large crystals of biogenic magnetite have previously been observed [21] in the human brain, the origin of such large crystals remains unknown.
The presence of SPM magnetite in AD brain tissues has previously been reported and appears to originate from the biomineralization of the ferrihydrite core of Ferritin as a possible pathway for the formation of larger magnetite particles. [13,14,18–22] In this study, the presence of SPM magnetite is correlated with the amount of ferrihydrite suggesting that a malfunction of ferritin may play a role in the magnetite biomineralization process. Because of the rarity of the disease and the paucity of available data these results should be considered as preliminary at this stage.
Acknowledgments
This study was approved by the North Staffordshire Local Research Ethics Committee. JD is supported by a Wolfson Foundation – Royal Society Research Merit Award. The Newcastle Brain Tissue Resource is supported through funding from the Medical Research Council and the University of Newcastle Trustees.
Footnotes
Publisher's Disclaimer: This is a PDF file of an unedited manuscript that has been accepted for publication. As a service to our customers we are providing this early version of the manuscript. The manuscript will undergo copyediting, typesetting, and review of the resulting proof before it is published in its final citable form. Please note that during the production process errors may be discovered which could affect the content, and all legal disclaimers that apply to the journal pertain.
References
- 1.Chinnery PF. Gene Reviews. 2005 available at ( www.genetests.org) searching for ‘neuroferritinopathy’.
- 2.Curtis ARJ, Fey C, Morris CM, Bindoff LA, Ince PG, Chinnery PF, Coulthard A, Jackson MJ, Jackson AP, McHale DP, Hay D, Barker WA, Markham AF, Bates D, Curtis A, Burn J. Mutation in the gene encoding ferritin light polypeptide causes dominant adult-onset basal ganglia disease. Nature Genetics. 2001;28:350–354. doi: 10.1038/ng571. [DOI] [PubMed] [Google Scholar]
- 3.Chinnery PF, Curtis ARJ, Fey C, Coulthard A, Crompton D, Curtis A, Lombès A, Burn J. Neuroferritinopathy in a French family with late onset dominant dystonia. J Med Genet. 2003;40:e69. doi: 10.1136/jmg.40.5.e69. [DOI] [PMC free article] [PubMed] [Google Scholar]
- 4.Zhao G, Bou-Abdallah F, Arosio P, Levi S, Janus-Chandler C, Chasteen ND. Multiple Pathways for Mineral Core Formation in Mammalian Apoferritin. The Role of Hydrogen Peroxide. Biochemistry. 2003;42:3142–3150. doi: 10.1021/bi027357v. [DOI] [PubMed] [Google Scholar]
- 5.Schafer FQ, Qian SY, Buettner GR. Iron and free radical oxidations in cell membranes. Cell Mol Biol. 2000;46:657–662. [PMC free article] [PubMed] [Google Scholar]
- 6.Kirschvink JL, Kobayashi-Kirschvink A, Woodford BJ. Magnetite biomineralization in the human brain. Proc Natl Acad Sci USA. 1992;89:7683–7687. doi: 10.1073/pnas.89.16.7683. [DOI] [PMC free article] [PubMed] [Google Scholar]
- 7.Goodman L. Alzheimer’s disease—a clinicopathologic analysis of 23 cases with a theory on pathogenesis. J Nerv Ment Dis. 1953;118:97–130. [PubMed] [Google Scholar]
- 8.Kienzl E, Jellinger K, Stachelberger H, Linert W. Iron as catalyst for oxidative stress in the pathogenesis of Parkinson’s disease? life sciences 65. 1999;(18–19):1973–1976. doi: 10.1016/s0024-3205(99)00458-0. [DOI] [PubMed] [Google Scholar]
- 9.Bush AI. Metals and neuroscience, current opinion in chemical biology. 2000;4(2):184–191. doi: 10.1016/s1367-5931(99)00073-3. [DOI] [PubMed] [Google Scholar]
- 10.Lynch T, Cherny RA, Bush AI. Oxidative processes in Alzheimer’s disease: the role of A beta-metal interactions, experimental gerontology. 2000;35(4):445–451. doi: 10.1016/s0531-5565(00)00112-1. [DOI] [PubMed] [Google Scholar]
- 11.Ke Y, Xu RS, Chi LY, Luo C, Gozal D, Liu RG. Oxidative stress is associated with intermittent hypoxia-mediated apoptosis in cortical neuronal cells, free radical biology and medicine. 2003;35:S158–S158. 491 Suppl. 1. [Google Scholar]
- 12.Ke Y, Qian ZM. Iron misregulation in the brain: a primary cause of neurodegenerative disorders. lancet neurology. 2003;2(4):246–253. doi: 10.1016/s1474-4422(03)00353-3. [DOI] [PubMed] [Google Scholar]
- 13.Hautot D, Pankhurst QA, Khan N, Dobson J. Preliminary evaluation of nanoscale biogenic magnetite in Alzheimer’s disease brain tissue. Proc R Soc Lond B. 2003;270:S62–S64. doi: 10.1098/rsbl.2003.0012. [DOI] [PMC free article] [PubMed] [Google Scholar]
- 14.Collingwood JF, Mikhaylova A, Davidson M, Batich C, Streit WJ, Terry J, Dobson J. In situ characterization and mapping of iron compounds in Alzheimer’s disease tissue. Journal of Alzheimer’s Disease. 2005;7:267–272. doi: 10.3233/jad-2005-7401. [DOI] [PubMed] [Google Scholar]
- 15.Gossuin Y, Hautot D, Muller RN, Pankhurst Q, Dobson J, Morris C, Gillis P, Collingwood J. Looking for biogenic magnetite in brain ferritin using NMR relaxometry. NMR in Biomedicine. 2005;18(7):469–472. doi: 10.1002/nbm.983. [DOI] [PubMed] [Google Scholar]
- 16.Smith MA, Harris PLR, Sayre LM, Perry G. Iron accumulation in Alzheimer’s disease is a source of redox-generated free radicals. Proc Natl Acad Sci USA. 1997;94:9866–9868. doi: 10.1073/pnas.94.18.9866. [DOI] [PMC free article] [PubMed] [Google Scholar]
- 17.Sayre LM, Perry G, Harris PLR, Liu YH, Schubert KH, Smith MA. In situ oxidative catalysis by neurofibrillary tangles and senile plaques in Alzheimer’s disease: A central role for bound transition metals. J Neurochem. 2000;74:270–279. doi: 10.1046/j.1471-4159.2000.0740270.x. [DOI] [PubMed] [Google Scholar]
- 18.Quintana C, Lancin M, Marhic C, Pérez M, Martin-Benito J, Avila J, Carrascosa JL. Initial studies with high resolution TEM and electron energy loss spectroscopy studies of ferritin cores extracted from brains of patients with progressive supranuclear palsy and Alzheimer disease. Cell Mol Biol. 2000;46(4):807–820. [PubMed] [Google Scholar]
- 19.Quintana C, Cowley JM, Marhic C. Electron nanodiffraction and high-resolution electron microscopy studies of the structure and composition of physiological and pathological ferritin. Journal of Structural Biology. 2004;147:166–178. doi: 10.1016/j.jsb.2004.03.001. [DOI] [PubMed] [Google Scholar]
- 20.Hautot D, Pankhurst QA, Dobson J. Superconducting Quantum Interference Device Measurements of Dilute Magnetic Materials in Biological Samples. Review of Scientific Instruments. 2005;76:45101–45104. [Google Scholar]
- 21.Dobson J. Nanoscale biogenic iron oxides and neurodegenerative disease. FEBS letters. 2001;496:1–5. doi: 10.1016/s0014-5793(01)02386-9. [DOI] [PubMed] [Google Scholar]
- 22.Dobson J. Magnetic iron compounds in neurological disorders. Annals of the New York Academy of Sciences. 2004;1012:183–192. doi: 10.1196/annals.1306.016. [DOI] [PubMed] [Google Scholar]
- 23.Dobson J, Grassi P. magnetic properties of human hippocampal tissue-evaluation of artefact and contamination sources. Brain research bulletin. 1996;39:255–259. doi: 10.1016/0361-9230(95)02132-9. [DOI] [PubMed] [Google Scholar]
- 24.Dubiel SM, Zablotna-Rypien B, Mackey JB, Williams JM. Magnetic properties of human liver and brain ferritin. Eur Biophys J. 1999;28:263–267. doi: 10.1007/s002490050208. [DOI] [PubMed] [Google Scholar]
- 25.Makhlouf SA, Parker FT, Berkowitz AE. Magnetic hysteresis anomalies in ferritin. Phys Rev B. 1997;55(R14):717–720. [Google Scholar]
- 26.Gilles C, Bonville P, Wong KKW, Mann S. Non-Langevin behaviour of the uncompensated magnetization in nanoparticles of artificial ferritin. Eur Phys J B. 2000;17:417–427. [Google Scholar]
- 27.Collingwood J, Dobson J. Mapping and characterization of iron compounds in Alzheimer’s tissue. Journal of Alzheimer’s Disease. doi: 10.3233/jad-2006-102-308. In Press. [DOI] [PubMed] [Google Scholar]
- 28.Waltz F. The Verwey transition - a topical review. J Phys Condens Matter. 2002;14:R285–R340. [Google Scholar]
- 29.Morales MP, Veintemillas-Verdaguer S, Montero MI, Serna CJ, Roig A, Casas L, Martínez B, Sandiumenge F. Surface and Internal spin canting in γ-Fe2O3 nanoparticles’ of M.P. Chemistry of Materials. 1999;11:3058–3064. [Google Scholar]
- 30.Cullity BD. Introduction to magnetic materials. p. 413. dB3 p/6 = 25 k T/ with K = 1.35 105 erg/cm3. [Google Scholar]
- 31.Pankhurst QA, Pollard RJ. Fine particle magnetic oxides. J Phys Condens Matter. 1993;5:8487–8508. [Google Scholar]
- 32.Néel L. Theorie des proprietes magnetiques des grains fins antiferromagnetiques: superparamagnetisme et superantiferromagnetisme. pp. 412–440. [Google Scholar]
- 33.Cisowski S. Interacting vs noninteracting single domain behaviour in natural and synthetic samples. Earth Planet Sci Lett. 1982;26:56–62. [Google Scholar]
- 34.Gossuin Y, Muller RN, Gillis P. Relaxation induced by ferritin: a better understanding for an improved MRI iron quantification. NMR Biomed. 2004;17:427–432. doi: 10.1002/nbm.903. [DOI] [PubMed] [Google Scholar]
- 35.Mikhailova A, Davidson M, Channel JET, Guyodo Y, Batich C, Dobson J. Detection, Identification and Mapping of Iron Anomalies in Brain Tissue Using X-Ray Absorption Spectroscopy. J Royal Soc: Interface. 2005;2:33–37. doi: 10.1098/rsif.2004.0011. [DOI] [PMC free article] [PubMed] [Google Scholar]
- 36.Quintana C, Bellefqih S, Laval JY, Guerquin-Kern JL, Wu TD, Avila J, Ferrer I, Arranz R, Patino C. Study of the localization of iron, ferritin, and hemosiderin in Alzheimer’s disease hippocampus by analytical microscopy at the subcellular level. J Struct Bio. 2006;153(1):42–54. doi: 10.1016/j.jsb.2005.11.001. [DOI] [PubMed] [Google Scholar]