

Abstract
Purpose
The measurement reproducibility of the third generation of commercial optical coherence tomography, OCT-3 (StratusOCT, software ver. A2, Carl Zeiss Meditec Inc., Dublin, CA) was investigated. The nerve fiber layer (NFL) thickness, macula thickness map, and optic nerve head (ONH) parameters in normal eyes were studied.
Methods
Ten normal subjects were imaged six times (three before and three after dilation) per day, and the series was repeated on three different days. The order of the scans before pupil dilation was randomized in each of the 3 days of scanning. After pupil dilation, the scans were also randomized in each of the 3 days of scanning. Each series was performed separately for standard-density (128 A-scans per macular and ONH image and 256 A-scans per NFL image) and high-density (512 A-scans per image for all three scan types) scanning.
Results
The mean macular thickness was 235 ± 9.8 μm. A-scan density (or image acquisition speed) had a statistically significant effect (P < 0.05) on the reproducibility of the mean macular thickness, macular volume, and a few sectors of the macular map. No significant dilation effect was found for any of the macular parameters. The best intraclass correlation coefficient (ICC; 94%) for macular scans was found for dilated high-density scanning, with an intervisit SD of 2.4 μm and an intravisit SD of 2.2 μm. The mean NFL thickness for standard scanning was 98 ± 9 μm. NFL reproducibility showed mixed results and had interactions between scan density and dilation for some parameters. For most of the NFL parameters, reproducibility was better with dilated standard-density scanning. The mean NFL thickness ICC for dilated standard scanning was 79%, with an intervisit SD of 2.5 μm and an intravisit SD of 1.6 μm. For the ONH analysis, the reproducibility was better for dilated standard-density scanning for almost all the parameters, except for disc area, horizontal integrated rim volume, and vertical integrated rim area, which were better before dilation. The best reproducibility was found for cup-to-disc ratio (ICC = 97%, with intervisit SD of 0.04 μm and intravisit SD of 0.02 μm).
Conclusions
StratusOCT demonstrated reproducible measurements of NFL thickness, macular thickness, and optic nerve head parameters. The best reproducibility was found for dilated standard scanning for NFL and ONH parameters and for dilated high-density scanning for macular parameters.
Optical coherence tomography (OCT) is a noninvasive technique for high-resolution, cross-sectional tomographic imaging of tissue by measuring backscattered light.1 OCT imaging is analogous to ultrasound B-mode imaging but uses light instead of sound. From multiple axial scans (A scans) at different transverse locations, a two-dimensional, cross-sectional image can be obtained. The advantage of OCT imaging is its high resolution, which is on the order of 10 to 15 μm in the axial direction.1–3 OCT has been demonstrated to be a valuable technique for detection and monitoring of a variety of macular diseases4–8 as well as glaucoma.9–11
In a previous studies, the reproducibility of measurements obtained with the first prototype OCT instrument11 and with the first generations of commercial OCT instruments was investigated.12–17 These devices acquired 100 (transverse) × 250 (axial) data points per image in the prototype version, and 100 (transverse) × 500 (axial) data points per image in the first and second generation of OCT acquired in 1 second.1,3,5,9,18 These studies showed that the OCT technology provides reproducible measurements of the thickness of the retinal layers. Recently, a third-generation OCT (StratusOCT, Carl Zeiss Meditec, Dublin, CA) was introduced and is currently in clinical use. StratusOCT provides images with 8- to 10-μm axial resolution and a maximum of 512 transverse × 1024 axial data points per image acquired in 1.25 seconds, as described in the user manual of the StratusOCT. Compared with previous generations of OCT systems, StratusOCT allows more A-scans to be acquired for increased image resolution. Increasing the number of A-scans produces an image with a high transverse pixel density, resulting in a better image quality, but increases the image acquisition time, which could lead to measurement errors due to eye motion. Also, the individual scan alignment necessary in the high-density scanning may introduce further errors due to the scan repositioning.
An essential quality in determining the utility of a device for clinical use is its measurement reproducibility. The goal of our present study was to determine the reproducibility of macular and nerve fiber layer (NFL) thickness, and optic nerve head (ONH) measurements obtained with OCT-3 in normal human eyes before and after pupil dilation. We also investigated the effect of different A-scan densities on the reproducibility of the measurements.
MATERIALS AND METHODS
Subjects
After obtaining appropriate informed consent approved by the Tufts-New England Medical Center Institutional Review Board, and according to the Declaration of Helsinki, we examined one eye of each of 10 normal subjects. These subjects were recruited from the staff at the New England Eye Center, Tufts-New England Medical Center. The examined eye was randomly chosen for each subject. Only those subjects with no history or evidence of intraocular surgery, retinal disease or glaucoma, refractive error less than 8 D, and normal-appearing ONHs qualified as normal subjects.
Image and Data Processing
The OCT images were obtained using the StratusOCT, with a typical 2-mm deep, 6-mm wide image used for macular and optic disc scans and a 3.4-mm diameter circumpapillary image used for the NFL scans. The StratusOCT performed 400 A-scans per second and could generate OCT images composed of different numbers of A-scans. Imaging was performed at two different transverse scan densities: standard density (high-speed acquisition) and high density (lower-speed acquisition). For each session, the scans were aligned guided by the fundus image provided by the OCT system. The OCT system did not allow additional alignment between visits. The macular scan is composed of six linear scans centered at the fovea equally spaced 30° apart. The ONH scan is similarly obtained from six linear scans centered on the ONH. For the NFL scans, three consecutive circles, with a diameter of 3.4 mm,11 centered on the ONH were acquired. All the standard scan types for the fast speed acquisition were attained simultaneously. For high-density scan types, each scan (each of the six lines and each of the three circles) was acquired sequentially after the scanner was repositioned before each acquisition. Internal fixation was used for all scan types. A description of all the scans performed as well as the scanning parameters is presented in Table 1. The OCT images were automatically analyzed with the StratusOCT software (ver. A2; Carl Zeiss Meditec), to segment the retinal layers and quantitatively measure retinal morphology. Only good-quality scans with uniform OCT signal distribution along the entire image (an OCT expert examined the entire scan for uniform signal intensity along the highly reflective retinal layers such as NFL and RPE, as previously described Ishikawa H, et al. IOVS 2003;44:ARVO Abstract 3358) and without overt algorithm failure in detecting the retinal borders were included in the study.
Table 1.
Reproducibility Study StratusOCT Scanning Protocol
| Scan Type | Number/Type of Scans | Acquisition Time (s) | Scan Density (A-scans per scan) | |
|---|---|---|---|---|
| Fast Macular Thickness Map | 6 lines | 0.32/line | Standard density/fast acquisition | 128 |
| Fast RNFL Thickness (3.4) | 3 circles | 0.64/circle | 256 | |
| Fast Optical Disc | 6 lines | 0.32/line | 128 | |
| Macular Thickness Map | 6 lines | 1.28/line | High density/slow acquisition | 512 |
| RNFL Thickness (3.4) | 3 circles | 1.28/circle | 512 | |
| Optical Disc | 6 lines | 1.28/line | 512 | |
For the macular thickness map analysis an Early Treatment Diabetic Retinopathy Study (ETDRS)–like map was generated,19 and center foveal thickness and total macular volume were automatically determined by the OCT software and analyzed by using data from all six linear scans. The ETDRS-like map was made of nine sectoral thickness values in three concentric circles obtained from interpolation of the six linear scans, with diameters of 1, 3, and 6 mm (Fig. 1). The sectoral measurements in the retinal thickness map were calculated from the averaged data from the six individual scans.16 From the sectoral measurements of the macular thickness map, we also calculated the mean macular thickness.20 Considering the distribution of the OCT scanning pattern for the macula, we calculated weighted mean macular thickness as
Figure 1.
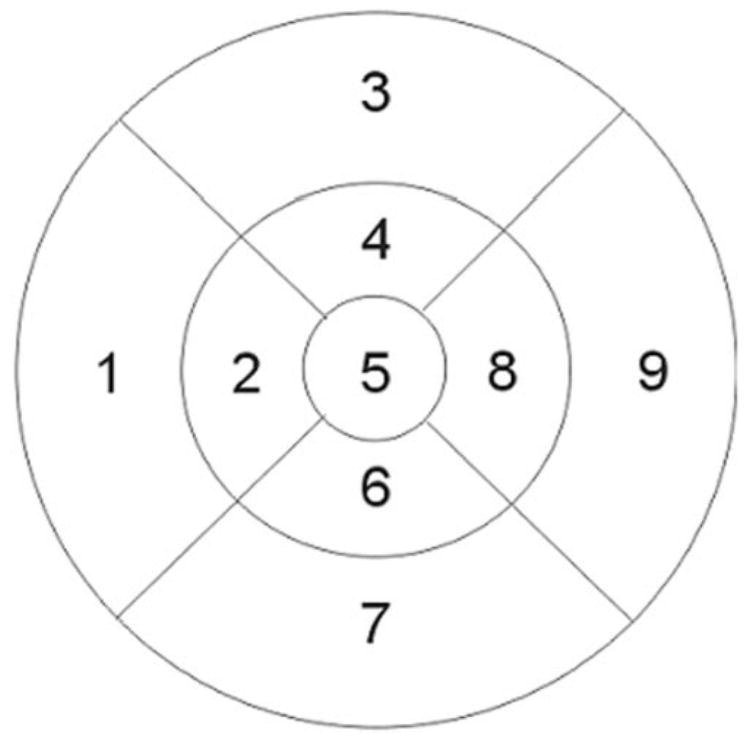
Macular map–sectoral thickness diagram. The diameters of the three concentric circles are 1, 3, and 6 mm, from center to outer circle, respectively.
where mac is the sector of the macular map and the numbers represent the sectoral area as follows: mac5, the center; mac2, -4, -6, and -8, the medial ring; and mac1, -3, -7, and -9, the outer ring (Fig. 1). All the macular measurements are given in micrometers, except the macular volume, which is in cubic millimeters.
From each circular scan for NFL thickness analysis, a mean NFL thickness, four quadrant NFL thicknesses and 12 clock-hour NFL thicknesses were generated automatically by the OCT software. For NFL thickness analysis, the three scans were analyzed independently, and the inter- and intravisit reproducibility was calculated.
ONH parameters were automatically derived by the OCT software from the six linear scans.18,21 The machine automatically determined the edge of the ONH as the end of the retinal pigment epithelium (RPE)–choriocapillaris layer. A straight line connected the edges of the RPE–choriocapillaris, and a parallel line was aligned 150 μm anteriorly. Structures below this line were defined as the disc cup, and above this line was the neuroretinal rim. For definition of 10 global parameters, automatically determined by StratusOCT that were included in the reproducibility study, see Table 5.
Table 5.
Mean ONH parameters for Standard- and High-Density Scanning after Dilation.
| ONH Parameters | Standard-Density Fast Acquisition | High-Density Slow Acquisition |
|---|---|---|
| hirw (mm3) | 1.77 ± 0.28 | 1.72 ± 0.32 |
| vira (mm2) | 0.55 ± 0.39 | 0.50 ± 0.36 |
| da (mm2) | 2.19 ± 0.35 | 2.12 ± 0.36 |
| ca (mm2) | 0.70 ± 0.57 | 0.61 ± 0.51 |
| ra (mm2) | 1.49 ± 0.65 | 1.52 ± 0.58 |
| cdr | 0.33 ± 0.26 | 0.29 ± 0.22 |
| cdh | 0.55 ± 0.20 | 0.52 ± 0.19 |
| cdv | 0.51 ± 0.21 | 0.48 ± 0.19 |
| cat | 0.98 ± 0.84 | 1.02 ± 0.60 |
| cvt | 0.12 ± 0.14 | 0.12 ± 0.11 |
The parameters are horizontal integrated rim width (area) defined as hirw, vertical integrated rim area (volume) as vira, disc area as da, cup area as ca, rim area as ra, cup/disc area ratio as cdr, cup/disc horizontal ratio as cdh, cup/disc vertical ratio as cdv, cup area (topo) as cat, cup volume (topo) as cvt. n = 10.
Study Protocol
Ten normal subjects, were scanned three consecutive times on the first day (three sessions) with each of the following: macular scans, NFL scans, and ONH scans before dilation and three additional times for each scan type after dilation. Similarly, all the subjects were scanned on two additional days within 5 months. The order of the undilated scans of all types and the order of the dilated scans for each subject was randomized in each of the 3 days of scanning and among days. Each eye was scanned with both standard- and high-density scanning in each of the 3 days of the scanning. The order of the standard and high-density scans was also randomized per day and among days.
Statistical Analysis
Only one eye per subject was included in this study. The eyes were analyzed, adjusting them so that the macular map sectors and the clock hours for NFL could be appropriately assessed. In macula tables, sectors 1 and 2 represented the nasal quadrant and 8 and 9 represented the temporal quadrant. In the NFL tables for clock hours, 1:00 to 5:00 represented the nasal clock hours and 7:00 to 11:00 represented the temporal clock hours. All data presented (all OCT macular, NFL, and ONH parameters described earlier for all sessions, all days, and all the subjects imaged in the study) were age corrected, although age was not a statistically significant parameter for all variables.
Age-adjusted variance components analysis with random-effects mixed models were used to determine intraclass correlation coefficients (ICCs) and intervisit (within-subject between-dates) and intra-visit (within-subject within-date) standard deviations as measures of reproducibility. As four of these models did not converge because of low variance in our data set (cells marked with * in Table 6), variance components models that did not adjust for age were used to determine the ICCs and the SDs in question. In all models, the measured parameter given by OCT was considered to have three variance components: intersubject, intervisit, and intravisit. The ICC was the ratio of the intersubject component of the variance to the total variance. We calculated the intersubject standard deviation by taking the square root of the intersubject component of variance and the intrasubject standard deviation by taking the square root of the residual, or error, component of the variance.
Table 6.
Summary of ONH Parameters
| Standard-Density Fast Acquisition
|
High-Density Slow Acquisition
|
||||||
|---|---|---|---|---|---|---|---|
| Measurement | Dilated | ICC (%) | Intervisit SD (μm) | Intravisit SD (μm) | ICC (%) | Intervisit SD (μm) | Intravisit SD (μm) |
| hirw (mm3) | 89 | 0.03 | 0.09 | 85 | 0.07 | 0.10 | |
| vira (mm2) | 94 | 0.03 | 0.06 | 92 | 0.04 | 0.08 | |
| da (mm2) | 66 | 0.13 | 0.23 | 59 | 0.17 | 0.18 | |
| ca (mm2) | 82* | 0.01* | 0.21* | 56 | 0.07 | 0.35 | |
| ra (mm2) | 73 | 0.11 | 0.29 | 30† | 0.31 | 0.33 | |
| NO | |||||||
| cdr | 78 | 0.01 | 0.11 | 48 | 0.11 | 0.11 | |
| cdh | 76* | 0.02* | 0.10* | 21† | 0.09 | 0.10 | |
| cdv | 67 | 0.01 | 0.10 | 24† | 0.10 | 0.11 | |
| cat | 65 | 0.34 | 0.38 | 30† | 0.25 | 0.59 | |
| cvt | 60 | 0.01 | 0.10 | 54 | 0.02 | 0.10 | |
| hirw (mm3) | 74 | 0.13 | 0.08 | 73 | 0.14 | 0.12 | |
| vira (mm2) | 51 | 0.28 | 0.08 | 58 | 0.20 | 0.15 | |
| da (mm2) | 52 | 0.21 | 0.14 | 38† | 0.23 | 0.19 | |
| ca (mm2) | 95 | 0.10 | 0.06 | 28† | 0.30 | 0.28 | |
| ra (mm2) | 81 | 0.27 | 0.12 | 3† | 0.48 | 0.27 | |
| YES | |||||||
| cdr | 97 | 0.04 | 0.02 | 19† | 0.15 | 0.11 | |
| cdh | 87 | 0.06 | 0.03 | 12† | 0.13 | 0.10 | |
| cdv | 90 | 0.06 | 0.03 | 14† | 0.12 | 0.10 | |
| cat | 45 | 0.41 | 0.48 | 6† | 0.26 | 0.49 | |
| cvt | 84 | 0.04 | 0.04 | 81* | 0.02* | 0.05* | |
Data are for standard- and high-density, before and after dilation. The parameters represented are defined in Table 5. Age-adjusted random effects models were used to calculate ICCs and SDs. As four of these models did not converge due to low variance in our data (cells marked by *), variance components models that did not adjust for age were used to determine the ICCs and SDs in question.
Low ICC values, below 40%.
Mixed models were also used to evaluate the effect of dilation and scan density on the reproducibility for each retinal and NFL thickness and ONH parameter separately. Each model was adjusted for age. Random effects were used to adjust for the fact that subjects’ eyes were scanned multiple times per day, on multiple days, both dilated and undilated, and with both standard- and high-density scanning. We used the thickness measurements for each NFL and macula parameter and the value for each ONH measure as our dependent (outcome) variables. Possible interactions between scanning density and dilation status were tested by including the interaction term and the two main effects in the model. These analyses were performed separately on each of the 12 macular thicknesses, 17 NFL thicknesses, and 10 ONH thicknesses, with the thickness parameter used as the dependent variable, and dilation, scan density, their interaction, and age as the independent variables. If the interaction was significant, no further analysis was performed. If the interaction was not significant, the main effects of density and dilation were tested for significance. For all analyses statistical software was used (Proc Mixed feature; SAS ver. 8; SAS Institute, Cary, NC). The effects and interactions were considered statistically significant at P < 0.05. In our mixed model, we did not consider a variance component for scanner-repositioning error in high-density scanning, but this error was considered to be indirectly part of the measurement’s variability reported as SD.
RESULTS
Subject Characteristics
We studied 10 eyes of 10 normal subjects. The mean age was 30.5 ± 7.4 (range, 23–43) years. There were four women and six men. Eight subjects were white. OCT was well tolerated by all subjects on all visits.
Included and Excluded Scans
One scan session was excluded from the macular analysis and two scan sessions from the NFL analysis due to algorithm failure. One NFL session was excluded due to poor scan quality. One subject was excluded from ONH analysis due to elevation of the optic disc in a hypermetropic eye.
In all NFL scans the NFL thickness profiles had the characteristic double-hump pattern previously described as the normal NFL pattern.9,12,22 In all ONH scans used in this study, the automated detection of the RPE ends of each of the ONH scans was performed correctly by StratusOCT without the need for operator intervention.
Macular Thickness
There was no effect of scan density or dilation on measured overall macular thickness. The difference between before and after dilation was less than 2 μm for all parameters except sector 5 (the central sector), which was 4 μm. Selected results for mean macular thickness are presented in Table 2, and the corresponding sectoral results are presented in Figure 2. A summary of the ICCs and SDs for mean macular thickness, macular volume, and sectoral analysis is presented in Table 3.
Table 2.
Mean Macular Thickness and Volume, and Mac5
| Standard-Density Fast Acquision
|
High-Density Slow Acqusition
|
|||
|---|---|---|---|---|
| Measurement | Before Dilation | After Dilation | Before Dilation | After Dilation |
| Mean macular thickness (μm) | 236.0 ± 9.8 | 235.6 ± 9.8 | 234.2 ± 10.1 | 235.0 ± 9.8 |
| Total macular volume (mm3) | 6.67 ± 0.3 | 6.66 ± 0.3 | 6.62 ± 0.3 | 6.64 ± 0.3 |
| mac 5 (μm) | 201.8 ± 19.5 | 205.9 ± 20.9 | 200.2 ± 19.0 | 203.8 ± 19.5 |
| Center foveal thickness (μm) | 169.1 ± 23.9 | 177.7 ± 28.7 | 158.0 ± 21.6 | 163.6 ± 20.8 |
Data represent the thickness of the central area of the macular map and center foveal thickness for all 10 normal subjects, for standard and high-density scanning, before and after dilation.
Figure 2.
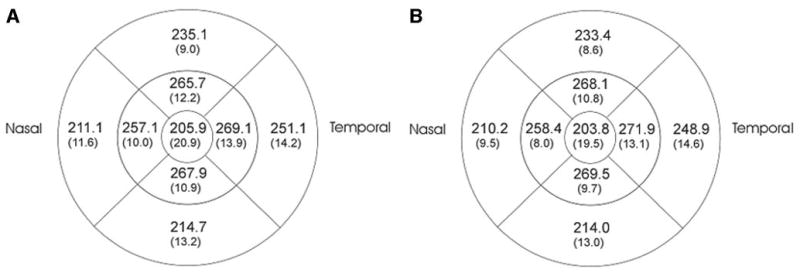
Sectoral macular thicknesses (μm) overall for the 10 normal subjects, after dilation, for standard-density scanning (A), and high-density scanning (B). The numbers in parentheses represent standard deviations.
Table 3.
Summary Table for Overall Mean Macular Thickness Parameters
| Standard-Density Fast Acquisition
|
High-Density Slow Acquisition
|
||||||
|---|---|---|---|---|---|---|---|
| Measurement | Dilated | ICC (%) | Intervisit SD (μm) | Intravisit SD (μm) | ICC (%) | Intervisit SD (μm) | Intravisit SD (μm) |
| Mean mac | 86 | 3.14 | 3.70 | 92 | 3.02 | 2.28 | |
| Mac 1 | 84 | 2.11 | 3.72 | 88 | 2.97 | 2.71 | |
| Mac 2 | 73 | 1.53 | 4.77 | 35 | 4.20 | 11.72 | |
| Mac 3 | 52 | 7.23 | 4.38 | 71 | 5.42 | 2.82 | |
| Mac 4 | 64 | 3.93 | 7.87 | 90 | 2.78 | 3.02 | |
| Mac 5 | NO | 83 | 8.14 | 4.84 | 91 | 6.00 | 3.57 |
| Mac 6 | 83 | 1.70 | 5.04 | 90 | 2.65 | 2.82 | |
| Mac 7 | 89 | 3.30 | 3.82 | 86 | 5.16 | 2.42 | |
| Mac 8 | 85 | 3.45 | 5.24 | 94 | 2.46 | 3.50 | |
| Mac 9 | 92 | 3.96 | 4.73 | 96 | 3.18 | 2.89 | |
| Mac vol | 86 | 0.09 | 0.11 | 93 | 0.08 | 0.06 | |
| Mean mac | 88 | 3.44 | 2.71 | 94 | 2.42 | 2.22 | |
| Mac 1 | 69 | 3.77 | 5.98 | 90 | 2.31 | 2.83 | |
| Mac 2 | 55 | 5.88 | 5.12 | 87 | 2.22 | 3.33 | |
| Mac 3 | 57 | 4.97 | 3.82 | 65 | 4.97 | 2.94 | |
| Mac 4 | 61 | 6.39 | 6.51 | 86 | 4.25 | 3.42 | |
| Mac 5 | YES | 77 | 8.51 | 7.78 | 90 | 6.81 | 3.83 |
| Mac 6 | 60 | 6.19 | 5.59 | 89 | 3.18 | 3.32 | |
| Mac 7 | 88 | 4.49 | 3.29 | 92 | 3.70 | 2.93 | |
| Mac 8 | 81 | 5.86 | 5.03 | 93 | 2.12 | 4.20 | |
| Mac 9 | 97 | 1.48 | 3.43 | 95 | 2.51 | 3.67 | |
| Mac vol | 88 | 0.10 | 0.08 | 94 | 0.07 | 0.06 | |
Data are for standard and high-density scanning, before and after dilation. All the macular SD measurements are given in micrometers except the macular volume, which is in cubic millimeters. Sectors named mac1 and -2 represent the nasal side of the macula, mac3 and -4 the superior side, mac5 the center macula, mac6 and -7 the inferior side, and mac8 and -9 the inferior side.
The center foveal thickness standard scanning showed higher values than high-density scanning. Moreover, central foveal thickness was higher after dilation than before dilation. The ICCs for central foveal thickness measurements were 28% to 71% and the SDs were 6 to 21 μm. The best reproducibility for center foveal thickness was found for undilated high-density scanning, with the highest ICCs (71%) and lowest SDs (intravisit SD = 6 μm and intervisit SD = 12 μm).
Standard Density
The ICC for the mean macular thickness after dilation (88%) was only 2% higher than before dilation. The results were similar for macular volume (Table 3). The ICCs before dilation for macular sectors (range, 51%–92%) were 3% to 18% higher than after dilation, except for the macular sectors mac3 and -9 (Table 3). In general, intervisit and intravisit SDs were similar before and after dilation, ranging from 1 to 8 μm.
High Density
The ICC for mean macular thickness was slightly higher after dilation (ICC = 94%). Sectoral measurements showed similar ICCs and SDs before and after dilation, with ICCs 1% to 6% higher before dilation (range, 65%–96%), and the intra- and intervisit SDs of 1 to 7 μm, except for the sectors mac1, -2, and -7 (Table 3).
Density and Dilation Effects
In our data set, we found no statistically significant interactions between scan density and dilation effects on reproducibility. Density had a considerable effect on the reproducibility results for mean macula and total volume and for sectors mac3, -4, -8, and -9. Thus, with higher ICCs and lower SDs, the high-density scanning showed considerably better reproducibility of macular thickness parameters.
RNFL Thickness
The overall mean NFL thickness was higher for the standard-density scanning (98–99 ± 9 μm) than the high-density scanning (94 ± 8 μm) both before and after dilation. The overall quadrant and clock hour values after dilation for both standard-and high-density scanning are presented in Figure 3. Inter- and intravisit SDs for NFL quadrants and clock hours with both standard- and high-density scanning, before dilation, are presented in Table 4 and Figure 4 and after dilation in Table 4 and Figure 5.
Figure 3.
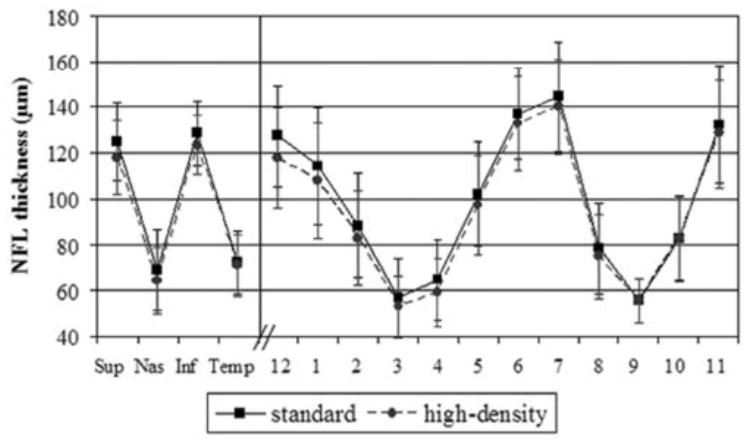
Mean (SD) quadrant and clock hour NFL thicknesses, after dilation, for standard, and high-density scanning.
Table 4.
Summary Table for Nonaveraged NFL Data
| Standard-Density Fast Acquisition
|
High-Density Slow Acquisition
|
||||||
|---|---|---|---|---|---|---|---|
| Measurement | Dilated | ICC (%) | Intervisit SD (μm) | Intravisit SD (μm) | ICC (%) | Intervisit SD (μm) | Intravisit SD (μm) |
| Mean NFL | 83 | 2.68 | 0.93 | 79 | 2.91 | 0.54 | |
| NFL superior | 79 | 4.39 | 2.18 | 78 | 4.68 | 3.75 | |
| NFL inferior | 62 | 5.75 | 3.40 | 71 | 3.96 | 1.32 | |
| NFL nasal | 67 | 8.20 | 2.48 | 60 | 10.21 | 1.23 | |
| NFL temporal | 81 | 4.50 | 1.98 | 80 | 3.26 | 2.85 | |
| 12 o’clock | 73 | 5.35 | 3.73 | 76 | 5.51 | 4.95 | |
| 1 o’clock | 83 | 6.37 | 2.33 | 77 | 7.29 | 4.63 | |
| 2 o’clock | 66 | 10.90 | 3.80 | 53 | 14.56 | 2.79 | |
| 3 o’clock | NO | 66 | 8.16 | 1.47 | 64 | 9.58 | 0.40 |
| 4 o’clock | 54 | 7.43 | 2.44 | 54 | 7.79 | 1.35 | |
| 5 o’clock | 79 | 8.17 | 3.04 | 82 | 5.31 | 3.63 | |
| 6 o’clock | 53 | 9.61 | 5.26 | 65 | 5.61 | 3.56 | |
| 7 o’clock | 77 | 5.67 | 3.67 | 66 | 6.65 | 4.19 | |
| 8 o’clock | 77 | 4.59 | 3.10 | 79 | 3.27 | 3.03 | |
| 9 o’clock | 72 | 3.73 | 1.71 | 63 | 3.59 | 2.36 | |
| 10 o’clock | 78 | 7.13 | 2.41 | 78 | 5.70 | 3.64 | |
| 11 o’clock | 84 | 6.72 | 4.32 | 80 | 5.92 | 5.04 | |
| Mean NFL | 79 | 2.49 | 1.55 | 79 | 2.67 | 0.51 | |
| NFL superior | 75 | 5.96 | 3.12 | 73 | 5.89 | 3.83 | |
| NFL inferior | 71 | 4.34 | 2.90 | 65 | 5.53 | 1.23 | |
| NFL nasal | 75 | 3.69 | 4.06 | 68 | 4.07 | 2.02 | |
| NFL temporal | 84 | 4.07 | 1.59 | 79 | 3.51 | 2.60 | |
| 12 o’clock | 70 | 8.07 | 3.82 | 74 | 7.61 | 4.57 | |
| 1 o’clock | 79 | 7.34 | 5.08 | 78 | 7.54 | 4.70 | |
| 2 o’clock | 72 | 6.01 | 4.93 | 67 | 6.98 | 2.58 | |
| 3 o’clock | YES | 72 | 3.29 | 3.78 | 64 | 4.32 | 2.25 |
| 4 o’clock | 62 | 4.22 | 3.60 | 51 | 4.56 | 3.15 | |
| 5 o’clock | 74 | 6.97 | 2.30 | 75 | 4.43 | 1.15 | |
| 6 o’clock | 52 | 7.94 | 4.96 | 58 | 8.35 | 2.69 | |
| 7 o’clock | 77 | 7.62 | 3.13 | 72 | 7.11 | 2.96 | |
| 8 o’clock | 71 | 8.64 | 1.66 | 75 | 4.13 | 3.26 | |
| 9 o’clock | 75 | 2.77 | 1.32 | 71 | 2.81 | 1.88 | |
| 10 o’clock | 85 | 3.47 | 2.31 | 76 | 5.34 | 3.66 | |
| 11 o’clock | 84 | 5.83 | 3.50 | 80 | 6.68 | 4.08 | |
Data are for mean NFL thickness in quadrants for standard and high-density, before and after dilation. The three NFL scans in each scan session were not averaged.
Figure 4.
Inter- and intravisit SDs for nonaveraged NFL data, for quadrants and clock hours, standard- and high-density scanning, before dilation. Each of the individual NFL scans was considered for the analysis. Solid lines: intervisit SDs; dashed lines: intravisit SDs.
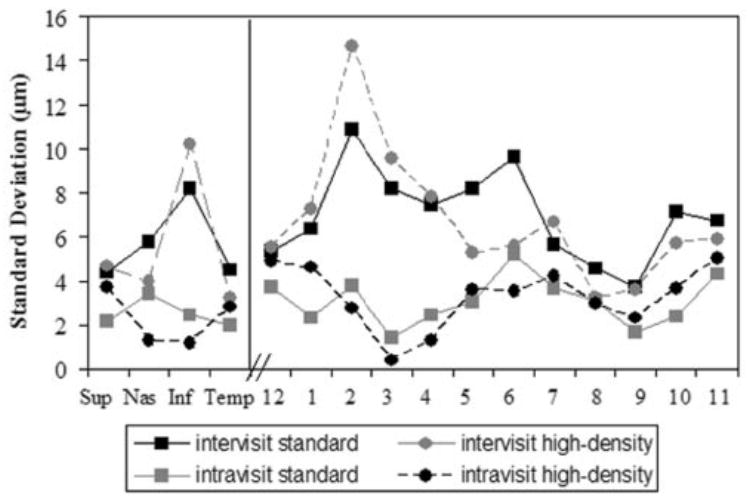
Figure 5.
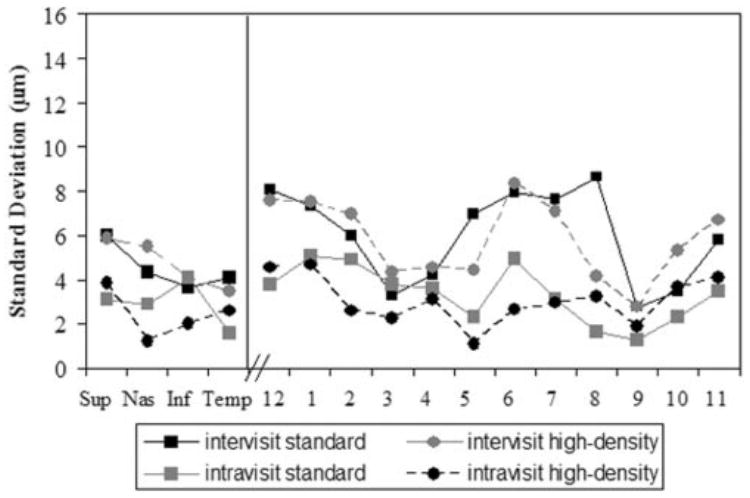
Inter- and intravisit SDs for NFL data, quadrants and clock hours, standard- and high-density scanning, after dilation. Each of the NFL scans was considered for the analysis. Solid lines: intervisit SDs; dashed lines: intravisit SDs.
Standard Density
Nasal and temporal quadrants showed the thinnest NFL (70 ± 15 μm), with similar values before and after dilation. Superior and inferior quadrants were thicker (126 ± 15 μm). Dilation had no effect on measured thickness in any of the NFL quadrants. The ICCs for mean NFL before and after dilation were similar (83% before dilation, 4% higher than after dilation). The ICCs for the NFL quadrants were higher after dilation, ranging between 71% and 84%, with the exception of the superior quadrant (ICC was 79% before and 75% after dilation).
High-Density
Nasal and temporal quadrants showed the thinnest NFL and had similar values before and after dilation (65–70 ± 14 μm). Superior and inferior quadrants were thicker (120 ± 15 μm). The ICC for the mean NFL before and after dilation was 79%. The ICCs for the NFL quadrants were higher before dilation, and the values ranged between 71% and 80%, except for the nasal quadrant (60% and 68% before and after dilation). The ICCs for the clock hour positions were inconsistent, with the highest either before or after dilation for the various clock hour positions (Fig. 5).
Density and Dilation Effects
The effects of density and dilation showed a statistically significant interaction (P < 0.05) for mean NFL, inferior quadrant, and clock hours 3, 4, 5, 6, 9, and 11. In the case of a statistically significant interaction, the effects of density and dilation must be described separately for each category: scan density and dilation. For parameters without interaction effects, the reproducibility tended to be better with dilated, standard scanning (Table 4), except for the superior quadrant, which was better with standard scanning before dilation. The effect of dilation and density on the NFL quadrants and clock hours was inconsistent. A density effect was found in all clock hours, except for clock hour 10. A dilation effect was found at clock hour positions 8, 10, and 12. The clock hour positions 1 and 7 showed no effect. The difference in the reproducibility between standard- and high-density scanning, before and after dilation, was not more than 9% for all the NFL parameters.
For both standard- and high-density scanning the quadrants and clock hours intravisit SDs were lower than the intervisit SDs (Figs. 4, 5). Most of the SDs for the quadrants and clock hours were lower after dilation than before dilation. The intra-visit SDs ranged between 1 and 5 μm before and after dilation and intervisit SDs ranged between 3 and 15 μm before dilation and 3 and 8 μm after dilation.
Mean NFL thickness from three consecutive scans (obtained as one value by averaging the three NFL scans per session) showed a 3% and 5% increase in ICCs, compared with nonaveraged mean NFL. For quadrants and clock hours, we noted in general a 3% and 13% increase in ICCs for the averaged NFL data compared with the nonaveraged data. The intervisit SDs were less than 1% lower and the intravisit SDs were 1% to 3% higher for the NFL averaged data than for the nonaveraged NFL data.
ONH Parameters
Mean results for all ONH parameters for dilated standard- and high-density scanning are presented in Table 5. Table 6 presents ICCs and SDs for standard- and high-density scanning before and after dilation. A noteworthy effect on reproducibility between standard- and high-density scanning was found only for the horizontal integrated rim volume and a dilation effect was found only for both vertical integrated rim area and cup volume (topo).
Standard Density
Mean values for the 10 ONH parameters did not show any difference between undilated and dilated scans. The reproducibility (ICCs) for standard density after dilation was best for most ONH parameters (Table 6). For disc area, horizontal integrated rim volume, vertical integrated rim area and cup area (topo) the ICC was highest for standard-density scanning, before dilation. Among all 10 ONH parameters, cup-to-disc area ratio (cdr) had the best ICCs (78% and 97% before and after dilation), and cup area (topo) (cat) the worst (65% and 45%).
High-Density
Reproducibility was better before than after dilation, but was markedly worse than for the standard-density scanning. The 10 ONH parameters did not show any difference between mean values before dilation (0.15–2.09) and after dilation (0.12–2.12). Among all 10 ONH parameters, the two parameters that had the highest ICCs were horizontal integrated rim width (area) (hirw) (85% and 73% before and after dilation) and vertical integrated rim area (volume) (vira) (92% and 58%). The lowest ICC was obtained for rim area (ra) (2.9% after dilation).
Density and Dilation Effects
Dilation and density showed mixed effects for ONH parameters, but no statistically significant interaction was found between the two. There was no dilation effect for any ONH parameters except vira, which showed better ICCs for standard scanning before dilation and for high-density scanning after dilation. No marked density effect was found for any ONH parameters except hirw, which showed a better ICC before dilation for both standard- and high-density scanning.
DISCUSSION
The third-generation commercial StratusOCT enables retinal thickness measurements with an axial resolution of 8 to 10 μm and with a higher axial sampling rate (1024 per A-scan), greater transverse sampling density (up to 512 per linear scan), and a faster A-scan rate (400 A-scans/s), which are major advantages over previous generations of this technology.1,3,5,9,18 The clinical utility of this instrument depends strongly on the reproducibility of its measurements. Consequently, the goal of this study was to characterize the reproducibility of the Stratus-OCT’s measurements.
In the young group of normal eyes in this study, OCT gave values for mean macular thickness of 235 ± 9.8 μm (Table 2), mean NFL thickness of 96 ± 9 μm (Fig. 3), disc area of 2.13 ± 0.4 μm, and cup area of 0.66 ± 0.5 μm (Table 5). High-density measurements for NFL thickness and ONH parameters tended to be lower than in standard-density scans, perhaps due to the higher accuracy of detection of the retinal posterior borders with the high-density scanning.
This study demonstrated that scan density and dilation must be considered when OCT is used as a diagnostic tool. Reproducibility was good for most of NFL, macula, and ONH parameters evaluated (standard-density scanning). All ICCs were greater than 50% for almost all measures (except high-density ONH), and most were in the 80% to 90% range or higher.
Reproducibility of the mean macular thickness and macular volume was not significantly affected by dilation. Mean macular thickness had the best ICC of 94%, intervisit SD of 2.4 μm, and intravisit SD of 2.2 μm for high-density dilated scanning (Table 3). In general, high-density scanning had higher ICCs and lower SDs, which are essential for accurate and reliable measurements of retinal thickness, perhaps because high-density scans allow more precise retinal border detection and segmentation. No effect of dilation on the reproducibility of macular parameters was found, probably either because fixation was easier for the subject in macular scans (primary gaze) than for NFL and ONH scans (nasal gaze) or because of the OCT software’s ability to detect retinal borders more easily on the well-defined and relatively uniform retinal features of the macular region.
Very different results were found for center foveal thickness with much higher SDs and lower ICCs than any other macular parameter. The best reproducibility for center foveal thickness was found for high-density before dilation (ICC = 71%) and lowest SDs (intravisit SD = 6 μm and intervisit SD = 12 μm). A similar trend was also noted for the center area of the macular map (mac5), which includes the foveal point. Massin et al.17 found average reproducibility of central foveal thickness of 11 μm in healthy subjects. This high variability is due to the large change in thickness between the foveal point and the thickest macula at the edge of the 1-mm center circle in the macular map. Therefore a small decentration of scans causes large variability in the measured thickness.
The NFL thickness analysis had inter- and intravisit SDs of 2 to 3 μm or less for mean thickness and 15 μm or less for each quadrant and clock hour (Table 4, Figs. 4, 5). There were interactions between scan density and dilation for some parameters. Reproducibility was best for dilated standard-density scanning. Similar results were found for nonaveraged and averaged NFL data and may indicate that good and reliable results can be obtained even for a single NFL scan, although further investigations are warranted.
The high-density scanning did not clearly show better reproducibility of the NFL measurements, contrary to the findings in the macular scan, perhaps because of the position of the scanned eye while the image was acquired. The macular scan is acquired in the primary-gaze position and thus is less prone to eye movement and scan placement variability. NFL scanning necessitates an eccentric fixation, which is more challenging for the scanned eye. Therefore, although the standard scanning provides a reduced number of sampling data it is balanced with a shorter acquisition duration that is less susceptible to eye movements.
For the ONH analysis, the reproducibility was best for dilated standard scanning for most parameters. The best reproducibility was found for cup-to-disc ratio (ICC = 97%, with intervisit SD = 0.04 μm and intravisit SD = 0.02 μm; Table 6). ONH reproducibility was best for standard scanning, probably because the fast acquisition of the OCT images are less affected by the eye movements and scan placement, which may be because of the eccentric fixation while acquiring the image, as explained earlier. The global ONH parameters are determined by interpolation from the six linear scans through the disc. These six lines may or may not be adequate for an accurate topographical map used for quantitative measurements (due to small sample density over this area). In this study, we used the commercial StratusOCT optic disc scanning procedure. The number of scans required or permitted for ONH topography is not variable. The evaluation of the appropriateness of this ONH mapping technique was beyond the scope of the present study; however, we have already reported the similarity in disease discrimination of the OCT and confocal scanning laser ophthalmoscopic ONH mapping.18
Koozekanani et al.15 showed intrasession variation of approximately 11 μm for overall macular thickness obtained with first-generation OCT. Our results for overall macular thickness showed best ICC of 94% and SD of 2.5 μm for dilated high-density scanning. The most recent publication regarding the reproducibility of the sectoral macular thickness map used the second generation of commercial OCT systems17 and found ICCs of 89% to 99% and SDs of 7 to 14 μm. We obtained ICCs of 86% to 95% and SDs of 2 to 6 μm in most sectors with dilated high-density scanning.
In a similar age group of normal subjects (mean age, 28 ± 5 years), a previous reproducibility study regarding NFL measurements with the prototype OCT,11 showed an ICC of 56% and SD of 10 to 20 μm for overall NFL thickness, an ICC of 24% to 64% and SD of 11 to 26 μm for quadrants, and ICC of 19% to 68% and SD of 11 to 30 μm for clock hours. A more recent publication by Jones et al.12 showed SD of 6 μm for mean NFL thickness, 10 μm for quadrants, and 11 μm for clock hours with OCT-2.
StratusOCT showed an SD of mean macular thickness measurements of 3 μm. The inter- and intravisit SDs were approximately 4 μm for mean NFL thickness, 7 μm for quadrants, and 1 to 15 μm for clock hours (Figs. 4, 5). The lower the standard deviations of the measurements, the smaller the changes in retinal thickness that can be measured accurately. We found that the reproducibility of the third generation of this technology significantly improved for mean NFL thickness (ICC of 79% on normal subjects) and mean macular thickness. This further emphasizes the ability of the OCT technology to measure small changes accurately, potentially resulting in earlier detection of disease or its progression before the onset of functional changes.
Study Advantages and Limitations
Although a direct comparison with previously published results cannot be made because the investigated subjects are not the same, our results in normal subjects of similar age show higher ICCs and lower SDs, which might indicate an improvement in the reproducibility of macular and NFL thickness measurements compared with previous generations of this technology.
Our results were obtained on a young normal group of subjects (30.5 ± 7 years). Caution should be used when applying these data to older subjects.
The protocol for standard scanning–fast acquisition (all six linear scans through macula or optic disc and the three circular scans for NFL acquired in a rapid automatic sequence) allows for decreased measurement variability, compared with high-density scanning–slow acquisition (each of the scans are acquired consecutively after manual repositioning), which is more susceptible to fixation problems, eye movements, and scanner placement by the operator. Therefore, the variability of high-density scanning measurements was higher probably because of the addition of an operator-induced variability component.
In addition, the scans were not aligned between visits because the OCT did not provide this feature. This adds to the intervisit variability, which is a limitation of the present study. If an additional variance component were included in the analysis due to the scan alignment variability, the intervisit variability of the OCT system might be smaller than reported herein.
For several parameters, the dilation and density effects on the reproducibility were not statistically significant. Although the differences between the dilated and undilated and standard- and high-density ICCs and SDs were not large, the lack of significance may be due to lack of power. Nevertheless, for this type of study, it is impractical to obtain a larger sample size, because no power calculation can be performed.
CONCLUSIONS
StratusOCT demonstrated reproducible measurements for NFL thickness, macular thickness, and optic nerve head parameters. The present study showed an improvement in reproducibility of the mean NFL thickness measurements with the Stratus OCT when compared with findings in studies of earlier generations of this technology.
Acknowledgments
Supported in part by National Eye Institute Grants R01-EY13178-04, R01-EY11289-16, and P30-EY13078, National Science Foundation ECS-0119452, the Air Force Office of Scientific Research Grant F49620-01-1-0184, the Medical Free Electron Laser Program F49620-01-1-0186, by a grant from the Massachusetts Lions Eye Research Fund Inc., and by Research to Prevent Blindness.
Footnotes
Disclosure: L.A. Paunescu, None; J.S. Schuman (P); L.L. Price, None; P.C. Stark, None; S. Beaton, None; H. Ishikawa, None; G. Wollstein, None; J.G. Fujimoto (P)
References
- 1.Huang D, Swanson EA, Lin CP, et al. Optical coherence tomography. Science. 1991;254:1178–1181. doi: 10.1126/science.1957169. [DOI] [PMC free article] [PubMed] [Google Scholar]
- 2.Swanson EA, Izatt JA, Hee MR, et al. In vivo retinal imaging by optical coherence tomography. Optics Letters. 1993;18:1864–1866. doi: 10.1364/ol.18.001864. [DOI] [PubMed] [Google Scholar]
- 3.Fercher AF, Hitzenberger CK, Drexler W, Kamp G, Sattmann H. In vivo optical coherence tomography. Am J Ophthalmol. 1993;116:113–114. doi: 10.1016/s0002-9394(14)71762-3. [DOI] [PubMed] [Google Scholar]
- 4.Puliafito CA, Hee MR, Lin CP, et al. Imaging of macular diseases with optical coherence tomography (OCT) Ophthalmology. 1995;102:217–229. doi: 10.1016/s0161-6420(95)31032-9. [DOI] [PubMed] [Google Scholar]
- 5.Hee MR, Puliafito CA, Wong C, et al. Quantitative assessment of macular edema with optical coherence tomography (OCT) Arch Ophthalmol. 1995;113:1019–1029. doi: 10.1001/archopht.1995.01100080071031. [DOI] [PubMed] [Google Scholar]
- 6.Hee MR, Puliafito CA, et al. Optical coherence tomography of macular holes. Ophthalmology. 1995;102:748–756. doi: 10.1016/s0161-6420(95)30959-1. [DOI] [PubMed] [Google Scholar]
- 7.Hee MR, Puliafito CA, Wong C, et al. Optical coherence tomography of central serous chorioretinopathy. Am J Ophthalmol. 1995;120:65–74. doi: 10.1016/s0002-9394(14)73760-2. [DOI] [PubMed] [Google Scholar]
- 8.Hee MR, Baumal CR, Puliafito CA, et al. Optical coherence tomography of age-related macular degeneration and choroidal neovascularization. Ophthalmology. 1996;103:1260–1270. doi: 10.1016/s0161-6420(96)30512-5. [DOI] [PubMed] [Google Scholar]
- 9.Schuman JS, Hee MR, Puliafito CA, et al. Quantification of nerve fiber layer thickness in normal and glaucomatous eyes using optical coherence tomography: a pilot study. Arch Ophthalmol. 1995;113:586–596. doi: 10.1001/archopht.1995.01100050054031. [DOI] [PubMed] [Google Scholar]
- 10.Schuman JS, Hee MR, Arya AV, et al. Optical coherence tomography: A new tool for glaucoma diagnosis. Curr Opin Ophthalmol. 1995;6:89–95. doi: 10.1097/00055735-199504000-00014. [DOI] [PubMed] [Google Scholar]
- 11.Schuman JS, Pedut-Kloizman T, Hertzmark E, et al. Reproducibility of nerve fiber layer thickness measurements using optical coherence tomography. Ophthalmology. 1996;103:1889–1898. doi: 10.1016/s0161-6420(96)30410-7. [DOI] [PMC free article] [PubMed] [Google Scholar]
- 12.Jones AL, Sheen NJ, North RV, Morgan JE. The Humphrey optical coherence tomography scanner: quantitative analysis and reproducibility study of the normal human retinal nerve fiber layer. Br J Ophthalmol. 2001;85:673–677. doi: 10.1136/bjo.85.6.673. [DOI] [PMC free article] [PubMed] [Google Scholar]
- 13.Blumenthal EZ, Williams JM, Weinreb RN, Girkin CA, Berry CC, Zangwill LM. Reproducibility of nerve fiber layer thickness measurements by use of optical coherence tomography. Ophthalmol. 2000;107:2278–2282. doi: 10.1016/s0161-6420(00)00341-9. [DOI] [PubMed] [Google Scholar]
- 14.Carpineto P, Ciancaglini M, Zuppardi E, Falconio G, Doronzo E, Mastropasqua L. Reliability of nerve fiber layer thickness measurements using optical coherence tomography in normal and glaucomatous eyes. Ophthalmology. 2003;110:190–195. doi: 10.1016/s0161-6420(02)01296-4. [DOI] [PubMed] [Google Scholar]
- 15.Koozekanani D, Roberts C, Katz SE, Herderick EE. Intersession repeatability of macular thickness measurements with the Humphrey 2000 OCT. Invest Ophthalmol Vis Sci. 2000;41:1486–1491. [PubMed] [Google Scholar]
- 16.Hee MR, Puliafito CA, Duker JS, et al. Topography of diabetic macular edema with optical coherence tomography. Ophthalmol. 1998;105:360–370. doi: 10.1016/s0161-6420(98)93601-6. [DOI] [PMC free article] [PubMed] [Google Scholar]
- 17.Massin P, Vicaut E, Haouchine B, Erginay A, Paques M, Gaudric A. Reproducibility of retinal mapping using optical coherence tomography. Arch Ophthalmol. 2001;119:1135–1142. doi: 10.1001/archopht.119.8.1135. [DOI] [PubMed] [Google Scholar]
- 18.Schuman JS, Wollstein G, Farra T, et al. Comparison of optic nerve head measurements obtained by optical coherence tomography and confocal scanning laser ophthalmoscopy. Am J Ophthalmol. 2003;135:504–512. doi: 10.1016/s0002-9394(02)02093-7. [DOI] [PubMed] [Google Scholar]
- 19.Early Treatment Diabetic Retinopathy Study Research Group. Photocoagulation for diabetic macular edema: Early Treatment Diabetic Retinopathy Study report number 1. Arch Ophthalmol. 1985;103:1796–1806. [PubMed] [Google Scholar]
- 20.Leder DE, Schuman JS, Hertzmark E, et al. Analysis of macular volume in normal and glaucomatous eyes using optical coherence tomography. Am J Ophthalmol. 2003;135:838–843. doi: 10.1016/s0002-9394(02)02277-8. [DOI] [PubMed] [Google Scholar]
- 21.Kulkarni MD, Harman JW, Kim R, et al. Automated optic-nerve-head analysis using optical coherence tomography. Proc SPIE. 2002;4619:237–239. [Google Scholar]
- 22.Dichtl A, Jonas JB, Naumann GOH. Retinal nerve fiber layer thickness in human eyes. Graefes Arch Clin Exp Ophthalmol. 1999;237:474–479. doi: 10.1007/s004170050264. [DOI] [PubMed] [Google Scholar]