Introduction
Phase-contrast magnetic-resonance imaging (PC-MRI) is a proven non-invasive technique for quantifying velocity and blood flow in the great arteries [1–3]. Measurements of blood flow in the aorta and pulmonary trunk produce a wealth of information, including cardiac outputs of the left and right ventricles, regurgitant volumes and fraction of the aortic and pulmonary valves, and shunt ratio. Regurgitant fraction is a particularly important parameter that determines the need for valvular repair or replacement, while shunt ratio is an important parameter for evaluating the need for closing shunt lesions due to atrial septal defects and ventricular septal defects [4–8]. Velocity of moving blood is related to the pressure gradient as described by the modified Bernoulli equation [9]. This relationship is used extensively by echocardiography to estimate pressure gradient across stenotic cardiovascular lesions. Using a similar approach, PC-MRI has been applied to estimate the pressure gradient of coarctation of the ascending aorta [9]. A PC-MRI scan usually requires a breath-hold to minimize the movement of the vessels through the imaging slice. However, conventional PC-MRI scans last on the order of 20–30 sec. This duration may be difficult for children and non-compliant patients.
Sensitivity Encoding (SENSE) [10] is an important technique that significantly reduces acquisition time. Implementations of SENSE for magnitude imaging are now widely available for clinical applications. A successful implementation of SENSE for PC-MRI promises shortened scan time or increased temporal resolution in segmented k-space techniques, thereby improving patient compliance in breath-hold imaging. An experimental version of SENSE PC-MRI has been tested on the measurement of shunt ratio [11,12]. However, the potential applications of SENSE PC-MRI have yet to be fully explored in the measurement of flow velocity and the estimation of pressure gradients.
Feasibility of SENSE-accelerated PC-MRI has been demonstrated by experimental sequences [11,12,13] for flow quantification although a clinically practical and efficient implementation has not been reported. In particular, the SENSE paradigm requires an accurate, robust estimation of the coil sensitivities to unwrap the undersampled, aliased images. Hence, we have recently implemented a SENSE version of PC-MRI that utilizes a single, low-resolution 3D volume acquisition for calibration. Data from this calibration scan are used to reconstruct subsequent, unlimited number of SENSE accelerated PC-MRI scans, provided that the regions of interest lie within the calibration volume. This implementation is capable of variable reduction factor R. For convenience, we refer to a non-accelerated (R=1) scan as SENSE-PCx1, a reduction factor 2 (R=2) scan as SENSE-PCx2, and a reduction factor 3 (R=3) scan as SENSE-PCx3.
In this paper, we first establish the accuracy of flow and velocity measurements of SENSE-PCx1 against a standard, commercial PC-MRI sequence (Fastcard-PC, GE Healthcare, 1.5T) in normal volunteers. We then examine the repeatability of SENSE-PC measurements at reduction factors R=1, 2, and 3. Finally, we compare the results from SENSE-PC at various reduction factors in a group of clinical patients. Specifically, we test the hypothesis that SENSE-PC at reduction factors 2 and 3 produces flow and peak velocity measurements statistically similar to R=1 values under clinical conditions while simultaneously providing considerably shorter scan times.
Materials and Methods
MR Imaging
Volunteer Population
We examined 5 normal volunteers (weight 61–89 kg, mean age 34.8 years ± 2.9 years, 4 male/1 female) for PC-MRI study. The mean heart rate was 70 beats per minute (range 59–80). PC-MRI scans were performed with flow quantification from the slices transverse to the ascending aorta and pulmonary trunk. Institutional Review Board approval was obtained for the study protocol, and informed consent was obtained from all volunteers.
All imaging was done on a 1.5T TwinSpeed MRI Scanner (GE Healthcare, Waukesha, WI) with 150 T/m/sec maximum slew rate and 40 mT/m gradients. An 8-channel cardiac phased-array coil (GE Healthcare, Waukesha, WI) was used for all acquisitions. The regions of interest were centered as much as possible within the field of view. Volunteers were asked to hold their breath at deep inhalation at both the calibration and SENSE acquisition scans.
A calibration scan was first acquired using a 3D spoiled gradient-recalled echo (SPGR) sequence covering the full chest volume for all vessels of interest, namely the aorta and the pulmonary trunk. The sequence was not cardiac gated. A low flip-angle of 5°, a low-resolution matrix of 64×64, and averaging of two excitations produced high signal-to-noise ratio (SNR), low contrast images for the coil sensitivity maps. The total calibration scan time was approximately 15 sec for the 32 calibration slices.
Following calibration, for each vessel of interest, Fastcard-PC scans were acquired twice, followed by two scans acquired by SENSE-PC at reduction factors R=1, 2, and 3. The SENSE-PC sequence was implemented as a 2D fast GRE segmented k-space cardiac-triggered phase-contrast sequence with retrospective gating [3,14]. Imaging was performed with the slice perpendicular to the vessel lumen and flow encoding in the through-plane direction. For each vessel of interest, the same slice prescription was used for all the SENSE-PC scans. Scanning was performed with a 256×160 matrix, flip angle 15°, 10 mm slice, TE 2.4ms, TR 4.6ms, and 62.5 kHz bandwidth. 10 views per segment were collected. Scan times were approximately 20–25 sec for each Fastcard-PC and SENSE-PCx1 acquisition, 10–12 sec for each SENSE-PCx2 acquisition, and 6–8 sec for each SENSE-PCx3 acquisition.
Patient Population
We recruited 26 patients (weight 6–74 kg, mean age 11.8 years ± 9.6 years, age range 0.5–47 years) who were scheduled to undergo a routine cardiovascular MRI study. The mean heart rate was 91 beats per minute (range 55–158). Table 1 shows the patient demographics and relevant protocol parameters used for each patient. As in the volunteer population, those patients requiring flow quantification for the great vessels underwent PC-MRI scans from slices transverse to the ascending aorta and pulmonary trunk. Patients with coarctation were scanned transverse to the narrowest part of the stenosis. One patient had severe signal loss at the pulmonary trunk due to turbulent flow from pulmonary stenosis. For this patient, PC-MRI was performed at the right and left pulmonary arteries independently. For the flow quantification, this patient’s pulmonary flow was calculated as the sum of the right and left pulmonary arterial flows. For peak velocity quantification, the right and left pulmonary arteries were separately measured and compared. In summary, the following measurements were obtained: aortic flow (n=17), pulmonary flow (n=16), shunt ratio (n=16), aortic peak velocity (n=17), pulmonary peak velocity (n=17), and coarctation peak velocity (n=10). Institutional Review Board approval was obtained for the study protocol, and informed consent was obtained from all patients.
Table 1.
Patient Demographic and Scan Prescription.
| Patient number | Age (years) | Sex | Weight (kg) | Venc (cm/s) | Contrast? | Clinical history |
|---|---|---|---|---|---|---|
| 1 | 3 | m | 18 | 250 | yes | L-transposition of the great arteries and pulmonary stenosis |
| 2 | 12 | m | 37 | 250 | yes | coarctation |
| 3 | 10 | f | 24 | 500 | yes | coarctation |
| 4 | 19 | f | 73 | 300 | yes | Takayasu’s aortitis with distal arch stenosis |
| 5 | 13 | m | 57 | 250 | yes | coarctation repair |
| 6 | 17 | m | 74 | 250 | yes | coarctation, Shone’s syndrome |
| 7 | 9 | m | 19 | 200 | yes | Tetralogy of Fallot repaired |
| 8 | 1.5 | f | 10 | 250 | yes | Alagille’s syndrome |
| 9 | 5 | m | 16 | 200 | no | Ebstein’s anomaly |
| 10 | 0.5 | m | 6 | 400 | yes | pulmonary hypertension, coarctation repair |
| 11 | 3 | f | 13 | 200 | yes | tricuspid atresia, Glenn shunt |
| 12 | 12 | m | 43 | 200 | yes | D-transposition, status post Damus procedure |
| 13 | 10 | f | 50 | 200 | yes | heart transplant |
| 14 | 21 | f | 64 | 400 | no | D-transposition of the great arteries, status post Mustard/Senning procedure |
| 15* | 2 | m | 10 | 250 | yes | Tetralogy of Fallot repair |
| 16 | 47 | m | 61 | 250 | yes | Ross procedure, pulmonary stenosis |
| 17 | 10 | m | 37 | 250 | yes | Tetralogy of Fallout repaired |
| 18 | 16 | m | 59 | 450 | yes | coarctation |
| 19 | 1 | f | 8 | 450 | yes | coarctation |
| 20 | 24 | f | 57 | 350 | yes | coarctation |
| 21 | 13 | m | 52 | 450 | yes | bicuspid aortic valve, coarctation |
| 22 | 15 | m | 60 | 350 | yes | Tetralogy of Fallot repaired |
| 23 | 6 | m | 22 | 250 | no | pulmonary and tricuspid regurgitation, post pulmonary valve prosthesis placement |
| 24 | 10 | f | 32 | 250 | yes | truncus arteriosus repaired, pulmonary stenosis |
| 25 | 12 | m | 30 | 350 | yes | coarctation |
| 26 | 15 | f | 68 | 150 | yes | Marfan’s syndrome, aortic root aneurysm |
4-coil array was used for this patient
Those with contrast were injected at 0.2 mmol/kg of gadopentetate dimeglumine (Magnevist).
All imaging was done on a 1.5T TwinSpeed MRI Scanner (GE Healthcare, Waukesha, WI) with 150 T/m/sec maximum slew rate and 40 mT/m gradient strength. This scanner was sited in a children’s hospital for routine clinical studies. An 8-channel cardiac phased-array coil (GE Healthcare, Waukesha, WI) was used for all acquisitions but one. The exception used a 4-channel torso phased-array coil (GE Healthcare, Waukesha, WI).
Initially, 24 of the 26 patients received intravenous gadopentetate dimeglumine (Magnevist, Berlex, Wayne, NJ) at a dose of 0.2 mmol/kg as needed by the protocol for the conventional clinical scan. Following the completion of the standard clinical MRI images, additional scans were performed for the purpose of this study. Patients who were able were asked to hold their breath at deep inhalation at both the calibration scan and SENSE-PC scan. For those unable to breathhold, they were allowed to take shallow breaths during both the calibration scan and the SENSE-PC scan. The calibration scan protocol was identical to that used for the volunteer population.
For each vessel of interest, SENSE-PCx1 was acquired first, followed by SENSE-PCx2 and SENSE-PCx3 (Fig. 1). Scanning was performed with a 256×160 matrix, flip angle 15–30°, 5–7mm slice, TE ~2ms, TR ~4ms, and 32.5–125kHz bandwidth. One to six views per segment were collected. Scan times were approximately 20–30sec for the reference set at R=1, 12–20sec for SENSE at R=2, and 7–10sec for SENSE at R=3.
Figure 1.
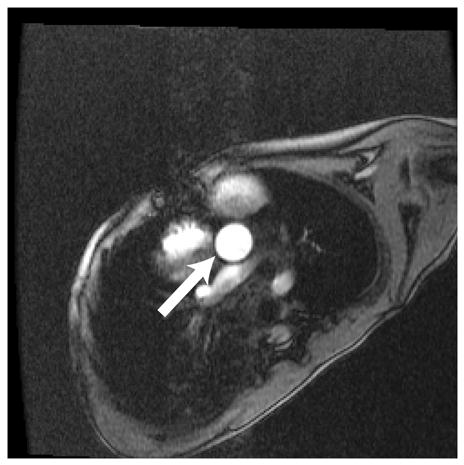
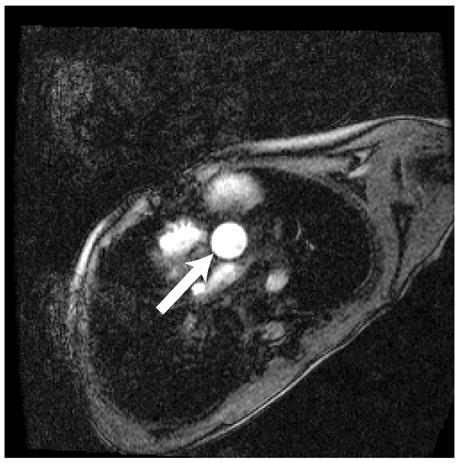
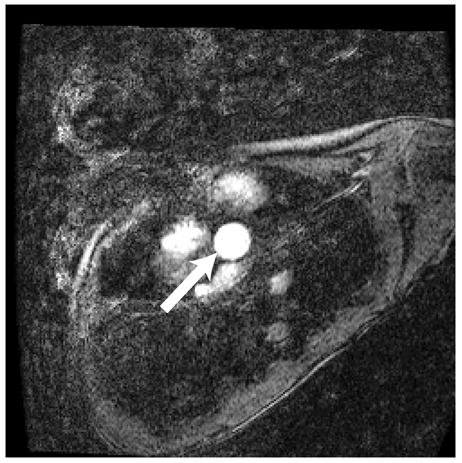
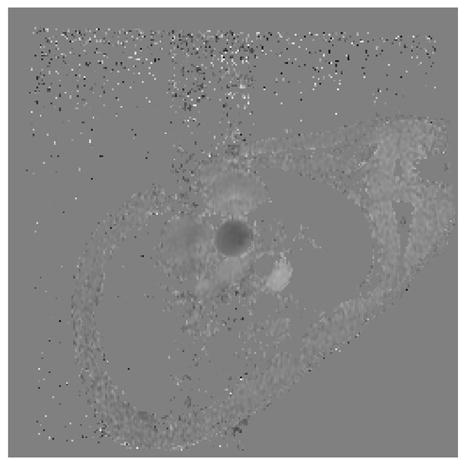
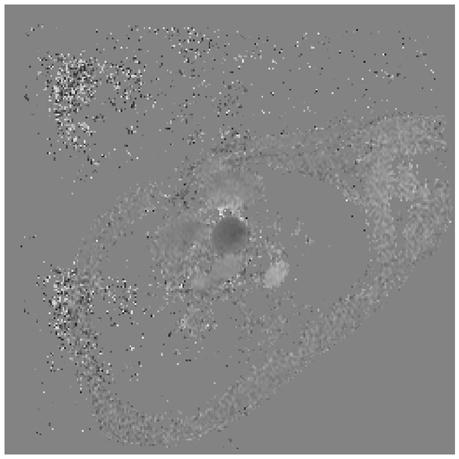
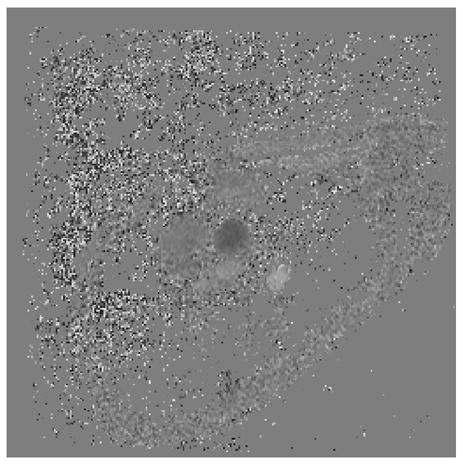
Representative magnitude (left) and velocity (right) images of the aorta (arrow) for a patient with Ebstein’s anomaly. A) SENSE-PCx1, B) SENSE-PCx2, C) SENSE-PCx3. Noise from coil sensitivities can be seen in the SENSE reconstructions. The phase-encoding direction is in the anterior-posterior direction, while flow is along the superior-inferior direction. The noise in the background is high, but the baseline vessel signal still provides reliable flow estimation.
Image Reconstruction
Both volunteer and patient studies used the following data processing algorithm. The coil sensitivity maps used for the SENSE reconstruction were computed by first interpolating the 3D calibration scan onto the same prescribed plane as the SENSE-PC acquisition. The interpolated images were smoothened by a 3×3 spatial kernel. The final sensitivity map for each coil was then computed by pixel-wise complex division by sum-of-squares of all coil images, as described by Pruessman [10]. After SENSE reconstruction, the phase images were calculated as the phase difference of the flow echoes. Post-processing was also performed to eliminate concomitant gradient effects from the Maxwell terms [15]. Phase error from eddy currents was corrected by subtracting the phase value of adjacent static soft tissue.
Measurements for Flow and Pressure Gradient
All flow measurements were calculated using the CV Flow Analysis software package in an Advantage Workstation (GE, Waukesha, WI). For every cardiac phase, the aorta and pulmonary trunk were segmented manually. Flow rate was calculated by summing flow within the vessel lumen per cardiac phase and then averaging over the cardiac cycle (fig. 2). The shunt flow was calculated as the ratio of the average pulmonary flow to the average aortic flow.
Figure 2.
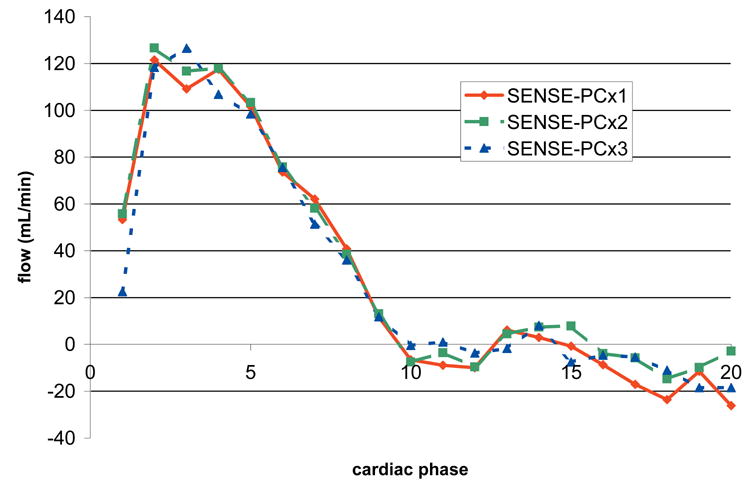
Flow Profile of the aortic scan shown in figure 1. The flow profiles show good agreement despite noise in the magnitude images.
The peak pressure gradient, ΔP, is related to the peak velocity, Vp, by the modified Bernoulli equation, ΔP=4Vp2 [9]. Peak velocity measurements were performed using the Matlab software program (Mathworks, Natick, MA). To minimize the effect of outlier values from noise, the peak velocity was calculated as the average of the top 10% velocities from contiguous pixels within the vessels. The final peak velocity was calculated as the maximum of the peak velocities at systole.
Statistical Analysis
Volunteer Population
To establish the accuracy of our SENSE-PC implementation, Bland-Altman statistics [16] were calculated for the difference between SENSE-PCx1 and Fastcard-PC separately for flow and peak velocity measurements. Data from both the aorta and the pulmonary trunk are included. Bland-Altman comparison based on absolute difference measures is appropriate because phase error in PC-MRI does not increase with the measured phase value. The noise in PC-MRI image reconstruction is phase-independent as long as the noise in the real and imaginary channels are uncorrelated [17]. Therefore, the derived velocity error and flow error were not expected to change with the measured velocity. To evaluate consistency in repeated measurements, Bland-Altman statistics were calculated for the difference between repeated measurements separately for Fastcard-PC, SENSE-PCx1, SENSE-PCx2, and SENSE-PCx3. Data for comparing Fastcard-PC and SENSE-PC were derived from the means of the repeated studies. Bland-Altman limits of agreement were calculated as the total mean ± 2 SD.
Patient Population
To establish the accuracy of measurements obtained with SENSE acceleration, statistical comparisons between SENSE-PCx1 and SENSE-PCx2, and between SENSE-PCx1 and SENSE-PCx3 were performed for flow and peak velocity measurements. For the flow measurements, average aortic flow and pulmonary flow, and shunt ratio were separately compared for each patient. Peak velocity for the aorta, pulmonary artery, and coarctation were separately compared. Pearson correlation coefficients and their significance were computed. For this study, a statistic was considered significant if p < 0.05. Linear regression analysis was computed. Bland-Altman statistics for absolute differences were also calculated.
g-factor Calculation
In the SENSE formalism, the coil geometry factor, or g-factor, is a measure of the effect of noise influenced by the physical aspects of the coil receiver array and may influence the precision of the phase-contrast measurements. The coil geometry factor was computed to determine its variation in clinical scans and thus its possible effects on the measurements. The g-factor affects the SNR of the magnitude reconstruction by the equation [10],
where R is the SENSE reduction factor and g is the g-factor. For velocity images, the standard deviation of the noise in the velocity measurement is [3]:
For each scan of the aorta, pulmonary trunk, and coarctation, the vessel lumen was segmented, and the mean and standard deviation of the g-factor were computed within that lumen.
Results
Tables 2 and 3 summarize the Bland-Altman upper limit, mean, and lower limit for the difference between Fastcard-PC and SENSE-PCx1 and for the differences between the repeated studies. The mean differences between Fastcard-PC and SENSE-PCx1 were -0.06 L/min for flow and 0.0053 m/s for peak velocity. For flow repeatability studies, the maximum limits of agreement were 0.98 L/min for SENSE-PCx1, 1.28 L/min for SENSE-PCx2, and 1.16 L/min for SENSE-PCx3. For peak velocity repeatability studies, the maximum limits of agreement were 0.12 m/s for Fastcard-PC, 0.11 m/s for SENSE-PCx1, 0.15 m/s for SENSE-PCx2, and 0.17 m/s for SENSE-PCx3.
Table 2.
Statistical Comparisons Between Fastcard-PC and SENSE-PC for Flow in Normal Volunteers
| Fastcard-PC repeatability | SENSE-PCx1 repeatability | SENSE-PCx2 repeatability | SENSE-PCx3 repeatability | Fastcard-PC vs SENSE-PCx1 | SENSE-PCx1 vs SENSE-PCx2 | SENSE-PCx1 vs SENSE-PCx3 | ||
|---|---|---|---|---|---|---|---|---|
| n | 10 | 10 | 10 | 10 | 10 | 10 | 10 | |
|
| ||||||||
| Bland-Altman | total mean difference (L/min) | 0.07 | −0.10 | −0.03 | −0.26 | −0.06 | −0.15 | −0.58 |
| lower limit of agreement (L/min)* | −0.65 | −0.98 | −1.28 | −1.16 | −0.75 | −2.03 | −1.67 | |
| upper limit of agreement (L/min)** | 0.79 | 0.79 | 1.21 | 0.64 | 0.63 | 1.74 | 0.50 | |
lower limit of agreement represents the mean difference − 2 standard deviation
upper limit of agreement represents the mean difference + 2 standard deviation
Table 3.
Statistical Comparisons Between Fastcard-PC and SENSE-PC for Peak Velocity in Normal Volunteers
| Fastcard-PC repeatability | SENSE-PCx1 repeatability | SENSE-PCx2 repeatability | SENSE-PCx3 repeatability | Fastcard-PC vs SENSE-PCx1 | SENSE-PCx1 vs SENSE-PCx2 | SENSE-PCx1 vs SENSE-PCx3 | ||
|---|---|---|---|---|---|---|---|---|
| n | 10 | 10 | 10 | 10 | 10 | 10 | 10 | |
|
| ||||||||
| Bland-Altman | total mean difference (m/s) | 0.0098 | −0.029 | 0.041 | −0.0055 | 0.0053 | −0.071 | −0.041 |
| lower limit Of agreement (m/s)* | −0.099 | −0.11 | −0.068 | −0.17 | −0.077 | −0.17 | −0.22 | |
| upper limit of agreement (m/s)** | 0.12 | 0.057 | 0.15 | 0.16 | 0.088 | 0.029 | 0.14 | |
lower limit of agreement represents the mean difference − 2 standard deviation
upper limit of agreement represents the mean difference + 2 standard deviation
Tables 4 and 5 summarize the correlation coefficients, linear regression, and Bland-Altman statistics for flow and peak velocity measurements, respectively. Figure 3 shows the Bland-Altman plot for the difference in aortic flow between accelerated SENSE-PC and non-accelerated SENSE-PC. Figures 4 and 5 show similar plots for pulmonary flow and coarctation peak velocity.
Table 4.
Statistical Comparisons Between PC-MRI and SENSE PC-MRI for Flow in Patients
| Aorta | pulmonary artery | shunt ratio | |||||
|---|---|---|---|---|---|---|---|
| N | 17 | 16 | 16 | ||||
| SENSE reduction factor | 2 | 3 | 2 | 3 | 2 | 3 | |
|
| |||||||
| Bland-Altman | total mean difference (L/min) | 0.05 | 0.04 | 0.12 | −0.02 | 0.04 | 0.03 |
| lower limit of agreement (L/min)* | −0.52 | −0.51 | −0.41 | −0.80 | −0.16 | −0.34 | |
| upper limit of agreement (L/min)** | 0.62 | 0.59 | 0.65 | 0.75 | 0.25 | 0.40 | |
|
| |||||||
| Pearson | correlation coefficient | 0.985 | 0.985 | 0.994 | 0.986 | 0.992 | 0.969 |
| p value | 0.01 | 0.01 | 0.01 | 0.01 | 0.01 | 0.01 | |
|
| |||||||
| linear regression | slope | 1.075 | 1.065 | 1.016 | 0.955 | 1.091 | 1.11 |
| y-intercept (L/min) | −0.19 | −0.16 | 0.06 | 0.14 | −0.063 | −0.103 | |
lower limit of agreement represents the mean difference − 2 standard deviation
upper limit of agreement represents the mean difference + 2 standard deviation
Table 5.
Statistical Comparisons Between PC-MRI and SENSE PC-MRI for Peak Velocity in Patients
| Aorta | pulmonary artery | Coarctation | |||||
|---|---|---|---|---|---|---|---|
| n | 17 | 17 | 10 | ||||
| SENSE reduction factor | 2 | 3 | 2 | 3 | 2 | 3 | |
|
| |||||||
| Bland-Altman | total mean difference (m/s) | −0.029 | −0.041 | −0.0040 | −0.083 | −0.10 | −0.080 |
| lower limit of agreement (m/s)* | −0.22 | −0.30 | −0.25 | −0.62 | −0.40 | −0.45 | |
| upper limit of agreement (m/s)** | 0.16 | 0.22 | 0.24 | 0.46 | 0.19 | 0.29 | |
|
| |||||||
| Pearson | correlation coefficient | 0.993 | 0.984 | 0.993 | 0.962 | 0.986 | 0.974 |
| p value | 0.01 | 0.01 | 0.01 | 0.01 | 0.01 | 0.01 | |
|
| |||||||
| linear regression | slope | 0.983 | 0.904 | 1.048 | 0.885 | 0.883 | 0.874 |
| y-intercept (m/s) | −0.0064 | 0.057 | −0.071 | 0.11 | 0.13 | 0.20 | |
lower limit of agreement represents the mean difference − 2 standard deviation
upper limit of agreement represents the mean difference + 2 standard deviation
Figure 3.
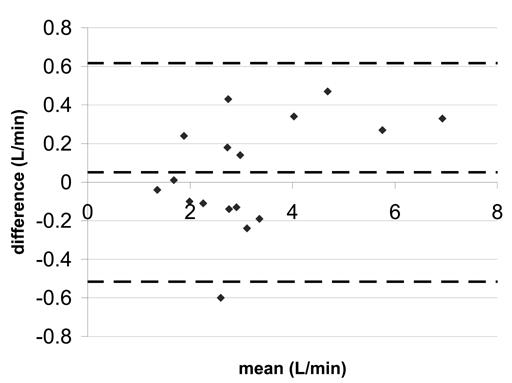
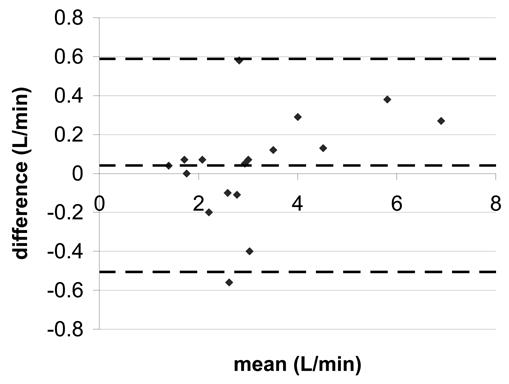
Bland-Altman statistics for aortic flow a) SENSE-PCx2 vs. SENSE-PCx1 b) SENSE-PCx3 vs. SENSE-PCx1. The dashed lines represent the mean ± 2 SD.
Figure 4.
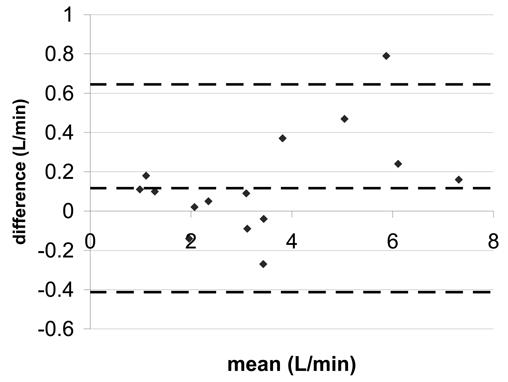
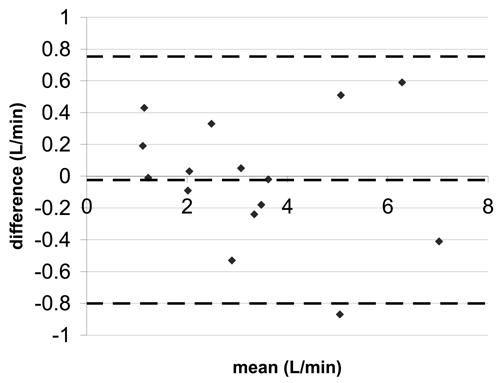
Bland-Altman statistics for pulmonary artery flow a) SENSE-PCx2 vs. SENSE-PCx1 b) SENSE-PCx3 vs. SENSE-PCx1. The dashed lines represent the mean ± 2 SD.
Figure 5.
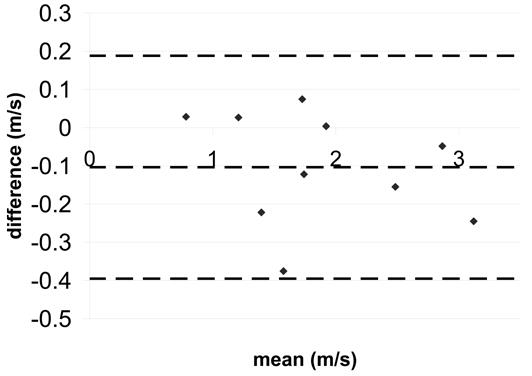
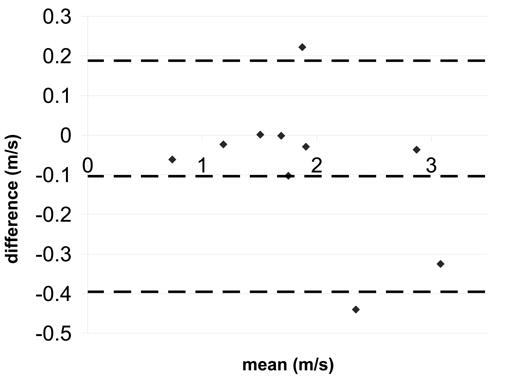
Bland-Altman statistics for coarctation peak velocity a) SENSE-PCx2 vs. SENSE-PCx1 b) SENSE-PCx3 vs. SENSE-PCx1. The dashed lines represent the mean ± 2 SD.
The correlation coefficients for all the comparisons were above 0.962 and were all statistically significant (p<0.01). For both aortic and pulmonary flow, the maximum mean difference was 0.12 L/min and the maximum limit of agreement was 0.80 L/min. Generally, the pulmonary flow showed a greater difference in mean and in limit of agreement than the aortic flow. For the calculated shunt ratio, the maximum mean difference was 0.04 and the maximum limit of agreement was 0.40. For peak velocity, the maximum mean difference was 0.1 m/s and the maximum limit of agreement was 0.62 m/s. For both peak velocity and flow, a higher reduction factor at R=3 generally showed an increase in limit of agreement when compared to a lower reduction factor at R=2.
The mean and standard deviation of the g-factor are shown in Table 6. A g-factor of 1 corresponds to no noise amplification from the coil geometry array. The signal-to-noise ratio decreases with increasing g-factor. The mean aorta g-factors were the highest followed by the pulmonary artery g-factors. The distal descending aorta g-factors corresponding to the coarctation scans were the lowest. The g-factors at R=3 were higher than those at R=2, as expected.
Table 6.
g-factor Statistics
| average size (mm2) | mean | standard deviation | |||
|---|---|---|---|---|---|
| R=2 | R=3 | R=2 | R=3 | ||
|
| |||||
| aorta | 137.06 | 1.322 | 2.103 | 0.324 | 1.191 |
| pulmonary artery | 162.45 | 1.161 | 1.554 | 0.181 | 0.305 |
| coarctation | 94.75 | 1.159 | 1.409 | 0.472 | 0.589 |
Discussion
Phase-contrast MRI is an established, routinely applied technique for non-invasive, clinical assessment of cardiovascular physiology. Most implementations of PC-MRI employ segmented k-space techniques to shorten imaging times in order to permit breath-held imaging, which in turn minimize respiratory artifacts. However, this is done at the expense of temporal resolution. SENSE can improve scan time, temporal resolution, spatial resolution, or a combination of these factors. Increasing temporal resolution improves clarity of rapidly moving parts, such as the heart valves. Increasing spatial resolution helps imaging small structures and reduces partial volume effects. Decreasing scan time also helps improve patient compliance. Therefore, the incorporation of SENSE with PC-MRI is a logical and powerful step. Despite demonstration of feasibility [11,12,13], a clinically practical and efficient implementation has yet to be reported. While the accuracy of SENSE PC-MRI has been assessed in calculating shunt ratio [11,12], it has yet to be evaluated in velocity measurements, which are needed for pressure gradient estimation.
In this study, we explored the approach of using a single, low resolution, low contrast, high-SNR, 3D-SPGR sequence to acquire the calibration scan for all subsequent SENSE-PC scans. For the case of shunt ratio quantification using conventional PC-MRI, the total scan time would include the time for two scans of the aorta and pulmonary artery. If a non-accelerated PC-MRI sequence takes 20 seconds per slice, then the total scan time for two slices would be about 40 seconds. In our approach, the single 3D calibration scan takes about 10 seconds and the total scan time is 30 seconds, close to a 25% savings. In clinical practice, the savings in scan time is likely greater since additional flow planes are routinely acquired. Alternatively, the savings in scan time can be traded for improved temporal resolution, spatial resolution, or both. To maintain the focus of this study, we did not explore these additional possibilities.
In our volunteer study, we showed that the performance of our SENSE-PC implementation is generally compatible with an established, non-accelerated PC-MRI sequence. The direct comparison between SENSE-PCx1 and Fastcard-PC of blood flow values showed a mean difference of 0.06 L/min, which is insignificant compared to a normal cardiac output of 5 L/min or a peak systolic aortic flow of 10 L/min. Similarly, the mean difference for peak velocity was 0.0053 m/s, which is insignificant compared to a normal aortic valvular velocity of 1–2 m/s.
Our repeatability study showed that consistency from scan-to-scan worsens with SENSE acceleration. This is reflected by an increased limit of agreements from 0.98 L/min at R=1 to 1.16 L/min at R=3 for flow, and from 0.11 m/s at R=1 to 0.17 m/s at R=3. These changes can be expected from the increased noise and decreased signal-to-noise ratio in SENSE accelerated images.
In the patient study, there is good agreement in flow and peak velocity for a reduction factors up to 3. A small positive bias, up to 0.12 L/min, was detected for flow and a small negative bias, up to 0.083 m/s, was detected for peak velocity, but both are small compared to the normal physiological ranges. Beerbaum [11,12] reported close agreement between SENSE-accelerated PC-MRI compared with non-accelerated PC-MRI for aortic flow, pulmonary flow, and shunt ratio. They employed a log-transformed Bland-Altman method to compare the ratio of two techniques and reported a 3% mean difference and a 24% maximum limit of agreement. In our study, we believe that a comparison of absolute difference is more appropriate since there is no expectation that error increases with the magnitude of the velocity or flow data. While our results qualitatively agree with their assessments concerning flow, a quantitative comparison of results was not possible.
We note in our study that accuracy decreases in pulmonary trunk with an increase in the reduction factor. However, this trend is not as prominent in the aorta or the coarctation. This phenomenon cannot be explained by g-factor difference since the g-factor is greater at the aorta as compared to the pulmonary trunk. One possible explanation may be the difference in orientation of the image planes for the aorta and the pulmonary trunk. For the aorta, the transverse image lies mostly in the axial plane, where the anterior-posterior dimension of the chest is small. In contrast, the transverse image for the pulmonary trunk lies mostly in the coronal plane, where the body fills the image. When SENSE undersamples k-space, the wrapping of mostly empty space in the axial plane produces less artifacts compared with scanning in the coronal plane. At higher reduction factors, separating aliasing artifacts with SENSE in the axial plane produces less error and artifacts than in the coronal plane.
Despite its benefits, SENSE PC-MRI introduces several problems not encountered in conventional PC-MRI. The fidelity of SENSE reconstruction is strongly dependent on the appropriate coil design and the proper match between the phase-array coils and the body size of the subject. The primary 8-channel cardiac coil that was used for this study is designed for adult body size and is not optimized for small pediatric patients, especially in the left-right direction. Errors in coil sensitivity maps in the chest wall, where fat signals are strong, may additionally contribute to inaccuracies.
One complication regarding SENSE PC-MRI is aliasing in full field-of-view image reconstructions [18]. When the coil sensitivity maps do not fully correct for aliasing in the full field-of-view, artifacts are produced. In this study, we carefully avoided the prescription of aliasing in full field-of-view as much as possible. For those patients where we could not avoid this complication, we did not encounter appreciable changes in the flow and peak velocity measurements.
For estimating peak velocities, the SENSE PC-MRI measurements introduce a slight negative bias. One possible explanation is that when peak blood flow velocities approach the maximum encoded velocity, additive noise beyond the maximum velocity would be registered as an aliased, negative velocity. This would introduce a negative bias to the estimation. As SNR decreases with greater reduction factor, this negative bias may also become greater.
Finally, our approach of scanning a calibration scan once, although efficient, may introduce misregistration artifacts when the patient moves or breathes differently over the course of the study. When this type of artifact becomes noticeable, the calibration scan must be repeated.
Some of the variations observed in this study may be caused by physiological changes. Beerbaum [19] reported 5.3% variability in shunt ratio quantification in scans performed 3 times with pediatric populations. Powell [20] reported ± 0.2 limits of agreement for normal volunteers with expected shunt ratios of 1.0, corresponding to 20% variability. It is expected that random patient movement or physiological changes occur which may affect flow measurements seen in this study.
In summary, a practical and efficient SENSE PC-MRI sequence has been implemented and tested in patients under clinical conditions. Flow and velocity data derived from SENSE PC-MRI were found compatible with conventional PC-MRI in the imaging of the great arteries. The efficiency gained from SENSE may be traded for shorter scan time, increased temporal resolution, increased spatial resolution, or combinations thereof. Thus, SENSE is a valuable and powerful tool that enhances the performance of clinical PC-MRI.
Acknowledgments
We wish to thank Dr. Lars Wigstrom for helping with initial construction of peak velocity calculations. Support was provided by GE Medical Systems, Center of Advanced MR Technology at Stanford P41RR09784, R01EB002711, the Whitaker Foundation and the Lucas Foundation.
Footnotes
Grants:
NIH Center of Advanced MR Technology at Stanford P41RR09784, NIH R01EB002711 Support from the Whitaker Foundation and the Lucas Foundation.
Publisher's Disclaimer: This is a PDF file of an unedited manuscript that has been accepted for publication. As a service to our customers we are providing this early version of the manuscript. The manuscript will undergo copyediting, typesetting, and review of the resulting proof before it is published in its final citable form. Please note that during the production process errors may be discovered which could affect the content, and all legal disclaimers that apply to the journal pertain.
References
- 1.Szolar DH, Hajime S, Higgins CB. Cardiovascular Applications of Magnetic Resonance Flow and Velocity Measurements. J Magn Reson Imaging. 1996;1:78–89. doi: 10.1002/jmri.1880060117. [DOI] [PubMed] [Google Scholar]
- 2.Higgins CB, Sakuma H. Heart Disease: Functional Evaluation with MR Imaging. Radiology. 1996;199:307–315. doi: 10.1148/radiology.199.2.8668769. [DOI] [PubMed] [Google Scholar]
- 3.Pelc NJ, Herfkens RJ, Shimakawa A, Enzmann DR. Phase Contrast Cine Magnetic Resonance Imaging. Magn Reson Q. 1991;7:229–254. [PubMed] [Google Scholar]
- 4.Hundley WG, Li HF, Lange RA, et al. Assessment of Left-to-Right Intracardiac Shunting by Velocity-Encoded, Phase-Difference Magnetic Resonance Imaging: A Comparison with Oximetric and Indicator Diffusion Techniques. Circulation. 1995;91:2955–2960. doi: 10.1161/01.cir.91.12.2955. [DOI] [PubMed] [Google Scholar]
- 5.Bremerich J, Reddy GP, Higgins CB. MRI of Supracristal Ventricular Septal Defects. J Comput Assist Tomogr. 1999;23:13–15. doi: 10.1097/00004728-199901000-00003. [DOI] [PubMed] [Google Scholar]
- 6.Parsons JM, Baker EJ, Anderson RH, et al. Morphological Evaluation of Atrioventricular Septal Defects by Magnetic Resonance Imaging. Br Heart J. 1990;64:138–145. doi: 10.1136/hrt.64.2.138. [DOI] [PMC free article] [PubMed] [Google Scholar]
- 7.Korperich H, Gieseke J, Barth P, et al. Flow Volume and Shunt Quantification in Pediatric Congenital Heart Disease by Real-Time Magnetic Resonance Velocity Mapping: A Validation Study. Circulation. 2004;109:1987–1993. doi: 10.1161/01.CIR.0000126494.66859.A2. [DOI] [PubMed] [Google Scholar]
- 8.Brenner LD, Caputo GR, Mostbeck G, et al. Quantification of Left to Right Atrial Shunts with Velocity-Encoded Cine Nuclear Magnetic Resonance Imaging. J Am Coll Cardiol. 1992;20:1246–1250. doi: 10.1016/0735-1097(92)90384-y. 1.4–3.9. [DOI] [PubMed] [Google Scholar]
- 9.Mohiaddin RH, Kilner PT, Rees S, et al. Magnetic Resonance Volume Flow and Jet Velocity Mapping in Aortic Coarctation. J Am Coll Cardiol. 1993;22:1515–1521. doi: 10.1016/0735-1097(93)90565-i. [DOI] [PubMed] [Google Scholar]
- 10.Pruessman KP, Weiger M, Scheidegger MB, Boesiger P. SENSE: Sensitivity Encoding for Fast MRI. Magn Reson Med. 1999;42:952–962. [PubMed] [Google Scholar]
- 11.Beerbaum P, Korperich H, Gieseke J, Barth P, Peuster M, Meyer H. Rapid Left-to-Right Shunt Quantification in Children by Phase-Contrast Magnetic Resonance Imaging Combined with Sensitivity Encoding. Circulation. 2003;108:1355–1361. doi: 10.1161/01.CIR.0000087603.97036.C2. [DOI] [PubMed] [Google Scholar]
- 12.Beerbaum P, Korperich H, Gieseke J, Barth P, Peuster M, Meyer H. Blood Flow Quantification in Adults by Phase-Contrast MRI Combined with SENSE—a Validation Study. J Cardio MR. 2005;7:361–369. doi: 10.1081/jcmr-200053538. [DOI] [PubMed] [Google Scholar]
- 13.Thunberg P, Karlsson M, Wigstrom L. Accuracy and Reproducibility in Phase Contrast Imaging Using SENSE. Magn Reson Med. 2003;50:1061–1068. doi: 10.1002/mrm.10634. [DOI] [PubMed] [Google Scholar]
- 14.Nayler GL, Firmin DN, Longmore DB. Blood Flow Imaging by Cine Magnetic Resonance. J Comput Assist Tomogr. 1986;10:715–722. doi: 10.1097/00004728-198609000-00001. [DOI] [PubMed] [Google Scholar]
- 15.Bernstein MA, Zhou XJ, Polzin JA, et al. Concomitant Gradient Terms in Phase Contrast MR: Analysis and Correction. Magn Reson Med. 1998;38:300–308. doi: 10.1002/mrm.1910390218. [DOI] [PubMed] [Google Scholar]
- 16.Bland JM, Altman DG. Statistical Methods for Assessing Agreement Between Two Methods of Clinical Measurement. Lancet. 1986;1:307–310. [PubMed] [Google Scholar]
- 17.Conturo TE, Gregory D. Signal-to-Noise in Phase Angle Reconstruction: Dynamic Range Extension Using Phase Reference Offsets. Magn Res Med. 1990;15:420–437. doi: 10.1002/mrm.1910150308. [DOI] [PubMed] [Google Scholar]
- 18.Griswold MA, Kannengiesser S, Heidemann RM, Wang J, Jakob PM. Field-of-View Limitations in Parallel Imaging. Magn Res Med. 2004;52:1118–1126. doi: 10.1002/mrm.20249. [DOI] [PubMed] [Google Scholar]
- 19.Beerbaum P, Korperich H, Barth P, Esdorn H, Gieseke J, Meyer H. Noninvasive Quantification of Left-to-Right Shunt in Pediatric Patients. Circulation. 2001;103:2476. doi: 10.1161/01.cir.103.20.2476. [DOI] [PubMed] [Google Scholar]
- 20.Powell AJ, Maier SE, Chung T, Geva T. Phase-Velocity Cine Magnetic Resonance Imaging Measurement of Pulsatile Blood Flow in Children and Young Adults: In Vitro and In Vivo Validation. Pediatr Cardiol. 2000;21:104–110. doi: 10.1007/s002469910014. [DOI] [PubMed] [Google Scholar]


