

Abstract
3,4-methylenedioxymethamphetamine (MDMA, ecstasy), a widely used recreational drug with psychoactive properties, induces both serotonin (5-HT) and dopamine (DA) release in the brain. However, little is known about its intracellular effects. We previously showed that MDMA rewarding effects in mice were dependent upon ERK activation and that dorsal striatum was a critical region for mediating ERK-dependent Egr1 MDMA-induced transcription. Here, we extend these findings by showing that MDMA is indeed able to activate ERK within this structure. To identify genes regulated by acute MDMA in the mice dorsal striatum, and selectively controlled by this kinase, we performed microarray experiments by using a selective inhibitor of ERK activation, SL327. Of the ~24,000 genes from the microarray, 27 showed altered expression after exposure to MDMA, and among these, 59% were partially or totally inhibited by SL327 pretreatment. Our results showed that the genes regulated by MDMA encode proteins that belong to transcription factors family, signalling pathways (phosphatases, cytoskeleton regulation), and synaptic functions. These early changes, and especially those controlled by ERK activation might play significant roles in the expression of many of the behaviours that occur following MDMA taking.
Keywords: Animals; Cytoskeletal Proteins; genetics; Enzyme Activation; drug effects; Extracellular Signal-Regulated MAP Kinases; drug effects; metabolism; Gene Expression Profiling; Gene Expression Regulation, Enzymologic; drug effects; physiology; Hallucinogens; pharmacology; Male; Mice; N-Methyl-3,4-methylenedioxyamphetamine; pharmacology; Neostriatum; drug effects; enzymology; Nerve Tissue Proteins; genetics; Neuronal Plasticity; drug effects; physiology; Neurons; drug effects; enzymology; Oligonucleotide Array Sequence Analysis; RNA, Messenger; drug effects; metabolism; Signal Transduction; genetics; Trans-Activation (Genetics); drug effects; physiology; Up-Regulation; drug effects; physiology
MDMA (3,4-methylenedioxymethamphetamine) is the psychoactive compound of the widely abused drug ecstasy. This ring-substituted phenyl-isopropylamine is structurally related to both amphetamine and hallucinogens. In humans, MDMA produces psychostimulant effects, euphoria, and empathy, and at high doses sometimes results in dramatic acute intoxication, including fatalities. In rats and mice, MDMA induces locomotor hyperactivity, hyperthermia, and has rewarding effects. Furthermore, MDMA has been shown to be neurotoxic to serotonin terminals in rats and primates (for a review, see: Green et al., 2003). There is growing evidence that this type of damage also occurs in human brain of ecstasy users, although the psychopathological consequences of this neurotoxicity are poorly understood. The mechanism of actions of MDMA is complex and not well-known. At the neurochemical level, MDMA produces an acute release of both serotonin (5-HT) and dopamine (DA) from nerve terminals (review in Colado et al. 2004). By interacting with their respective receptors at the post- and pre-synaptic levels, these neurotransmitters are responsible for the acute and long-lasting effects of MDMA. Besides, MDMA displays a moderate affinity to a broad variety of receptors, including α2-adrenergic, 5-HT2 serotoninergic, M1 muscarinic, H1 histaminergic receptors, whose activation could be at the origin of certain effects of the drug (Battaglia et al., 1988). However, the intracellular pathways accounting for MDMA effects, triggered by the stimulation of post- and pre-synaptic receptors (either by direct interaction or indirectly via 5-HT and DA release), are currently not fully known. At the intracellular level, MDMA administration has been shown to induce protein kinase C (PKC) translocation from the cytosol to the plasmic membrane, presumably corresponding to an activation of the enzyme, but the consequence of this event in MDMA effects is not known (Kramer et al., 1998). Recently, we have shown in mice that ERK (Extracellular signal-Regulated Kinase) signalling is involved in several MDMA behavioural and transcriptional effects, by using a specific inhibitor of ERK activation, SL327 (Salzmann et al., 2003). This inhibitor blocked MDMA-rewarding and hyperactive effects, and reversed MDMA-induced enhancement of immediate-early genes (IEGs) transcription in the dorsal striatum. Interestingly, ERK can be activated by several drugs of abuse (Valjent et al., 2004), and has been shown to be involved in learning and memory processes (Thomas and Huganir, 2004). To better understand the implications of ERK activation on the molecular effects of MDMA, we looked for genes that were regulated by acute administration of the drug through ERK-dependent pathway within the dorsal striatum. Oligonucleotide arrays were used to assess global differential gene expression triggered by MDMA and inhibited by SL327 in this brain structure. The changes in gene expression were confirmed for several transcripts by using real-time quantitative polymerase chain reaction and a time course of the modulations observed for four genes was achieved.
EXPERIMENTAL PROCEDURES
I. Animals and drugs
Male CD-1 mice (Charles River, France) weighing 22–24 g were housed in a room with 12h alternating light/dark cycle and controlled temperature (21 ± 1°C). Food and water were available ad libitum. All drugs were injected intraperitoneally (i.p.). D,L-MDMA (Lipomed, Switzerland) was dissolved in saline 0.9%. The MEK inhibitor SL327, a generous gift of Bristol-Myers Squibb (Wilmington) was dissolved in 100% DMSO, as previously described (Selcher et al., 1999), and injected 1 hr before MDMA. In preliminary studies, it has been verified that injection of DMSO 1h before MDMA did not interfere with the effects of MDMA alone. Volumes of injection were 0.1 ml and 0.02 ml per 10 g of body weight for MDMA (or saline) and SL327 (or vehicle), respectively. All animals received two injections.
Drug treatments and dissection
The doses of MDMA (9 mg/kg; i.p.) and SL327 (50 mg/kg; i.p.) were chosen based on previous behavioural and transcriptional studies in the same strain (Salzmann et al., 2003). We also verified that this dose of MDMA did not induce hyperthermia two hours after the injection (data not shown). Ten minutes (for the ERK activation experiments), two, four or six hours (for the transcriptional studies) after the last injection, mice were killed by cervical dislocation. The brain was quickly removed, frozen in isopentane at −50°C, and placed in an acrylic matrice (David Kopf Instruments, Phymep, France) allowing the reproducible slicing of 1mm coronal sections. A section of 2 mm was cut, corresponding approximately to bregma +0.26 mm to −0.46mm according to The Mouse Brain Paxinos and Franklin Atlas (Academic Press, 2nd edition, 2001). Dorsal striatum was then dissected free-hand on ice within the slice, and stored at −80 °C until processing.
Western-Blot analysis of ERK activation
Each mice dorsal striatum was homogenized in lysis buffer containing 10 mM Tris-HCl pH 7.5, 50 mM NaCl, 30 mM sodium pyrophosphate, 1 mM DTT, 5 μM ZnCl2, 1% triton, 50 mM NaF, 0.5 mM PMSF, 100 μM sodium orthovanadate, 5 nM okadaic acid, and Complete™ protease inhibitor complex (Roche Diagnostics, France). Homogenates were centrifuged at 4°C, 15 min at 15 000g, and the supernatants were kept at −80°C until processing. The protein concentration of samples was determined using Bradford reagent (Sigma, France) and bovine serum albumine as a standard. Equal amount of protein (15 μg) was resolved by a 12% SDS-polyacrylamide gel electrophoresis and immunoblotted with phospho-p44/42 MAP Kinase antibody ref 9101 (Cell Signaling), diluted at 1/1000. The blot was then stripped in acetic acid 0.1M during 30 minutes, and reprobed with total ERK1 and 2 antibodies sc-93 and sc-154 (Santa Cruz Biotechnology), diluted at 1/5000 each. Immunoreactive protein bands were detected by enhanced chemiluminescence reagents (ECL; Amersham Pharmacia Biotech, France) on an ECL Hyperfilm (Amersham Biosciences, UK). Optical densities (OD) were quantified using Bio1D software (Vilber Lourmat, France), and results are expressed as pERK/total ERK OD.
RNA isolation and microarray target preparation
Total RNA used for microarray hybridization were isolated with RNeasy Mini Kits (Qiagen, France), following the manufacturer’s protocol. Each RNA sample was prepared with striata pooled from 12 mice which received the same treatment, yielding to RNA concentration above 1 μg/μl. The quality of the RNA samples was determined by electrophoresis through agarose gels and staining with ethidium bromide. Quantification of total RNA was assessed by spectrophotometry. Synthesis of cDNA, synthesis and biotinylation of cRNA, fragmentation and hybridization were all performed according to the manufacturer’s instructions (Affymetrix, Santa Clara, CA, USA). The same striata tissue pool was used to prepare targets for replicate microarray hybridizations. Briefly, double-stranded cDNA was synthesized from total RNA using a Superscript Choice Kit with a T7-dT24 primer incorporating a T7 RNA polymerase promoter. Biotinylated cRNA was prepared by in vitro transcription using the Enzo BioArray High Yield RNA Transcript Labeling Kit and then fragmented. Before each sample was hybridized to the Murine Genome U74v2 set arrays, aliquots of each sample were hybridized to the Test3 Array to verify the integrity of each labeled cRNA, according to manufacturer’s recommendations (Affymetrix).
Affymetrix hybridization and microarray analyses
15 μg of fragmented, biotinylated cRNA was hybridized for 16h at 45°C to the Affymetrix Mouse genechips, MG-U74A.v2 and MG-U74B.v2. These two genechips contain probe sets interrogating approximatively 24,000 full-length mouse genes and EST clusters from the UniGene database (Build 74). Hybridizations and scans were done using an Affymetrix Fluidics Station 400 and GeneChip Scanner 3000 respectively (Plate-Forme Affymetrix Genopole, Institut Curie, France). For each genechip (U74Av2 and Bv2), we performed three replicate hybridizations (vehicle/saline and SL327/MDMA treatments), or four replicate hybridizations (MDMA treatment). Data were processed using Affymetrix Microarray Suite 5.0 (MAS) software, with the default settings. For each single array analysis, the software generated a detection call, which indicates whether a transcript is reliably detected (P; Present) or not detected (A; Absent). The average number of Present transcripts among the different hybridizations was 50.1% for the U74Av2 genechip and 44.8% for the U74Bv2. Additionally, a signal value (S) was calculated as a measure of the relative abundance of a transcript. For each genechip type, two different comparison analysis were made, using Affymetrix Comparison Algorithms incorporated in the MAS5.0 software: first, a comparison between the four hybridizations with MDMA treatment (used as experimental arrays) and the three controls (used as baseline arrays); next, a comparison between the three hybridizations with SL327/MDMA treatment (used as experimental arrays) and the four MDMA hybridized arrays (used as baseline arrays this time). Thus, for each type of comparison, we performed 12 multiple comparisons. The software used two sets of algorithms to generate change significance and change quantity metrics for every probe set. A change algorithm generated a change p-value and an associated change call (I: Increase; MI: Marginal Increase; NC: No Change; MD: Marginal Decrease; D: Decrease). A second algorithm produces a quantitative estimate of the change in gene expression in the form of Signal Log2 Ratio (SLR). The data sets from comparison files were imported into Excel software (Microsoft, France) for further analysis. To identify potentially regulated transcripts by MDMA treatment, we performed an analysis of consistency of change call within the transcripts which displayed a Present detection call in all the single array analysis. We used a cut-off of 66% (i.e., 8 of 12) for consistency of change call (I/MI or D/MD) in the 12 pair-wise comparisons. Furthermore, we only selected the transcripts with an average SLR of >0.5 or <−0.5. For the identification of transcripts affected by SL327 pretreatment, we defined candidate genes that were rated Present and displayed a consistency of change call in 6 of the 12 pair-wise comparisons. Furthermore, we also picked up for further analysis the genes that were rated Present and showed a significant difference between MDMA and SL327/MDMA absolute expression values by comparing the signal values (S) using a t-test. For all of these transcripts, we calculated a percentage of inhibition by SL327 by using the formula: (SMDMA−SSL327/MDMA)/(SMDMA−Svehicle)×100).
The transcripts selected on the genechips were characterized using NetAffix™ Analysis Center (http://www.affymetrix.com/analysis/index.affx). Genes were clustered into functional categories based on GO (Gene Ontology; http://www.geneontology.org) and literature searches.
RNA isolation and Reverse Transcription for quantitative PCR
Total RNA used for quantitative PCR experiments were extracted from individual dorsal striatum by a modified acid-phenol guanidinum method, following the manufacturer’s protocol (RNABle ®, Eurobio, France). The quality of the RNA samples was determined by electrophoresis through agarose gels and staining with ethidium bromide. Quantification of total RNA was assessed by spectrophotometry. Reverse transcription of RNA was performed in a final volume of 20 μl containing 1x first strand buffer (Invitrogen, France), 500 μM each dNTP, 20 U of Rnasin ribonuclease inhibitor (Promega, France), 10 mM dithiothreitol, 100 U of Superscript II Rnase H− reverse transcriptase (Invitrogen, France), 1.5 μM random hexanucleotide primers (Amersham Biosciences, France) and 1 μg of total RNA. The samples were incubated at 25°C-10 min, 42°C-30 min and reverse transcriptase was inactivated by heating at 99°C for 5 min.
Real-time quantitative RT-PCR
PCR primers were chosen with the assistance of Oligo 6.42 software (MedProbe, Norway). The primer nucleotide sequences used in this study are listed in Table 1. Fosb primers were designed in order to be specific of the entire form of the Fosb gene, and did not amplify the truncated form ΔFosb. Fluorescent PCR reactions were performed on a Light-Cycler® instrument (Roche Diagnostics) using the LC-FastStart DNA Master SYBR Green I kit (Roche Diagnostics). The cDNAs were diluted 500-fold and 5 μl were added to the PCR reaction mix to yield a total volume of 10 μl. The reaction buffer contained 4 mM MgCl2 and 0.5 μM of each primer. The PCR reactions were performed with 12 samples/drug treatment, each sample being prepared with bilateral dorsal striatum from one mouse. Quantification was made on the basis of a calibration curve using cDNA from an untreated mouse brain. In addition to the genes of interest, the Hprt transcript (hypoxanthine guanine phosphoribosyl transferase) was also quantified and each sample was normalized on the basis of its Hprt content. Results are expressed as gene of interest transcript/Hprt transcript.
Table 1.
Primer Sequences Used for SYBR Green-based Real-time Quantitative Polymerase Chain Reaction.
| Gene | Upstream Primer | Downstream Primer |
|---|---|---|
| Fos | GGCAAAGTAGAGCAGCTATCTCCT | TCAGCTCCCTCCTCCGATTC |
| Fosl2 | CTTCGTCGCCCTCAGAGTCC | TGTGGGGGAGTTCAAGGAGTCT |
| Fosb | AACGCCTGGAGTTTGTCCT | GACCCTGGCAAATCTCTCAC |
| Egr1 | GAGCCCGCACCCAACAGTG | TGGGGCTCAGGAAAAATGTCA |
| Egr2 | CGCCACACCAAGATCCACC | AGCCCCCAGGACCAGAGG |
| Rhoe | GATCGGAGCAGCCACTTACATAG | GGTGGCGACGTGAAAAATGT |
| Rem2 | ACGGGGGATGCCTTTCTCAT | GAGCGGGCCAGGTCACTCTT |
| Dnajb5 | CGGCGGTGGTTCCTCAG | CGGCTGCTGGCAAAGAAGA |
| Nts | AGCAGGGCCTTTCAACACTG | AGGAACCCCTCTTGAGAATGTAG |
| Ttr | CGG GCT CAC CAC AGA TG | GGG GAA ATG CCA ACT GTC |
| Hprt | CTGTGGCCATCTGCCTAGTAAAG | GGGGACGCAGCAGCAACTGACA |
Statistical analysis
All series of data were analysed with GraphPad Prism® 4.0 or Statview 5.0 software. Statistical analyses for western-blot experiment were performed using one-way ANOVA, followed by a Newman-Keuls Multiple Comparison Test. For real-time quantitative RT-PCR results, data were analyzed using one-way ANOVA between subjects, followed by a Fisher-PLSD test for post-hoc comparisons. For kinetics studies Student’s test was used for analysis. The level of significance was set at p < 0.05.
RESULTS
Activation of ERK by acute MDMA in the dorsal striatum: blockade by SL327 pretreatment
Activation of ERK by MDMA in mouse dorsal striatum was assessed by western blot. As shown in Figure 1 MDMA (9 mg/kg; i.p.) induces ERK activation at 10min in this structure. Animals treated by MDMA showed a 45% increase in pERK expression as compared to control (p<0.05). Furthermore, pretreatment with the MEK (ERK kinase) inhibitor SL327 at the dose of 50 mg/kg, injected 1 hour before MDMA, significantly blocked this increase (p<0.001). SL327 pretreatment was also able to reduce basal ERK-activation (p<0.01). However, there was no statistical difference between the SL327 and SL327/MDMA groups.
Figure 1.

Western-blot analysis of the effects of an acute MDMA injection (9 mg/kg; i.p.) ± SL327 (50 mg/kg; i.p.) on pERK expression in the dorsal striatum. SL327 was administered 1 hour before MDMA and mice were killed 10 minutes after the last injection (see methods for details). Data were expressed as a percentage of vehicle-treated mice and represent means ± SEM of pERK/total ERK optical density for the isoform ERK2 (n = 7 – 8/group). A representative immunoblot is presented above the histograms. Statistical analysis was done by ANOVA, followed by a Newman-Keuls Multiple Comparison Test. * p<0.05 compared to control group. ### p<0.001 compared to MDMA alone.
Microarray analysis
cDNA arrays were used to identify gene expression profiles in the mouse dorsal striatum 2 hours after an acute injection of MDMA (9 mg/kg), with or without the ERK inhibitor SL327 (50 mg/kg). Using the criteria detailed in the Methods section, we identified a total of 27 genes, with 24 being up-regulated and 3 being down-regulated by MDMA. Most of the genes identified could be subdivided into functional families, as reported in Table 2. The transcription factors represent the largest family, with 9 genes regulated by MDMA treatment (8 being up-regulated and 1 down-regulated), encompassing transcripts from the fos and egr families. Two characterized genes, transthyretin (Ttr, up-regulated by MDMA) and tetratricopeptide repeat domain 14 (Ttc14, down-regulated) could not been clustered because their exact brain function is currently unknown. Two more transcripts up-regulated by MDMA treatment (9530076L18 and 9430059P22Rik) correspond to proteins that have not been characterized yet, and that display no homology with conserved domains proteins.
Table 2. Classification of potentially regulated genes in the mouse striatum 2h following MDMA treatment: identification of ERK-dependant genes.
The values in the first column correspond to the means of the signal Iog2 ratio (in bracket) and the consecutive calculated fold-change between MDMA and vehicle treatments. In the second column, the values represent the percentage of inhibition by SL327 pretreatment on MDMA-induced gene expression (see Methods for details). In a purpose of comparison, the values in bold character represent the fold-change between MDMA and vehicle treatment (first column) and the subsequent percentage of inhibition by SL327 pretreatment (second column) obtained with the quantitative PCR experiments.
| Genebank accession | Description | Effect of MDMA treatment: Fold Change (SLR) | % inhibition by SL327 pretreatment |
|---|---|---|---|
| Transcription factors and DNA binding activity | |||
| BC029814 | FBJ osteosarcoma oncogene (Fos) | 5.1 (2.36)
2.9 |
35% ^# 30% |
| BC065131 | fos-like antigen 2 (Fosl2, Fra-2)* | 2.3 (1.21)
2.8 (1.51) 3.1 |
62% ^ 44% ^# 45% |
| X14897 | FBJ osteosarcoma oncogene B (Fosb) | 4.2 (2.09)
3.0 |
64% # 65% |
| J03236 | Jun-B oncogene (Junb) | 4.8 (2.25) | n.i. |
| J04113 | nuclear receptor subfamily 4, group A, member 1 (Nr4a1, NGFI-B) | 5.1 (2.36) | n.i. |
| M22326 | early growth response 1 (Egr1, NGFI-A, Krox24) | 2.8 (1.48)
1.7 |
78% ^# 107% |
| X06746 | early growth response 2 (Egr2) | 3.7 (1.87)
2.9 |
77% ^# 107% |
| BC052022 | transcription factor 7-like 2, T-cell specific, HMG-box (Tcf712) | −1.8 (−0.88) | n.i. |
| BC076634 | cDNA sequence BC049807 (similarities with mouse Zinc finger protein 51) | 1.5 (0.58) | 53% # |
| Intracellular phosphatases | |||
| X61940 | dual specificity phosphatase 1 (Dusp1, mkp-1) | 2.7 (1.43) | n.i. |
| AK079362 | dual specificity phosphatase 14 (Dusp14, Mkp6) | 1.9 (0.93) | 32% ^# |
| XM_140740 | gene model 337, (NCBI) (Gm337, similar to MAP-kinase phosphatase (cpg21)) | 1.7 (0.78) | n.i. |
| Cytoskeleton regulation/Intracellular signaling | |||
| AK011442 | ras homolog gene family, member E (Rhoe)* | 2.0 (0.99)
1.9 (0.91) 2.4 |
57% ^# 46% ^# 85% |
| AF127084 | PDZ domain containing RING finger 3 (Pdzrn3, semaphorin cytoplasmic domain-associated protein 3A) | 1.4 (0.52) | n.i. |
| Oxygene transport | |||
| V00714 | hemoglobin alpha, adult chain 1 (Hba-a1) | 2.8 (1.50) | 54% ^# |
| AK028067 | hemoglobin, beta adult major chain (Hbb-b1)* | 2.8 (1.47)
2.9 (1.52) |
77% ^# |
| Cellular stress/molecular chaperones | |||
| BC057087 | DnaJ (Hsp40) homolog, subfamily B, member 5 (Dnajb5) | 1.4 (0.52)
1.5 |
86% ^# 135% |
| X54149 | growth arrest and DNA-damage-inducible 45 beta (Gadd45b) | 3.2 (1.70) | n.i. |
| Synaptic function/Neuropeptide | |||
| XM_1 34994 | similar to Munc13-3 | 1.4 (0.50) | n.i. |
| AK045409 | carrier family 17 (sodium-dependent inorganic phosphate cotransporter), member 6 (Slc17a6, VGLUT2) | −1.6 (−0.69) | n.i. |
| BC043024 | neurotensin (Nts) | 1.4 (0.52)
1.4 |
145% ^# 117% |
| Cellular trafficking | |||
| BC002229 | RIKEN cDNA 2810405I11 gene (similar to human CHMP1.5 protein) | 1.4 (0.52) | n.i. |
| Extracellular matrix component | |||
| BC005611 | chitinase 3-like 1 (Chi3l1) | 2.9 (1.54) | 43% ^# |
| Unknown brain function/RIKEN | |||
| D89076 | Transthyretin (Ttr) | 2.7 (1.43)
3.0 |
147% ^# 92% |
| BC024847 | tetratricopeptide repeat domain 14 (Ttc14) | −1.4 (−0.52) | n.i. |
| AK035610 | hypothetical protein 9530076L18 | 2.3 (1.23) | 95% ^# |
| AK034905 | RIKEN cDNA 9430059P22 gene | 3.0 (1.58) | 82% ^# |
transcript found regulated in two different probe sets on the array.
consistency of change call (more than 6/12) for the comparison between SL327/MDMA and DMSO/MDMA arrays.
significant difference between SL327/MDMA and MDMA absolute expression values assayed by t-test.
n.i.: no inhibition by SL327 pretreatment (the transcript doesn’t fulfil the criteria of consistency change call or significant difference between signal values).
Among the 27 genes regulated by MDMA treatment, 16 were partially or totally inhibited by SL327 pretreatment (see Table 2 for details). Only genes up-regulated by MDMA were affected by ERK inhibition, and the three MDMA down-regulated transcripts (Tcf7l2, VGLUT2, and Ttc14) were not modified by SL327 pretreatment. Within the transcription factors and DNA binding proteins family, the induction of all Fos and Egr related transcripts were inhibited by SL327 pretreatment. Furthermore, MDMA-induced transcription of BC049807, a zinc finger protein with DNA-binding activity, was also partially blocked by this inhibitor. The increased transcription (by about 3 fold) of the two hemoglobin genes (alpha1 and beta1) by acute MDMA was also partially (Hba-a1, 54%) or almost totally (Hbb-b1, 77%) inhibited by SL327. Among the three intracellular phosphatases which transcription was induced by MDMA, only one (Dusp14) showed a weak inhibition (32%) using the inhibitor. The MDMA-increased transcription of Rhoe and of chitinase 3-like 1 (Chi3l1) a component of the extracellular matrix were also attenuated by SL327 pretreatment. The MDMA-induced transcripts that displayed the strongest inhibition with SL327 pretreatment, suggesting that their increase is totally or almost totally ERK-dependent, were Dnajb5 (86% inhibition on the array), the neuropeptide neurotensin (145% inhibition), transthyretin (Ttr, 147% inhibition) and the two hypothetical proteins with unknown function (95% and 82% inhibition).
Confirmation of several genes identified in the microarray study
Real time quantitative PCR was used to confirm the data obtained using the oligonucleotide array approach. We selected nine of the genes up-regulated by MDMA and potentially inhibited by SL327 pretreatment : Fos, Fosl2, Fosb, Egr1, Egr2, Rhoe, Dnajb5, Nts and Ttr. The quantitative PCR results confirmed those obtained in the array experiments (Figure 2). Furthermore, the quantitative results (fold-change and percentage of inhibition) were similar to those calculated in the array experiments (compare values in Table 2). Only Fos gene failed to display a significant inhibition of its MDMA-induced transcription by SL327 pretreatment, although there was a strong tendency with a p-value of 0.0514.
Figure 2.
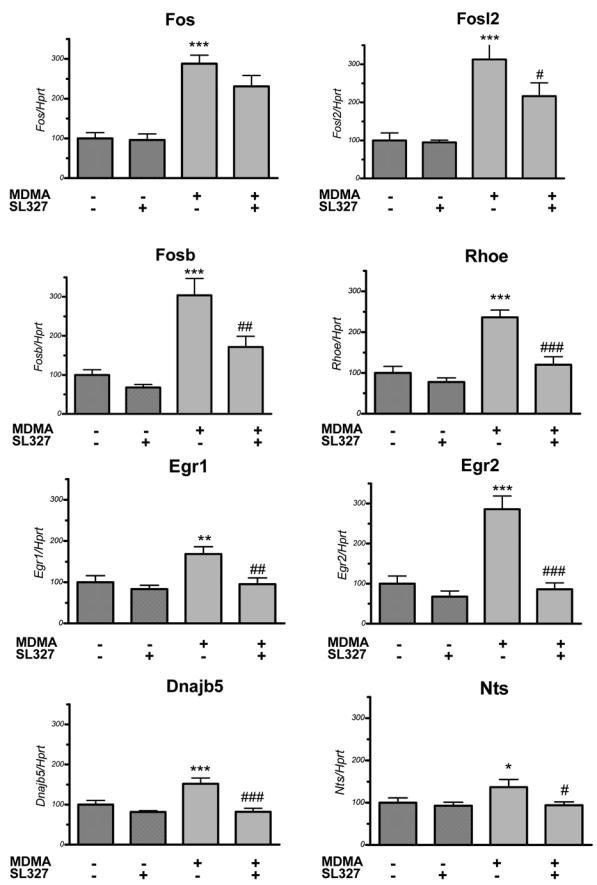
Real time quantitative PCR confirmation of SL327 ± MDMA induced changes in 8 transcripts. SL327 was administered 1 hour before MDMA and mice were killed 2 hours after the last injection. The mRNA levels were measured as fluorescent intensities using quantitative real-time PCR and normalized to Hprt mRNA levels (see methods for details). Values represent means ± SEM (percentage of vehicle-treated animals; n = 10 – 12/group). Statistical analysis was done by ANOVA, followed by Fisher’s PLSD. * p<0.05, ** p<0.01 and *** p<0.001 compared to control group. # p<0.05, ## p<0.01 and ### p<0.001 compared to MDMA alone.
Among the genes confirmed by the quantitative PCR experiments, Rhoe MDMA-induced transcription was increased by 2.4 (p<0.001), and was blocked by SL327 pretreatment (85% inhibition, p<0.001). Interestingly another GTPase (Rem2) showing similarities with Rhoe, almost fulfilled the criteria detailed in the Materials and Methods section for the identification of potentially MDMA-regulated gene in the microarray experiments, although not completely. We performed real-time quantitative PCR experiments to check if Rem2 transcription was regulated by MDMA administration, and impaired by SL327 pretreatment (Figure 3). The results showed that MDMA could increase Rem2 transcription by 1.32 (p<0.05), and this effect was totally blocked by SL327 pretreatment (p<0.05).
Figure 3.
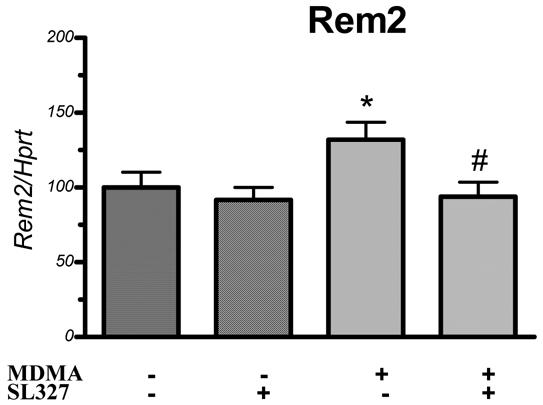
Real time quantitative PCR analysis of SL327 ± MDMA treatment effect on Rem2 transcription. SL327 was administered 1 hour before MDMA and mice were killed 2 hours after the last injection. The mRNA levels were measured as fluorescent intensities using quantitative real-time PCR and normalized to Hprt mRNA levels (see methods for details). Values represent means ± SEM (percentage of vehicle-treated animals; n = 12/group). Statistical analysis was done by ANOVA, followed by Fisher’s PLSD. * p<0.05 compared to control group. #p<0.05 compared to MDMA alone.
Kinetics of the regulations observed
Real time quantitative PCR was used to study the kinetics of the regulations induced by acute injection of MDMA. For this study we selected the four non immediate early genes : Nts, Dnajb5, Rem2 and Rhoe. In addition to the time point of 2h post injection two subsequent time points were assessed (4h and 6h). The four genes displayed different kinetics over the examined time period (Figure 4). Rhoe was still up-regulated over the period examined, but displayed a decrease in the fold changes with values of 2.4 (p<0.001) at 2h post injection, 1.56 (p<0.001) and 1.78 (p<0.01) at 4h and 6h post injection. Interestingly over the same period of time the similar GTPase Rem2 had an almost stable regulation with a fold change of 1.32 (p<0.05), 1.41 (p<0.05) and 1.47 (p<0.05) at 2h, 4h and 6h post injection respectively. A slight increase in the fold change was observed for Dnajb5 (1.5 (p<0.001) at 2h, 1.59 (p<0.01) at 4h and 1.91 (p<0.001) at 6h) while a marked increase was obtained in the case of Nts with fold changes raising from 1.4 (p<0.05) at 2h to 1.81 (p<0.001) at 4h and 2.6 (p<0.001) at 6h.
Figure 4.

Kinetics of the effect of MDMA treatment on Rhoe, Rem2, Dnajb5 and Nts transcription. Mice were killed 2, 4 and 6 hours after MDMA injection. The mRNA levels were measured as fluorescent intensities using quantitative real-time PCR and normalized to Hprt mRNA levels (see methods for details). Values represent fold change as compared to vehicle-treated animals at each time point (n = 12/group). Statistical analysis was done by Student’s test. * p<0.05, ** p<0.01 and *** p<0.001 compared to control.
DISCUSSION
In order to extend our previous study, showing the major role of ERK in behavioural and rewarding effects of MDMA in mice (Salzmann et al., 2003), we performed a broad analysis of MDMA-transcriptional effects in the dorsal striatum, using a microarray approach. This brain structure was selected based on our previous results with IEGs, showing its important role in ERK-related MDMA-transcriptional effects. To identify the genes regulated by acute MDMA administration and specifically controlled by ERK activation, the non neurotoxic but pharmacologically active dose of 9 mg/kg was used. This should only lead to the identification of genes related to MDMA-induced neuronal plasticity, and not to neurotoxic mechanism.
ERK activation in the mouse dorsal striatum by MDMA at the dose of 9 mg/kg was demonstrated by western-blot. This activation is completely blocked by a selective inhibitor of MEK kinase, SL327, which has no significant effect on a variety of other kinases such as PKC, CAMKII or PKA (Atkins et al., 1998, Selcher et al., 1999). This result confirms our previous study, which demonstrated that ERK activation was involved in the behavioural and IEG-transcriptional effects of MDMA in mice. ERK is an important regulator of neuronal functions, and has been shown to be implicated in various neurobiological event such as synaptic plasticity and memory (Review in Thomas and Huganir, 2004). Moreover, recent data suggest that ERK is directly related to the development or expression of THC-, cocaine-and MDMA-rewarding properties in mice (Valjent et al., 2000, Valjent et al., 2001, Salzmann et al., 2003).
The microarray analysis performed in the dorsal striatum led to the identification of 27 genes regulated by acute MDMA administration, most of them being up-regulated (24 out of 27). Among them, 59% were partially or totally inhibited by SL327 pretreatment. Only MDMA up-regulated genes were affected by ERK inhibition. Interestingly, among the genes whose expressions are independent (or weakly dependent) on ERK activation; we have identified three intracellular MAPK phosphatases (Dusp Dusp1, Dusp14 and Cpg21). Regulation of protein phosphorylation by changes in phosphatases activity is believed to be a crucial event in synaptic plasticity (Gurd, 1997). This effect could correspond to a down-regulation of ERK and/or other MAPKs activities.
On the basis of the results already published with different drugs of abuse (Ujike et al., 2002, Marie-Claire et al., 2004), we have focused our attention on genes that belong to transcription factors family, signalling pathways and synaptic function. Nine ERK-dependent genes were selected and their regulations were confirmed using real time quantitative PCR analysis. These results show that the criteria used for the microarray analysis lead to potentially regulated transcripts with high confidence.
The largest family of genes identified belongs to the transcription factor group. This is not surprising because at 2 hours post-treatment, the time used in this study, the IEGs, which mainly encode transcription factors, are still induced (Herdegen and Leah, 1998). Among this group, we observed that MDMA up-regulates genes from the Fos and Egr families. These observations confirm those of others who have reported MDMA-induced increase in Egr-1, Fos, and Fra-2 expression in several brain regions at the mRNA and/or protein levels (Stephenson et al., 1999, Pennypacker et al., 2000, Shirayama et al., 2000). These transcription factors, which are components of the first wave of gene expression induced by MDMA treatment, stimulate discrete programs of late response gene expression. They certainly play key roles in the conversion of short-term neuronal stimulation into specific long-lasting changes in cell function (O’Donovan et al., 1999). The Fos-related MDMA-induced transcriptional activation was partially prevented by SL327, suggesting that ERK is not the only pathway leading to this regulation. Other intracellular signalling components are likely to be involved in this effect, like PKA activation. Conversely, as shown with real time quantitative PCR results, MDMA-induced Egr transcription was totally dependent upon ERK activation. These results are in agreement with our previous study. Interestingly, a recent study using the SL327 inhibitor showed that ERK activation mediates acute cocaine-induced protein expression of Fos family genes in the caudate putamen of mice, including Fos, Fosb, and Fra-2 (Zhang et al., 2004).
Among the genes upregulated by MDMA treatment and entirely dependent upon ERK activation, transthyretin (Ttr) seems to be very interesting. Transthyretin is widely known for its transporter function of thyroxine and retinol in plasma and cerebrospinal fluid, but recent data suggest that this protein could also have essential brain functions, that might not be related to hormone transport (Stork et al., 2001, Bejar et al., 2002, Sousa et al., 2004). In a transgenic mouse model for calmodulin-dependent protein kinase II, long-term potentiation was enhanced, which was accompanied by an increase in transthyretin transcription in the hippocampus (Bejar et al., 2002). Furthermore, a recent study using Ttr-null mice showed that the absence of transthyretin was associated with increased exploratory activity, reduced signs of depressive-like behaviour and increased levels of noradrenalin in the limbic forebrain (Sousa et al., 2004). Together, these results suggest a role of transthyretin in synaptic plasticity and behavioural responses, that could underlie MDMA-induced neuroadaptative changes.
Neurotensin was weakly up-regulated by MDMA on the microarray two hours after administration, and this induction was confirmed by quantitative PCR. Moreover the up-regulation of this gene displayed a marked increase at six hours post injection indicating that this might have a major impact. This neuropeptide plays a key role in modulation of dopamine transmission, and is involved in the effects of psychostimulants, like sensitization and reward (Binder et al., 2001). Furthermore, previous studies have shown that MDMA was able to increase neurotensin immunoreactivity in several brain regions, including striatum (Hanson et al., 1989, Johnson et al., 1991). Thus, neurotensin might play a key role in MDMA stimulant effects.
Dnajb5, also called Hsc40, is a heat shock protein belonging to the DnaJ/Hsp40 family. Hsp40 proteins are working in concert with members of Hsp70 family (Ohtsuka and Suzuki, 2000). Heat shock proteins play a major role in protecting the cells from hyperthermia and oxidative stress. MDMA is known to produce these kinds of injuries in brain. However, in the present study, we used a non neurotoxic dose of MDMA (9 mg/kg), that does not induce hyperthermia (data not shown) nor any long-term dopaminergic loss (Robledo et al., 2004; Le Guen et al., personnal communication). Thus, MDMA-induced Dnajb5 transcription could not be related to a stress-stimulus response, and may suggest that this protein is involved in other mechanisms that neuroprotection. Dnajb5 is both constitutively expressed and stress-inducible, and shows the same pattern of expression to that of Hsc70, strongly suggesting that these two proteins may work together to perform their specific functions (Chen et al., 1999). Interestingly, Hsc70 is expressed in postsynaptic structures of rat brains (Suzuki et al., 1999), and several lines of evidence indicate that this molecular chaperone is related to the expression of synaptic plasticity (review: Ohtsuka and Suzuki, 2000). Thus, Dnajb5 could be involved in regulation of synaptic activity via its interaction with Hsc70, and its induction by MDMA could be related to this specific neuronal effect.
Acute MDMA treatment induced robust increase of Rhoe transcription in the dorsal striatum, further confirmed by quantitative PCR. Althought its increase was only partially inhibited by SL327 in the microarray experiment (46–57%), quantitative PCR results showed that this inhibition was almost total (85%), suggesting that ERK activation is a major pathway leading to MDMA-induced Rhoe transcription. Although the up-regulation of Rhoe showed a slight decrease over the period of time examined, this gene remained significatively up-regulated six hours after a single MDMA injection. Rhoe, also known as Rnd3, is a member of the newly identified Rnd subfamily of Rho GTPases proteins, which are major actors in the regulation of the actin cytoskeleton (Etienne-Manneville and Hall, 2002). However, Rnd proteins have opposite effects compared to ‘classic’ Rho proteins, such as RhoA. Rnd proteins provoke a decrease in stress fibers in fibroblasts and epithelial cells (Guasch et al., 1998, Nobes et al., 1998), and induce neurite process formation in neurons (Aoki et al., 2000). These effects of Rnd proteins are mediated by antagonizing RhoA function in cells, via two different mechanisms: inhibition of the RhoA effector kinase ROCK (Riento et al., 2003), and stimulation of RhoGAP (Rho GPTase Activating Protein), a negative regulator of RhoA activity (Wennerberg et al., 2003). Moreover, contrasting with ‘classic’ Rho proteins, Rnd proteins lack GTPase activity and are constitutively GTP bound within the cell (Foster et al., 1996, Guasch et al., 1998). It has been suggested that activity of Rnd proteins might not be controlled by the classic GTP/GDP switch as in ‘classic’ Rho GTPases, but instead might be regulated by their levels of expression. Indeed, it has been shown that Rhoe expression was induced in epithelial oncogenesis, and that this increase was mediated by ERK activation (Hansen et al., 2000). Consistent with these data, we show that MDMA-induced upregulation of Rhoe expression at the transcriptional level is ERK dependent.
In this study, we could show that an other small GTP binding protein, Rem2, was also induced by MDMA, and that this effect was totally blocked by SL327 pretreatment. Rem2 is a member of the RGK (Rem, Rad, and Gem/Kir) family, which shows striking functional similarities with the Rnd family. Like Rnd proteins, RGKs share the uncommon feature for small GTPases to be regulated at the transcriptional level. Furthermore, RGK have a role in cytoskeleton reorganisation, and can induce neurite extension in neuroblastoma cells (Leone et al., 2001, Ward et al., 2002), through mechanisms similar to those previously described with Rnd proteins (Aresta et al., 2002, Ward et al., 2002). This gene displayed a sustained up-regulation over the first six hours after MDMA acute injection.
Therefore, Rem2 and Rhoe, two proteins sharing similar functions and displaying the same mechanism of action (inhibition of Rho signalling), are upregulated at the transcriptional level by MDMA treatment through an ERK-dependent pathway. These results suggest that Rho/ROCK signalling is strongly involved in the effects of MDMA or other substituted amphetamines.
Our study shows that a single dose of MDMA can induce multiple transcriptional changes in the mouse striatum. As ERK pathway appears to play a role in the development of addiction-like properties of MDMA (Salzmann et al., 2003), genes controlled by ERK activation might specifically contribute to some aspects of MDMA-induced long-lasting changes in cell functions, like those underlying the behavioural properties of the drug.
Acknowledgments
The authors wish to thank David Gentien for technical contributions with the Affymetrix microarray hybridizations. This work was supported by grant 4999 from the Consortium national de recherche en genomique (CNRG) for the Affymetrix Genechips supply and grant (035330) from the Ministere de la jeunesse, de l’Education Nationnale et de la Recherche (France). Julie Salzmann was supported by a grant from the Chancellerie des Universités de Paris.
Abbreviations
- 5-HT
serotonin
- DA
dopamine
- DMSO
dimethyl sulfoxide
- IEG
immediate early gene
- MDMA
3,4-methylendioxymethamphetamine
References
- Aoki J, Katoh H, Mori K, Negishi M. Rnd1, a novel rho family GTPase, induces the formation of neuritic processes in PC12 cells. Biochem Biophys Res Commun. 2000;278:604–608. doi: 10.1006/bbrc.2000.3842. [DOI] [PubMed] [Google Scholar]
- Aresta S, de Tand-Heim MF, Beranger F, de Gunzburg J. A novel Rho GTPase-activating-protein interacts with Gem, a member of the Ras superfamily of GTPases. Biochem J. 2002;367:57–65. doi: 10.1042/BJ20020829. [DOI] [PMC free article] [PubMed] [Google Scholar]
- Atkins CM, Selcher JC, Petraitis JJ, Trzaskos JM, Sweatt JD. The MAPK cascade is required for mammalian associative learning. Nat Neurosci. 1998;1:602–609. doi: 10.1038/2836. [DOI] [PubMed] [Google Scholar]
- Battaglia G, Brooks BP, Kulsakdinun C, De Souza EB. Pharmacologic profile of MDMA (3,4-methylenedioxymethamphetamine) at various brain recognition sites. Eur J Pharmacol. 1988;149:159–163. doi: 10.1016/0014-2999(88)90056-8. [DOI] [PubMed] [Google Scholar]
- Bejar R, Yasuda R, Krugers H, Hood K, Mayford M. Transgenic calmodulin-dependent protein kinase II activation: dose-dependent effects on synaptic plasticity, learning, and memory. J Neurosci. 2002;22:5719–5726. doi: 10.1523/JNEUROSCI.22-13-05719.2002. [DOI] [PMC free article] [PubMed] [Google Scholar]
- Binder EB, Kinkead B, Owens MJ, Nemeroff CB. Neurotensin and dopamine interactions. Pharmacol Rev. 2001;53:453–486. [PubMed] [Google Scholar]
- Chen MS, Roti JR, Laszlo A. Hsc40, a new member of the hsp40 family, exhibits similar expression profile to that of hsc70 in mammalian cells. Gene. 1999;238:333–341. doi: 10.1016/s0378-1119(99)00333-9. [DOI] [PubMed] [Google Scholar]
- Etienne-Manneville S, Hall A. Rho GTPases in cell biology. Nature. 2002;420:629–635. doi: 10.1038/nature01148. [DOI] [PubMed] [Google Scholar]
- Foster R, Hu KQ, Lu Y, Nolan KM, Thissen J, Settleman J. Identification of a novel human Rho protein with unusual properties: GTPase deficiency and in vivo farnesylation. Mol Cell Biol. 1996;16:2689–2699. doi: 10.1128/mcb.16.6.2689. [DOI] [PMC free article] [PubMed] [Google Scholar]
- Green AR, Mechan AO, Elliott JM, O’Shea E, Colado MI. The pharmacology and clinical pharmacology of 3,4-methylenedioxymethamphetamine (MDMA, “ecstasy”) Pharmacol Rev. 2003;55:463–508. doi: 10.1124/pr.55.3.3. [DOI] [PubMed] [Google Scholar]
- Guasch RM, Scambler P, Jones GE, Ridley AJ. RhoE regulates actin cytoskeleton organization and cell migration. Mol Cell Biol. 1998;18:4761–4771. doi: 10.1128/mcb.18.8.4761. [DOI] [PMC free article] [PubMed] [Google Scholar]
- Gurd JW. Protein tyrosine phosphorylation: implications for synaptic function. Neurochem Int. 1997;31:635–649. doi: 10.1016/s0197-0186(97)00022-3. [DOI] [PubMed] [Google Scholar]
- Hansen SH, Zegers MM, Woodrow M, Rodriguez-Viciana P, Chardin P, Mostov KE, McMahon M. Induced expression of Rnd3 is associated with transformation of polarized epithelial cells by the Raf-MEK-extracellular signal-regulated kinase pathway. Mol Cell Biol. 2000;20:9364–9375. doi: 10.1128/mcb.20.24.9364-9375.2000. [DOI] [PMC free article] [PubMed] [Google Scholar]
- Hanson GR, Sonsalla P, Letter A, Merchant KM, Johnson M, Bush L, Gibb JW. Effects of amphetamine analogs on central nervous system neuropeptide systems. NIDA Res Monogr. 1989;94:259–269. [PubMed] [Google Scholar]
- Herdegen T, Leah JD. Inducible and constitutive transcription factors in the mammalian nervous system: control of gene expression by Jun, Fos and Krox, and CREB/ATF proteins. Brain Res Brain Res Rev. 1998;28:370–490. doi: 10.1016/s0165-0173(98)00018-6. [DOI] [PubMed] [Google Scholar]
- Johnson M, Bush LG, Gibb JW, Hanson GR. Blockade of the 3,4- methylenedioxymethamphetamine-induced changes in neurotensin and dynorphin A systems. Eur J Pharmacol. 1991;193:367–370. doi: 10.1016/0014-2999(91)90153-h. [DOI] [PubMed] [Google Scholar]
- Kramer HK, Poblete JC, Azmitia EC. Characterization of the translocation of protein kinase C (PKC) by 3,4-methylenedioxymethamphetamine (MDMA/ecstasy) in synaptosomes: evidence for a presynaptic localization involving the serotonin transporter (SERT) Neuropsychopharmacology. 1998;19:265–277. doi: 10.1016/S0893-133X(98)00027-X. [DOI] [PubMed] [Google Scholar]
- Leone A, Mitsiades N, Ward Y, Spinelli B, Poulaki V, Tsokos M, Kelly K. The Gem GTP-binding protein promotes morphological differentiation in neuroblastoma. Oncogene. 2001;20:3217–3225. doi: 10.1038/sj.onc.1204420. [DOI] [PubMed] [Google Scholar]
- Marie-Claire C, Courtin C, Roques BP, Noble F. Cytoskeletal Genes Regulation by Chronic Morphine Treatment in Rat Striatum. Neuropsychopharmacology. 2004 doi: 10.1038/sj.npp.1300513. in press. [DOI] [PubMed] [Google Scholar]
- Nobes CD, Lauritzen I, Mattei MG, Paris S, Hall A, Chardin P. A new member of the Rho family, Rnd1, promotes disassembly of actin filament structures and loss of cell adhesion. J Cell Biol. 1998;141:187–197. doi: 10.1083/jcb.141.1.187. [DOI] [PMC free article] [PubMed] [Google Scholar]
- O’Donovan KJ, Tourtellotte WG, Millbrandt J, Baraban JM. The EGR family of transcription-regulatory factors: progress at the interface of molecular and systems neuroscience. Trends Neurosci. 1999;22:167–173. doi: 10.1016/s0166-2236(98)01343-5. [DOI] [PubMed] [Google Scholar]
- Ohtsuka K, Suzuki T. Roles of molecular chaperones in the nervous system. Brain Res Bull. 2000;53:141–146. doi: 10.1016/s0361-9230(00)00325-7. [DOI] [PubMed] [Google Scholar]
- Pennypacker KR, Yang X, Gordon MN, Benkovic S, Miller D, O’Callaghan JP. Long-term induction of Fos-related antigen-2 after methamphetamine-, methylenedioxymethamphetamine-, 1-methyl-4-phenyl-1,2,3, 6- tetrahydropyridine-and trimethyltin-induced brain injury. Neuroscience. 2000;101:913–919. doi: 10.1016/s0306-4522(00)00381-x. [DOI] [PubMed] [Google Scholar]
- Riento K, Guasch RM, Garg R, Jin B, Ridley AJ. RhoE binds to ROCK I and inhibits downstream signaling. Mol Cell Biol. 2003;23:4219–4229. doi: 10.1128/MCB.23.12.4219-4229.2003. [DOI] [PMC free article] [PubMed] [Google Scholar]
- Robledo P, Balerio G, Berrendero F, Maldonado R. Study of the behavioural responses related to the potential addictive properties of MDMA in mice. Naunyn Schmiedebergs Arch Pharmacol. 2004;369:338–349. doi: 10.1007/s00210-003-0862-9. [DOI] [PubMed] [Google Scholar]
- Salzmann J, Marie-Claire C, Le Guen S, Roques BP, Noble F. Importance of ERK activation in behavioral and biochemical effects induced by MDMA in mice. Br J Pharmacol. 2003;140:831–838. doi: 10.1038/sj.bjp.0705506. [DOI] [PMC free article] [PubMed] [Google Scholar]
- Selcher JC, Atkins CM, Trzaskos JM, Paylor R, Sweatt JD. A necessity for MAP kinase activation in mammalian spatial learning. Learn Mem. 1999;6:478–490. doi: 10.1101/lm.6.5.478. [DOI] [PMC free article] [PubMed] [Google Scholar]
- Shirayama Y, Hashimoto K, Iyo M, Watanabe K, Higuchi T, Minabe Y. 3,4-methylenedioxymethamphetamine (MDMA, ecstasy)-induced egr-1 mRNA in rat brain: pharmacological manipulation. Eur J Pharmacol. 2000;402:215–222. doi: 10.1016/s0014-2999(00)00521-5. [DOI] [PubMed] [Google Scholar]
- Sousa JC, Grandela C, Fernandez-Ruiz J, de Miguel R, de Sousa L, Magalhaes AI, Saraiva MJ, Sousa N, Palha JA. Transthyretin is involved in depression-like behaviour and exploratory activity. J Neurochem. 2004;88:1052–1058. doi: 10.1046/j.1471-4159.2003.02309.x. [DOI] [PubMed] [Google Scholar]
- Stephenson CP, Hunt GE, Topple AN, McGregor IS. The distribution of 3,4- methylenedioxymethamphetamine “Ecstasy”-induced c-fos expression in rat brain. Neuroscience. 1999;92:1011–1023. doi: 10.1016/s0306-4522(99)00049-4. [DOI] [PubMed] [Google Scholar]
- Stork O, Stork S, Pape HC, Obata K. Identification of genes expressed in the amygdala during the formation of fear memory. Learn Mem. 2001;8:209–219. doi: 10.1101/lm.39401. [DOI] [PMC free article] [PubMed] [Google Scholar]
- Suzuki T, Usuda N, Murata S, Nakazawa A, Ohtsuka K, Takagi H. Presence of molecular chaperones, heat shock cognate (Hsc) 70 and heat shock proteins (Hsp) 40, in the postsynaptic structures of rat brain. Brain Res. 1999;816:99–110. doi: 10.1016/s0006-8993(98)01083-x. [DOI] [PubMed] [Google Scholar]
- Thomas GM, Huganir RL. MAPK cascade signalling and synaptic plasticity. Nat Rev Neurosci. 2004;5:173–183. doi: 10.1038/nrn1346. [DOI] [PubMed] [Google Scholar]
- Ujike H, Takaki M, Kodama M, Kuroda S. Gene expression related to synaptogenesis, neuritogenesis, and MAP kinase in behavioral sensitization to psychostimulants. Ann N Y Acad Sci. 2002;965:55–67. doi: 10.1111/j.1749-6632.2002.tb04151.x. [DOI] [PubMed] [Google Scholar]
- Valjent E, Corvol JC, Pages C, Besson MJ, Maldonado R, Caboche J. Involvement of the extracellular signal-regulated kinase cascade for cocaine-rewarding properties. J Neurosci. 2000;20:8701–8709. doi: 10.1523/JNEUROSCI.20-23-08701.2000. [DOI] [PMC free article] [PubMed] [Google Scholar]
- Valjent E, Pages C, Herve D, Girault JA, Caboche J. Addictive and non-addictive drugs induce distinct and specific patterns of ERK activation in mouse brain. Eur J Neurosci. 2004;19:1826–1836. doi: 10.1111/j.1460-9568.2004.03278.x. [DOI] [PubMed] [Google Scholar]
- Valjent E, Pages C, Rogard M, Besson MJ, Maldonado R, Caboche J. Delta 9-tetrahydrocannabinol-induced MAPK/ERK and Elk-1 activation in vivo depends on dopaminergic transmission. Eur J Neurosci. 2001;14:342–352. doi: 10.1046/j.0953-816x.2001.01652.x. [DOI] [PubMed] [Google Scholar]
- Ward Y, Yap SF, Ravichandran V, Matsumura F, Ito M, Spinelli B, Kelly K. The GTP binding proteins Gem and Rad are negative regulators of the Rho-Rho kinase pathway. J Cell Biol. 2002;157:291–302. doi: 10.1083/jcb.200111026. [DOI] [PMC free article] [PubMed] [Google Scholar]
- Wennerberg K, Forget MA, Ellerbroek SM, Arthur WT, Burridge K, Settleman J, Der CJ, Hansen SH. Rnd proteins function as RhoA antagonists by activating p190 RhoGAP. Curr Biol. 2003;13:1106–1115. doi: 10.1016/s0960-9822(03)00418-4. [DOI] [PMC free article] [PubMed] [Google Scholar]
- Zhang L, Lou D, Jiao H, Zhang D, Wang X, Xia Y, Zhang J, Xu M. Cocaine-induced intracellular signaling and gene expression are oppositely regulated by the dopamine D1 and D3 receptors. J Neurosci. 2004;24:3344–3354. doi: 10.1523/JNEUROSCI.0060-04.2004. [DOI] [PMC free article] [PubMed] [Google Scholar]