

Abstract
The purpose of this study was to identify patterns of resource allocation that related to resident outcomes in nursing homes. Data on structure, staffing levels, salaries, cost, casemix, and resident outcomes were obtained from state-level, administrative databases on 494 nursing homes. We identified two sets of comparison groups and showed that the group of homes with the greatest percentage of improvement in resident outcomes had higher levels of RN staffing and higher costs. However, comparison groups based on best/worst average outcomes did not differ in resource allocation patterns. Additional analysis demonstrated that when controlling for RN staffing, resident outcomes in high and low cost homes did not differ. The results suggest that, although RN staffing is more expensive, it is key to improving resident outcomes.
Keywords: Resident outcomes, Nursing homes, Staffing, Costs
Resource Allocation and Resident Outcomes in Nursing Homes: Comparisons between the Best and Worst
There are 23,000 U.S. nursing homes with 1.5 million residents and estimates are that one-half of them provide substandard care (Maraldo, 1991). These conditions exist after more than a decade of efforts to change regulations and provide reimbursement incentives intended to improve quality of care (Cohen & Dubay, 1990). Financial incentives and regulation, however, have done little to improve quality of care. Weissert and Musliner (1992) show, in a review of research on case mix reimbursement systems in six states, that financial incentives have improved access for heavy-care residents, but costs increased with no measurable change in quality. Heavy care residents require more resources and, with reimbursement incentives, nursing homes are willing to care for them. Such increased access with no changes in quality could be interpreted as successful until evidence about the general quality of care in nursing homes is revealed.
Regulations also have failed to make appreciable improvements in quality. Lieberman (1995) examined 4 years of Health Care Financing Administration (HCFA) reports finding that “about 40 percent of all facilities certified by the HCFA have repeatedly violated Federal standards over the last four inspection surveys, including standards covering critical aspects of patient care” (p. 518). Lieberman (1995) also investigated quality in nursing homes undercover as a daughter seeking care for her mother. After visiting 53 U.S. nursing homes, Lieberman identified only seven that she would consider for her own mother, concluding that “quality of care at thousands of the nation’s nursing homes is poor or questionable at best” (p.518). In 1991, Ward reported that 36% of the nursing homes in Texas had been cited for repeated noncompliance with regulatory standards. In 1996, Pear reported that more than two-thirds of nursing homes nationally were not fully complying with Federal standards, based on an analysis of data from the Department of Health and Human Services.
In light of these findings, the question arises about how funds are being allocated to care and how allocation patterns influence outcomes. In this study, we used data from Texas nursing homes to identify how resource allocation patterns differ between homes with the best and worst resident outcomes. The research questions were, while controlling for case mix: (a) What are the differences in structure between nursing homes with the best and the worst average resident outcomes?; (b) What are the differences in human resource allocation patterns between nursing homes with the best and the worst average resident outcomes?; (c) What are the differences in financial resource allocation patterns between nursing homes with the best and the worst average resident outcomes?; (d) What are the differences in structure between nursing homes with the greatest and the least improvement in resident outcomes over a 6-month period?; (e) What are the differences in human resource allocation patterns between nursing homes with the greatest and least improvement in resident outcomes over a 6-month period?; and (f) What are the differences in financial resource allocation patterns between nursing homes with the greatest and least improvement in resident outcomes over a 6-month period?
Much of the research on care quality or outcomes in nursing homes (Aaronson, Zinn, & Rosko, 1994; Braun, 1991; Munroe, 1990; Spector & Takada, 1991) has relied on conceptualization of structure, process, and outcome. In approach, structure encompasses the characteristics of the setting in which care occurs. In this study, structure variables included nursing home size, ownership status, occupancy rates, and payer mix. Process encompasses the activities used by providers in delivering care (Donabedian, 1988). In this study, process included resource allocation behaviors as indicated by the distribution of staff time, staff mix, and money for resident care. Outcomes are the effects of care on health status (Donabedian, 1988). In this study, outcomes included the percent of residents displaying aggression, in restraints, and with contracture, decubitus ulcer, dehydration, urinary tract infection, or fracture within the past 3 months. Donabedian (1988) suggests that good structure sets the conditions for good process, which sets the conditions for good outcomes. Donabedian (1988) asserts that by studying these three components, we can gain information from which to infer that conditions were either favorable or unfavorable to patient outcomes.
Configurational theory, used in many areas of organizational research (Meyer, Tsui, & Hinings, 1993) was adopted in this study to guide detection of patterns in structure, resource allocation, and outcomes. Configurations are “tight constellations of mutually supportive elements” (Miller, 1986, p. 236). The configurational approach guided classification of nursing homes into groups by synthesizing 11 interdependent resident outcome indicators. Configurational theory also guided the synthesis of interdependent staffing indicators and salary variables.
Past research on resident outcomes in nursing homes is summarized in Table 1. Studies included in this review are those in which investigators controlled for casemix and used appropriate sample, methods, and interpretations. We grouped the indicators of resident outcomes into four categories: (a) general indicators, (b) quality of life, (c) physical health, and (d) indirect indicators (Table 1). General indicators of resident outcomes, including death rates, rehospitalization, and discharge, conform to research methods used in quality studies about hospital care (Health Care Financing Administration, 1987). However, they may not be as useful in nursing home research. Death, for example, is often an expected outcome for nursing home residents. The problem in using death as a quality indicator is that the nature of the death is not always apparent in records. In addition, it is not always known whether the death was for reasons of poor care or because of clinical conditions that were not amenable to treatment. Rehospitalization may be a useful quality indicator, but only when it is known whether or not it was preventable. Discharge rates are a dubious indicator because there are “good” reasons for discharge, e.g., return to home, and “bad” reasons for discharge, e.g., transfer to another nursing home for financial reasons. Thus, such indicators may produce ambiguous results. Indirect indicators of nursing home quality included the number of deficiencies at annual survey as reported by the HCFA and availability of direct resident care resources. These measures are not resident outcomes and again are ambiguous when used to evaluate resident outcomes.
Table 1.
Summary of Previous Research
Indicates no statistically significant relationship
Indicates positive relationship
Indicates negative relationship
Quality of life indicators included functional ability, aggressive or disruptive behavior, and physical restraint use. Perhaps the strongest indictor of the quality of life is the use of restraints. Restraint means restriction in movement, discomfort, and loss of liberty. Health status was not measured directly in this body of research. Instead, researchers targeted resident conditions that suggest quality problems in nursing care, such as the percentage of residents with decubitus ulcers and indwelling catheters, and poor care, which was an additive measure of the percent with decubitus ulcers, catheters, urinary tract infection, and rate of antibiotic use. Quality of life and physical health indicators relate directly to residents’ conditions and are better indicators of resident outcomes. Thus, in this study, we used quality of life and physical health indicators.
In viewing Table 1, it is striking that, of 75 relationships studied (excluding Rudman, Slater, Richardson, & Mattson, 1993), only 31 (41%) were statistically significant. Only 36% of relationships studied for quality of life and physical health outcomes were significant. Thus, overall, the findings suggest only a weak relationship between structure, process, and resident outcomes. For quality of life and physical health outcomes, research in Table 1 is summarized as follows. Larger size homes and for-profit status related to worse outcomes. Larger proportions of private pay residents and higher private-pay charges were associated with better outcomes. A skill mix with greater proportions of RNs, greater total-staff hours per resident day (HPRD), and greater LVN HPRD were associated with better outcomes. RN HPRD and aide HPRD had inconsistent relationships with outcomes across studies. Higher operating costs were associated with better outcomes and higher nursing salaries were associated with worse outcomes.
Why is it that in research that was carefully executed we find that almost 59% of hypothesized relationships are non-significant? A possible explanation is that, except for Rudman et al. (1993), the investigators used methods that relied solely on analysis of central tendencies. Indices of central tendency describe the “average” nursing home in the sample (Hays, 1988). Such indices identify one value by which the sample can be described with the most accuracy. Several issues suggest that central tendency theory is not the only, or the best, method for doing meaningful research. First, central tendency theory maximizes explanation of average performance (Daft & Lewin, 1990). “The average organization does not exist and by definition it never is on the frontier of the phenomenon under study” (Daft & Lewin, 1990, p. 6). Thus, understanding average performance may not be useful for offering prescriptions for improving practice. Second, nursing homes are relatively homogeneous as to the types of residents served, regulations, types of employees, and reimbursements. Institutional theory suggests that organizations within an industry are affected by similar environmental demands and conform to what is understood as appropriate behavior (Zucker, 1987). Thus, to maintain legitimacy, organizations in an industry begin to look alike. For this reason, nursing systems researchers face the problem of detecting differences between nursing homes that tend to have uniform characteristics and it is likely that analysis of central tendencies will not detect differences.
Third, the goal of health care research is to gain insights into feasible ways to produce excellent outcomes for patients. “The use of outlier research - studying the best and worst cases - is a way to break out of the normal-science straitjacket” (Daft & Lewin, 1990, p. 1) and make prescriptive recommendations for practice (Bettis, 1991). Therefore, in this study, we analyzed groups of nursing homes based on their extreme positions in the sample in the belief that examining the best and the worst performing nursing homes would produce useful insights.
Method
Data
In this study, secondary data were obtained from the Texas Department of Human Services (TDHS) for all nursing homes in the state. Data on staffing levels and financial resource allocations were obtained from the Medicaid Nursing Facility 1990 Cost Reports and data on casemix and resident outcomes were obtained from the 1990 Client Assessment, Review, and Evaluation Form 3652-A (Texas Department of Human Services, 1990). Because data were reported uniformly, they provided feasible methods for comparisons across large numbers of nursing homes. TDHS uses reliability and validity checks in collecting these data. Specifically, the quality of the data is monitored through clerical and computer checks for errors and consistency and facilities are subject to revision of the report until it passes quality review. Nurses complete Form 3652-A regularly for each Medicaid resident. Nurses from TDHS tested the interrater reliability and validity of these data every 9 months. The average interrater reliabilities of the items used in this study were over 94% (Wilson et al., 1990). After matching data from the Medicaid Cost Reports with data from Form 3652-A, the data set contained 494 cases with complete data on all study variables.
Procedure
Pattern-Scores
Configurational theory suggests that single-variable measures rarely capture the complexity that exists in managing organizations (Meyer et al., 1993) such as nursing homes. No single resident outcome sufficiently accounts for the overall quality of care in nursing homes and no single indicator can account for the variety of ways that managers allocate resources. In this study, therefore, 11 items from Form 3652-A were selected because they reflected care outcomes (Zimmerman et al., 1995). Groups of measures (11 in this case) improve statistical validity of measurement over individual measures (Tarr, 1995). To create a summary variable of resident outcomes in each nursing home, “the percentile rank of the nursing home in relation to its peers” (Zimmerman et al., 1995, p. 112), was adopted to develop a score that indicated a nursing home's position within the sample. This strategy enabled consideration of multiple performance indicators in identifying a nursing home’s position on a particular dimension of performance. We refer to these scores as “pattern scores.”
Each pattern score was calculated using two or more indicators of the phenomena. To obtain a pattern score, we first rank-ordered the nursing homes on each relevant indicator. Thus for each indicator, a home had a score anywhere from 1 to 494, depending on its position in the sample. The ranks for each of the 11 variables were then averaged. The population of 494 homes yielded a mean rank of 243.5 (SD = 55.66) with a range from 90 to 438.36. However, knowing the mean ranking does not convey information unless the sample size is known. To readily enable comparisons with other samples and ease of interpretation, we converted the pattern scores to z-scores. The z-scores have a mean of zero and standard deviation of one, which makes interpretation of scores possible without referring to sample size. Individual pattern-scores, defined below, included measures of resident outcomes, RN staffing, LVN staffing, nurse aide staffing, and nursing staff salaries.
Resident outcome indicators
Resident outcomes were defined as the results of nursing care as experienced by the residents within each home. Eleven items from Form 3652-A were selected because they reflected the quality of nursing care. A nursing home level score for each item was calculated to indicate the percentage of residents in the home for whom the condition was present. The items were verbal aggression, physical aggression, other disruptive behavior, geriatric-chair restraints, wrist-mitten restraints, vest-belt restraints, contracture, decubitus ulcer, dehydration, urinary tract infection, and fracture within the past 3 months. In nursing homes with high-quality care, the prevalence of these conditions should be lower. Definitions of the outcome variables appear in Table 2.
Table 2.
Definitions, Population Means (Unadjusted) and Standard Deviations of Resident Outcome Indicators (N=494)
| Variable Name | Definition | Average Outcome |
Percent-Improvement In Outcomes |
||
|---|---|---|---|---|---|
| Resident Outcome Indicators | M | SD | M | SD | |
| Verbal Aggression | % of residents displaying verbal aggression within last 4 wks. | 20.93 | 11.61 | .56 | 7.72 |
| Physical Aggression | % of residents displaying physical aggression within last 4 wks. | 13.42 | 8.64 | .13 | 6.35 |
| Other Disruptive Behavior | % of residents displaying other disruptive behavior in last 4 wks. | 16.97 | 11.72 | -.45 | 8.72 |
| Geriatric Chair | % of residents in geriatric chair restraint within last 4 wks. | 12.55 | 11.29 | 2.23 | 6.58 |
| Vest-Belt | % of residents in vest-belt restraint within last 4 wks. | 30.18 | 12.28 | 3.52 | 7.84 |
| Wrist-Mitten | % of residents in wrist/mitten restrains within last 4 wks. | 2.16 | 2.87 | .24 | 3.52 |
| Decubitus | % of residents with Stage I or higher decubitus ulcer (last 4 wks). | 6.55 | 4.46 | -.29 | 5.29 |
| Contractures | % of residents with contracture in one or more extremities. | 16.30 | 8.25 | -.33 | 6.07 |
| Dehydration | % of residents exhibiting dehydration during last 4 weeks. | .93 | 2.46 | .27 | 3.84 |
| Urinary Tract Infection | % of residents exhibiting urinary tract infection in past 4 wks. | 5.46 | 5.23 | .20 | 5.39 |
| Fracture In Past 3 Mo. | % of residents for whom fracture(s) occurred within past 3 mos. | 2.62 | 2.60 | -.12 | 3.52 |
Adjusting for Case Mix
Casemix is the aggregate patient profile including functional and health status (Zimmerman et al., 1995). Individual residents have certain characteristics, such as functional ability and clinical conditions that predispose them to adverse outcomes despite the type of clinical intervention applied. Comparing resident outcomes, without controlling for these risk factors, is like comparing apples to oranges. Comparison of outcomes between residents or groups of residents is valid only when variation due to resident characteristics is controlled, which serves to level the playing field (Berlowitz et al., 1996; Zimmerman et al., 1995). Thus, adjusting for casemix makes it possible to compare one nursing home to another (Berlowitz et al., 1996; Zimmerman et al., 1995) and to compare one nursing home to itself across two time periods even though different residents may be in the home during different time periods (Stineman, 1997).
To ensure that resident outcomes were comparable across nursing homes and times, the effect of resident casemix on the outcome indicators was removed using a strategy similar to that of Zinn, Aaronson, and Rosko (1993). Items included for establishing fair comparisons among nursing homes should be a set of risk factors that are not easily amenable to clinical interventions (Zimmerman et al., 1995). Thirteen items selected from Form 3652-A were deemed suitable for use as casemix indicators using Zimmerman et al.’s criteria. A measure of each casemix item was calculated at the nursing home level as the percentage of residents with the problem or condition. Using multiple regression, the expected value (due to casemix) of each of the 11 outcomes indicators was predicted by regressing them on the case mix indicators which included: mobility/ambulation problems; dressing/grooming problems; transferring problems; eating problems; toileting problems; bowel control problems; bladder control problems; changes in level of consciousness; dyspnea; edema; stasis ulcer; internal bleeding; and terminal illness. The result was the value of the resident outcome expected due to functional and health status (casemix). For each of the 11 outcomes, the casemix indicators explained a portion of variance.
The unexplained variance (residual) was the difference between the actual outcome and the outcome due to functional and health risks. According to Zinn et al. (1993), by using this strategy the maximum effect of casemix is accounted for, minimizing the potential for resource allocation patterns to be associated with the resident outcomes. Thus, the results are conservative and more confidence can be placed in them. The residual, referred to as casemix-adjusted outcomes, were used to sort the nursing homes into comparison groups.
Pattern-Scores for Casemix-Adjusted Resident Outcomes
Average resident outcomes
Form 3652-A provided resident data from two points in time, a spring resident assessment and a fall resident assessment. For each of the 11 casemix-adjusted outcome indicators, a measure of resident outcomes was calculated by averaging the scores for the spring and fall assessments. Using the procedures for computing a pattern score described above, combining the 11 indicators showed each nursing home’s position on average outcomes, relative to the other homes in the sample. A lower score means that, across the 11 indicators, a home had better average outcomes (i.e., a lower percentage of residents with the conditions).
Percent improvement in resident outcomes
Again, resident assessments from two points in time were used. The percent of improvement in resident outcomes was calculated for each of the 11 casemix-adjusted indicators using the formula: (time-one measure of indicator1-11 minus time-two measure of indicator1-11) divided by the time-one measure of indicator1-11. Again using the procedures for computing a pattern score, combining the 11 indicators showed each nursing home’s percent-improvement relative to the other homes in the sample. A lower score for overall improvement in quality means that a home had less improvement in resident outcomes.
Creating Comparison Groups
Two sets of comparison groups were analyzed. First, the homes were compared in terms of average resident outcomes. Based on their pattern-score for average resident outcomes, the homes were divided into five approximately equal groups. Group 1 was homes in the 80th percentile or higher, having the best average resident outcomes. Group 5 was homes in the 20th percentile or lower, having the worst average resident outcomes. Figure 1 (top) shows the residual scores (after casemix variance is removed) for the 11 indicators of average resident outcomes for each group. The homes in the best group on average were below the mean indicating below average prevalence of each condition, while the homes in the worst group on average were above the mean indicating above average prevalence of each condition.
Figure 1.
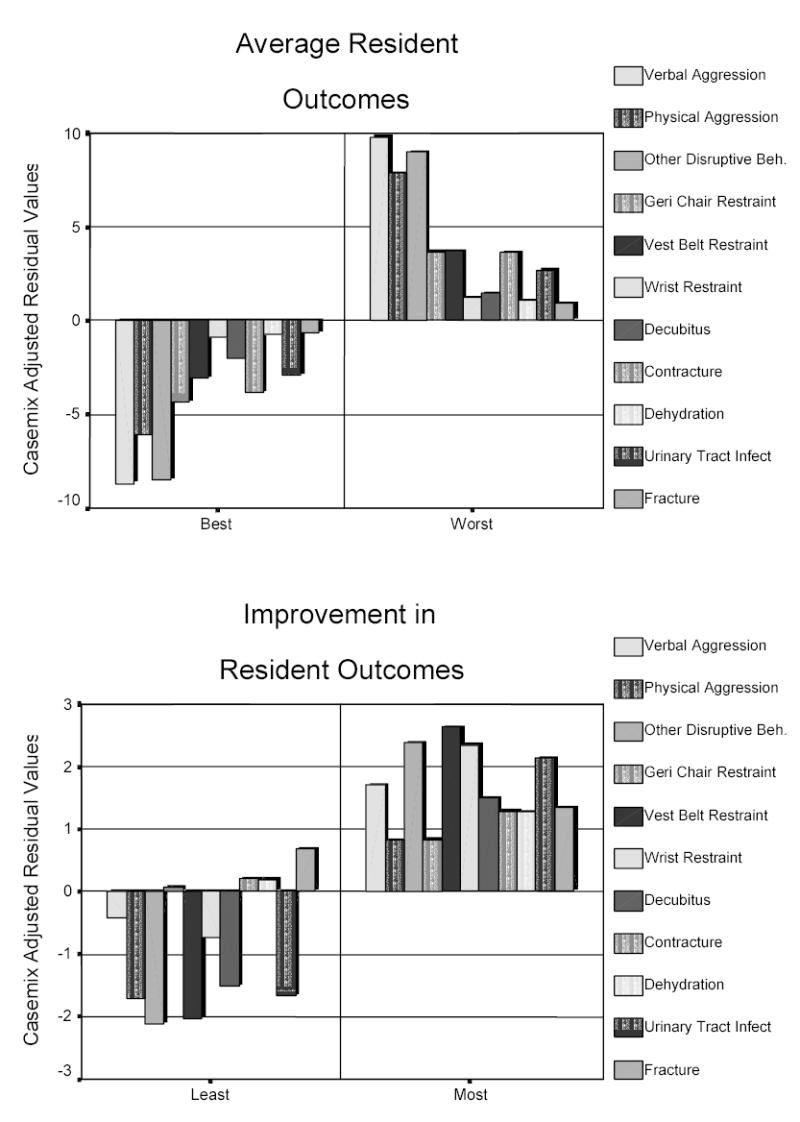
Comparison of residual values for best and worst groups on average resident outcomes (top) and least and most improvement groups (bottom) after adjusting for casemix.
Second, the homes were compared in terms of percent-improvement in resident outcomes. Based on the pattern-score for percent-improvement-in-resident outcomes, the homes again were divided into five groups. Group 1 was homes in the 20th percentile or lower, having the least improvement in resident outcomes. Group 5 was homes in the 80th percentile or higher, having the greatest improvement in resident outcomes. Figure 1 (bottom) shows the residual scores (after casemix variance removed) for the 11 indicators of percent-improvement in resident outcomes for each group. The homes in the group with the least improvement on average were below the mean, indicating below average improvement (or possibly worsening) in resident outcomes, whereas homes with the most improvement on average were above the mean, indicating above average improvement.
Indicators of Structure and Process
To the extent possible, selection of structure and process indicators was guided by the empirical findings summarized in Table 1. Indicators of structure and process were chosen if they had been defined in previous research and were available in the data set. Definitions of study variables and population means are shown in Table 3. A log transformation of number of licensed beds, cost per resident day, and administrative ratio, was used to remedy failure of normality (Tabachnick & Fidell, 1989). However, to assist with interpretation, raw scores are shown in Table 3. Sample means for each comparison group are shown in Table 4. A pattern-scors was calculated for RN staffing pattern from rankings on number of RNs per 60 beds, RN hours per resident day (HPRD), and number of RNs/total nursing staff. Similarly, pattern-scores were calculated for LVN and nurse aide staffing patterns. The pattern-scores for the comparison groups are shown in Table 5.
Table 3.
Definitions, Means and Standard Deviations of Context, Human and Financial Resource Allocation Variables (N=494)
| Variable Name | Variable Definition | M | SD |
|---|---|---|---|
| Owner Status | Indicates who controls the assets (0 = profit and 1= nonprofit). | .14 | .34 |
| N of Licensed Beds | Natural logarithm of total licensed beds. | 108.72 | 52.43 |
| Percent of Private Pay | N of private payer resident days ÷ total N of resident days. | .25 | .13 |
| N of RNs per 60 Beds | Availability of RNs for clinical leadership in planning and managing resident care. Calculated as RN FTEs per 60 beds (adjusted for occupancy). |
.91 | 1.12 |
| RN Hours per Resident Day | Workload and capacity to pay close attention to specific resident needs. Calculated as: RN hours worked ÷ resident days. |
.10 | .09 |
| N of RNs/Total Nursing Staff | Skill mix reflecting the amount of professional supervisory attention that is available to nursing staff. Calculated as: RN FTEs ÷ total nursing staff FTEs. |
.03 | .03 |
| N of LVNs per 60 Beds | Availability of LVN manpower in the home. Calculated as LVN FTEs per 60 beds (adjusted for occupancy). | 6.98 | 26.07 |
| LVN Hours per Resident Day | Workload and the capacity to pay close attention to specific resident needs. Calculated as: LVN hours worked ÷ resident days. |
.60 | .19 |
| N of LVNs/Total Nursing Staff | Indicator of LVN skill mix. Calculated as: LVN FTEs ÷ total nursing staff FTEs. | .25 | .07 |
| N of Aides per 60 Beds | Availability of nurse aide manpower. Calculated as Aide FTEs per 60 beds (adjusted for occupancy). | 15.73 | 5.64 |
| Aide Hours per Resident Day | Workload and capacity to pay close attention to specific resident needs. Calculated as: Aide hours worked ÷ resident days. | 1.65 | .49 |
| N of Aides/Total Nursing Staff | Indicator of Aide skill mix. Calculated as: Aide FTEs ÷ total nursing staff FTEs. | .76 | .08 |
| Administrative Costs per | Availability of administrative personnel and support functions. Calculated as: Total Administrative Costs | .12 | .04 |
| Resident Care Costs | ÷ (Sum of Resident Care and Dietary Costs). | ||
| Expense per Resident Day | Indicator of money spent to operate the nursing home. Calculated as: Total Expense ÷ Total Resident Days. |
45.36 | 12.59 |
| RN Hourly Wage | RN gross pay ÷ RN hours worked. | 14.32 | 3.00 |
| LVN Hourly Wage | LVN gross pay ÷ LVN hours worked. | 9.27 | 1.20 |
| AIDE Hourly Wage | Nurse aide gross pay ÷ Aide hours worked. | 4.34 | .46 |
Table 4.
Descriptive Statistics –Context, Human and Financial Resource Allocation Variables by Group
| Average Resident Outcomes |
Improvement in Resident Outcomes |
|||||||
|---|---|---|---|---|---|---|---|---|
| Best (N=97) |
Worst (N=96) |
Least (N=98) |
Most (N=93) |
|||||
| M | SD | M | SD | M | SD | M | SD | |
| Owner Status (1 = non-profit) | 0.16 | 0.37 | 0.13 | 0.34 | 0.12 | 0.33 | 0.11 | 0.32 |
| Number Of Licensed Beds | 107.98 | 51.48 | 96.81 | 44.47 | 110.55 | 56.85 | 103.95 | 47.19 |
| Percent Of Private Pay | 0.27 | 0.13 | 0.24 | 0.12 | 0.26 | 0.13 | 0.26 | 0.14 |
| N of RNs per 60 Beds | 0.94 | 1.33 | 0.86 | 0.82 | 0.77 | 0.77 | 0.99 | 0.92 |
| RN Hours per Resident Day | 0.10 | 0.11 | 0.10 | 0.11 | 0.08 | 0.08 | 0.11 | 0.10 |
| N of RNs/Total Nursing Staff | 0.03 | 0.02 | 0.02 | 0.03 | 0.02 | 0.02 | 0.03 | 0.03 |
| N of LVNs per 60 Beds | 6.03 | 2.73 | 6.38 | 2.87 | 6.06 | 2.45 | 5.69 | 2.49 |
| LVN Hours per Resident Day | 0.60 | 0.19 | 0.63 | 0.18 | 0.62 | 0.19 | 0.59 | 0.18 |
| N of LVNs/Total Nursing Staff | 0.25 | 0.07 | 0.26 | 0.07 | 0.26 | 0.06 | 0.24 | 0.07 |
| N of Aides per 60 Beds | 16.86 | 6.17 | 16.16 | 6.05 | 16.03 | 5.09 | 15.92 | 5.91 |
| Aide Hours per Resident Day | 1.68 | 0.40 | 1.60 | 0.47 | 1.64 | 0.42 | 1.68 | 0.43 |
| N of Aides/Total Nursing Staff | 0.76 | 0.08 | 0.77 | 0.07 | 0.77 | 0.07 | 0.76 | 0.07 |
| Admin. Costs/Res Care Costs | 0.12 | 0.05 | 0.12 | 0.04 | 0.11 | 0.04 | 0.12 | 0.04 |
| Expense per Resident Day | 45.08 | 13.73 | 43.86 | 8.88 | 42.48 | 7.48 | 45.52 | 10.08 |
| RN Hourly Wage | 13.86 | 3.30 | 14.06 | 2.91 | 14.68 | 3.91 | 14.21 | 2.33 |
| LVN Hourly Wage | 9.16 | 1.20 | 9.30 | 1.23 | 9.13 | 0.99 | 9.19 | 1.06 |
| AIDE Hourly Wage | 4.30 | 0.48 | 4.27 | 0.36 | 4.32 | 0.41 | 4.34 | 0.44 |
Table 5.
Pattern Scores by Resident Outcome Groups
| Average Resident Outcomes |
Improvement in Resident Outcomes |
|||||||
|---|---|---|---|---|---|---|---|---|
| Best (N=97) |
Worst (N=96) |
Least (N=98) |
Most (N=93) |
|||||
| M | SD | M | SD | M | SD | M | SD | |
| RN Staffing Pattern Score | -0.00 | 0.94 | -0.04 | 0.91 | -0.17 | 0.96 | 0.13 | 0.91 |
| LVN Staffing Pattern Scores | -0.02 | 0.85 | 0.12 | 0.82 | 0.12 | 0.82 | -0.10 | 0.82 |
| Aide Staffing Pattern Scores | 0.10 | 0.71 | -0.04 | 0.68 | 0.04 | 0.68 | 0.02 | 0.68 |
| Salary Pattern Scores | -0.13 | 0.83 | -0.08 | 0.81 | -0.04 | 0.76 | -0.04 | 0.79 |
Analysis
Planned comparisons were performed using multivariate analysis of variance (MANOVA). Additional analyses were accomplished with analysis of variance (ANOVA) and analysis of covariance (ANCOVA). Results of Box’s M test of equality of covariance matrices and Levene’s test of equality of error variances (Norusis, 1993) indicated that the analyses in this study met the assumptions underlying the MANOVA model. To indicate effect sizes, Wilks’ Lambda is reported for the overall model and ETA squared (η2) is reported for univariate F tests.
Results
Structure and Resident Outcomes
Group-mean scores of the structure variables, owner status, size, and private mix are displayed in Table 4. The group with the best average outcomes (least % of residents with the conditions) had more non-profit homes, were larger, and had greater percentage of private pay residents. As shown in Table 6, means did not differ significantly between the group of homes with best and worst average outcomes. The group with the greatest improvement in resident outcomes had more for-profit homes and were smaller (Table 4). Again, however, means did not differ between groups with the greatest and least improvement in outcomes (Table 6).
Table 6.
Multivariate Analysis of Variance for Comparison Groups: Best and Worst Average Resident Outcomes and Most and Least Improvement in Resident Outcomes
| Grouped by Average Resident Outcomes |
Grouped by Improvement in Resident Outcomes |
||||||
|---|---|---|---|---|---|---|---|
| Dependent Variables | df | Wilk’s Lambda | F | Eta Squared | Wilk’s Lambda | F | Eta Squared |
| Structure: | |||||||
| Full Model | 3 | .97 | .16 | .025 | .99 | .17 | .003 |
| Owner Status | 1 | .36 | .002 | .05 | .000 | ||
| N of Licensed Beds | 1 | 2.41 | .012 | .43 | .002 | ||
| Percent Private Pay | 1 | 2.51 | .013 | .00 | .000 | ||
| Human Resource Allocation: | |||||||
| Full Model | 2 | .99 | .74 | .008 | .96* | 3.67 | .037 |
| RN Pattern Score | 1 | .08 | .000 | 5.08* | .026 | ||
| LVN Pattern Score | 1 | 1.45 | .007 | 3.29 | .017 | ||
| Financial Resource Allocation: | |||||||
| Full Model | 3 | .98 | .72 | .011 | .96* | 2.64 | .040 |
| Admin/Care Costs | 1 | 1.35 | .007 | 1.33 | .007 | ||
| Expense /Day | 1 | .12 | .001 | 5.56* | .028 | ||
| Sal. Pattern Score | 1 | .24 | .001 | .01 | .000 | ||
p < .05.
Process and Resident Outcomes
Comparisons - Groups with Best and Worst Average-Outcomes
Human resource allocation
Raw means (Table 4) show that the group with the best average outcomes had more RN FTEs per 60 beds and a greater percentage of RNs in the staff mix. In addition, the group with the best average outcomes had fewer LVN FTEs per 60 beds, fewer LVN HPRD, and a lower percentage of LVNs in the staff mix. The group with the best average outcomes had more nurse aide FTEs per 60 beds and more nurse aide HPRD, but a lower percentage of nurse aides in the staff mix. MANOVA was used to examine comparison groups for differences in staffing patterns for RNs, LVNs, and nurse aides. All comparisons of mean scores between the groups of homes with the best and worst average outcomes were statistically non-significant (Table 6).
Financial resource allocation
Mean scores (Table 4) show that the group with the best average outcomes had greater expenses per resident day. Raw mean scores (Table 4) show that the group with the best average outcomes had lower RN and LVN salaries, but higher nurse aide salaries than homes with the worst outcomes. MANOVA was used to examine comparison groups for differences in financial resource allocation. Again, all comparisons of mean scores between the groups of homes with the best and worst average outcomes were statistically non-significant (Table 6).
Comparisons - Groups with Greatest and Least Percent-Improvement in Outcomes
Human resource allocation
Raw means (Table 4) show that the group with the greatest improvement in resident outcomes had more RN FTEs per 60 beds, more RN HPRD, and a greater percentage of RNs in the staff mix. In addition, the group with the greatest improvement in outcomes had fewer LVN FTEs per 60 beds, fewer LVN HPRD, and a lower percentage of LVNs in the staff mix. The group with the greatest improvement in outcomes had fewer nurse aide FTEs per 60 beds, a lower percentage of nurse aides in the staff mix, but more nurse aide HPRD. When testing for differences in means, the MANOVA model, including all three human resource pattern-score variables (RNs, LVNs, and nurse aides), was not statistically significant. Univariate F tests showed that RN pattern-scores differed significantly F(1, 192) = 5.08, p = .03, η2 = .026, whereas LVN pattern-scores and nurse aide pattern-scores y did not differ.
Eliminating the nurse aide pattern-score because of the small F value, we repeated the MANOVA model including only the RN and LVN pattern-score variables. The reduced model (Table 6) was statistically significant, Wilks’ Lambda(2, 191) = .963, p = .03. Nursing homes with the greatest improvements in resident outcomes allocated more RN staff than homes with the least improvements in outcomes, F(1, 192) = 5.08, p = .03, η2 = .026. The homes did not differ significantly in the levels at which they allocated LVN staff.
Financial resource allocation
Mean scores (Table 4) show that the group with the greatest improvement in resident outcomes had proportionally greater administrative costs and higher expenses per resident day. They also had slightly lower RN salaries but slightly higher LVN and nurse aide salaries (raw means, Table 4). When testing for differences in means of financial variables, cost-per-resident-day, administrative costs, and the salary pattern-score, the multivariate model (Table 6) was statistically significant, Wilks’ Lambda (3, 190) = .960, p = .0001. Nursing homes with the greatest improvements in resident outcomes spent more per resident-day than the homes with the least improvements in outcomes, F(1, 192) = 5.56, p = .01, η2 = .028. The homes did not differ significantly in the proportions spent on administration or salaries.
Additional Analysis
Additional analysis was done to check the veracity of the relationships found in the study. Thus far, we found that the group of nursing homes with the greatest improvement in resident outcomes provided more RN staffing and spent more per day than the group with the least improvement. Two concerns arise when interpreting these findings. First, RN staffing is correlated with expenses (r = .37, p < .001). Second, we do not know if resident outcomes differ when the sample is grouped differently, that is, when homes are configured into groups according to patterns of high/low levels of RN staffing or expense. We know, from this study, that groups based on percent of improvement in outcomes differed in RN staffing and cost. It would be useful to be able to say also that homes with high/low levels of RN staffing or expense have different resident outcomes. In manager’s language, we want to be able to say, “anyway you slice it,” improvement in resident outcomes is associated with higher levels of RN staffing. Answering the following additional questions addresses these issues and facilitates interpretation of results: (a) Does the group providing the highest levels of RN staffing differ in percent of improvement in outcomes from the group providing the lowest levels of RN staffing?; (b) Does the group spending the most differ in percent-improvement in outcomes from the group spending the least?; and (c) Controlling for levels of RN staffing, does the group spending the most differ in percent-improvement in outcomes from the group spending the least?
To answer these questions, two additional comparison groups were tested. Dividing the sample into five groups on the RN pattern-scores created one comparison group. Dividing the sample into five groups on expenses-per-resident-day created the second comparison group. As in the previous analyses, we compared the highest and lowest 20%.
Additional comparisons - Groups with highest and lowest RN staffing levels
The residual scores (after casemix variance removed) for the 11 indicators of percent-improvement in resident outcomes for each group are shown in Figure 2. The top of Figure 2 shows that homes in the group with the highest levels of RN staffing show a pattern of means that is generally higher, indicating greater percent-improvement, than the group with the lowest levels of RN staffing. The exceptions include verbal aggression, vest and wrist restraints, contractures, and dehydration. Results of the ANOVA model (Table 7) showed that percent-improvement in resident outcomes was significantly greater in homes with the highest levels of RN staffing, F(1, 191) = 7.06, p = .009, η2 = .036.
Figure 2.
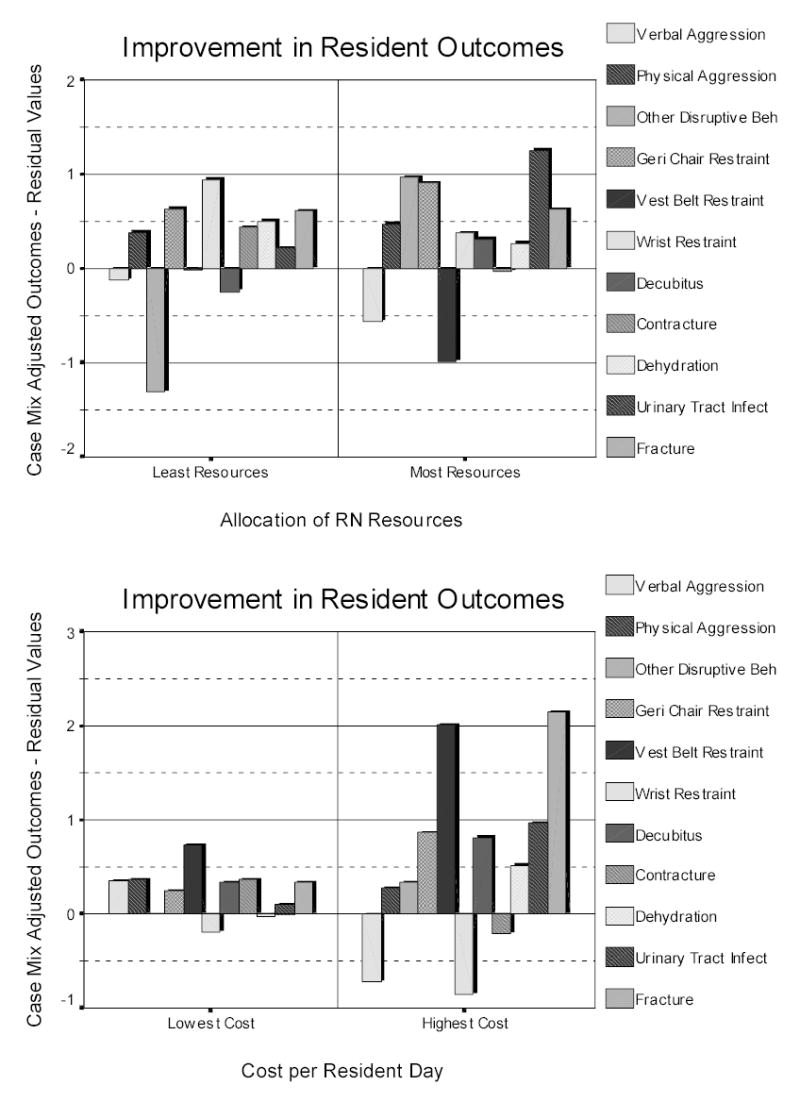
Comparison of residual values for improvement in outcomes between least and most groups on RN resource allocation (top) and lowest and highest groups on cost per resident day (bottom).
Table 7.
Descriptive Statistics and ANOVA Results - High/Low RN Staffing and High/Low Expense
| Grouped by RN Staffing Levels |
Grouped by Expense Per Day |
|||||||
|---|---|---|---|---|---|---|---|---|
| Variable Name | Lowest RN Staffing (N=97) |
Highest RN Staffing (N-96) |
Lowest Expense (N=98) |
Highest Expense (N-93) |
||||
| M | SD | M | SD | M | SD | M | SD | |
| Pattern Score -- | ||||||||
| Improvement in | -0.07 | 0.32 | 0.06 | 0.34 | -0.08 | 0.32 | 0.05 | 0.33 |
| Resident outcomes | ||||||||
| ANOVA Results | F = 7.064** η2 = .036 | F = 7.373** η2 = .038 | ||||||
p < .01
Additional comparisons - Groups with highest and lowest expenses per day
The bottom of Figure 2 shows that homes in the group with the highest expenses shows a pattern of higher means, indicating greater percent-improvement, than the group with the lowest expenses per day. The exceptions include verbal and physical aggression, wrist restraints, and contractures. Results of the ANOVA model (Table 7) show that percent-improvement in outcomes was significantly greater in the homes that spent the most than in the homes that spent the least, F(1, 189) = 7.38, p = .007, η2 = .038.
In the final analysis, an ANCOVA model was used to test for differences in percent-improvement in resident outcomes between groups with high versus low spending, while controlling for RN staffing patterns. The ANCOVA model was statistically significant, F(1, 189) = 9.864, p < .0001, η2 = .095, with the covariate, RN staffing pattern-score, explaining significant variance in percent-improvement, F(1, 188) = 11.928, p < .001, η2 = .06). However, resident outcomes did not differ between the group of homes spending the most and the group spending the least, F(1, 188) = .449, p = .50, η2 = .002).
Discussion
Our purpose was to identify patterns of resource allocation that relate to high-quality resident outcomes. To clearly distinguish the best and worst performers we applied strict controls for case mix and then identified as the best the group of nursing homes that were in the 80th percentile or higher in resident outcome scores. We identified as the worst the group of homes that were in the 20th percentile or lower. Two sets of comparison groups were formed: one based on average resident outcomes and one based on percent-improvement in resident outcomes.
The results suggest two main conclusions: (a) achieving improvements in resident outcomes requires RN staffing and (b) because of the need for RN staffing, achieving improvements in resident outcomes requires greater spending. Interestingly, we did not find differences in resource allocation between the group with the best average outcomes and the group with the worst average outcomes. In addition, the structural variables of ownership, size, and percent of private pay residents did not differ between any of the comparison groups.
The findings indicate that commonly studied structural variables of ownership, size, and proportion of private pay residents do not vary with differences in resident outcomes. Size did not relate to resident outcomes, a finding consistent with Cherry (1991) and Spector and Takada (1991). In contrast, Zinn et al. (1993) found that smaller homes provided better quality of care, but attributed it to the ability of smaller homes to provide closer supervision of care. Regarding ownership, our findings corroborate those of Cherry (1991) and Zinn et al. (1993). Aaronson et al. (1994) found, however, that non-profit homes provided better quality of care, which they attributed to the pattern of decisions non-profits make that generally include higher staffing levels, leading to more care supervision and better care processes. Our finding that resident outcomes are not associated with percent of private pay residents is consistent with both Cherry (1991) and Zinn et al.'s (1993) studies. Spector and Takada (1991), however, found a relationship between private pay and better outcomes, which they attribute to the decisions that nursing homes make to compete successfully for the private pay market. These decisions, in part, are toward better staffing. Thus, our findings, in concert with previous research, suggest that structural variables do not consistently relate directly to better quality of care. However, they appear to set the stage for conditions that do relate to better quality, namely, the levels and types of nursing staff.
Groups based on percent-improvement in outcomes differed significantly in their resource allocation patterns, suggesting that improvements in resident outcomes require investment in RN staffing and greater expenditures per resident day. Because RN staffing is costly, we wanted to maximize our confidence in the results before recommending that nursing home administrators allocate scarce resources to increase RN staffing levels. Thus, to validate the findings we split the sample into groups based on levels of RN staffing and expense per resident day. The results of this additional analysis showed that the group of homes with the highest levels of RN staffing had the greatest improvements in resident outcomes. The group of homes with the greatest expenses per resident day also had the greatest improvements in resident outcomes. The additional analysis increased our confidence in concluding that investment in RN staffing and expenses per resident day do explain improvements in resident outcomes.
Concern for our ability to interpret the findings remained, however. This was that higher RN staffing levels were strongly associated with greater expense. Thus, to determine whether additional expenses per day, beyond expenses for RN staffing, explained improvements in resident outcomes, we did one final analysis. An ANCOVA technique was used to increase the power of the analysis and provide a more accurate estimate of the real difference among groups. We found that when the variance due to level of RN staffing is controlled, the high expense group and the low expense group no longer differed in percent-improvement in resident outcomes. The control variable, RN staffing, however, explained 6% of the variance in percent improvement in resident outcomes. These findings strongly suggest that RN staffing is a major factor contributing to improvement of resident outcomes. The findings also suggest that the additional expenses incurred, beyond that spent on RN staffing, may not lead to improvements in resident outcomes.
Best and worst groups, based on average resident outcomes, did not differ in the allocation of human and financial resources, a finding that is consistent with those of Zinn et al. (1993). Viewing Table 1, it is of note that in previous research 6 out of 11 (55%) relationships were reported as significant when relating resource allocation variables to outcome indicators based the average, static levels of the variables (Cherry, 1991; Kolanowski, Hurwitz, Talyor, Evans, & Strumpf, 1994; Phillips, Hawes, & Fries, 1993; Rohrer, Momany, & Chang, 1993; Rudman et al., 1993). Of these, three of the findings were in the wrong direction (Cherry, 1991; Phillips et al., 1993; Rohrer et al., 1993); that is, greater resource allocation related to worst outcomes, indicating substantial inconsistency in findings. When relating improvement in resident outcomes, specifically functional improvement, to resource allocation variables (Table 1), 7 out of 12 (58%) effects were statistically significant (Linn, Gurel, & Linn, 1977; Rohrer et al., 1993; Rudman et al., 1993; Spector & Takada, 1991). In addition, only one of the findings was in the wrong direction (Rohrer et al., 1993). Previous research, in concert with our findings, provides strong evidence that improvements in resident outcomes, rather than average outcomes, are sensitive to managerial processes. Managerial processes, such as resource allocation, are dynamic and intended to affect change in some aspect of the organization. Thus, it follows that resource allocation processes will explain variance in improvement in outcomes and yet, not explain variance in some static level of the same outcomes.
The results of this study can be used to develop implications for practice. Here, we move beyond specific results and speculate as to their meaning for practice and education. Nursing homes have a strong incentive to use LVNs because their licensure allows them to do most treatments and medications tasks required by residents, and yet LVNs are substantially cheaper to hire than RNs. Improving resident outcomes, however, most likely requires several problem-solving and cognitive activities that LVNs may not possess. The difference in knowledge available to the home could explain why homes with more RNs also had greater improvements in resident outcomes. Similar arguments were discussed by Munroe (1990) and Johnson-Pawlson and Infeld (1996).
To make improvements requires several sophisticated cognitive activities. Improvements require accurate diagnoses based on assessment of residents’ conditions. They require effective interventions that are innovative. Most likely, interventions for improving resident outcomes need to be applicable across large groups of residents, suggesting that the nurse recognize systematic patterns. Finally, improvements require successful implementation of interventions, suggesting a need for knowledge of management theory and evaluation. These activities are “knowledge” activities. RN have a higher education level, strong socialization, and the values and expertise, which provide them with knowledge (Sullivan-Marx, 1996), not possessed by others in nursing homes, and facilitate their ability to realize improvements in resident outcomes. Thus, when nursing homes invest in higher levels of RN staffing, they are securing knowledge for the organization to make improvements in resident care.
An alternative explanation for the significance of RN staffing in achieving improvements in outcomes may be that the RN serves as a leader and role model in supervising LVNs and CNAs. Regulations (Department of Health and Human Services, 1989) stipulate that LVNs and CNAs provide nursing care under the supervision of a RN. When RNs are present in greater numbers, they can spend more time on supervisory tasks. When able to rely on professional nurses “to provide hands-on training and guidance” ((Institute of Medicine, 1996, p. 7), CNAs experience less uncertainty about their work and work roles. As leaders, RNs are responsible for creating the climate for professional nursing care and representing nursing values in collaborative activities at all levels (Anderson, Issel, & McDaniel, in press). When more RNs are present in the home, LVNs and CNAs may be more effective in their work leading to the improvement of resident outcomes.
The findings also suggest that, because the presence of RNs makes a difference, development of these RNs should make them even more valuable. Continuing education to improve RNs' problem-solving, cognitive skills, leadership, and supervisory skill, with particular emphasis on quality improvement techniques, is a logical investment for enhancing the RNs' value to the organization.
Curricula in schools of nursing must recognize the critical role of RNs in nursing homes. It might be beneficial to structure clinical experiences to facilitate students in learning how to gather and analyze group level clinical data and to plan group level interventions. In addition, students need to know how to turn this information into protocols for care that others can follow. In nursing homes, because RNs are so few in number, the need for group level assessment skills may exceed the need for individual level assessment skills, yet nursing programs emphasize individual level encounters with clients.
We acknowledge some limitations in this study. We did not include psychosocial indicators of resident outcomes and, thus, did not fully capture the quality of care in these nursing homes. Data were from one state, limiting generalizability. Comparative studies of other states will add to knowledge about how resource allocation influences resident outcomes. A limitation of using secondary data is that there is a substantial lag time between actual collection of the data and when data become available for secondary use. In addition, large databases such as the one used in this study require substantial processing before they can be used to answer research questions. Our data were collected at the end of fiscal year 1990 and our time frame for processing these data was similar to that of other published research that used secondary data (c.f. Coburn, Fortinsky, McGuire, & McDonald, 1993; Zinn et al., 1993).
Despite these limitations, several aspects of the study design strengthen our confidence in the findings. First, we carefully controlled for the influence of casemix on outcomes, which strengthened our confidence that the effects found were valid. We recommend strategies for controlling casemix, such as those suggested by Zinn et al. (1993), be used in future outcomes research. Second, applying the configurational approach, pattern scores were developed that synthesized multiple indicators of resident outcomes to be analyzed as whole. In doing this, we avoided the statistical and interpretation problems that we would have encountered if forced to study resident outcomes that were fragmented across 11 indicators. Third, we regrouped the sample in different ways to confirm the veracity of the initial findings. Such checks add to internal validity and should be encouraged in future research because it provides stronger evidence for making valid conclusions.
Finally, unlike previous researchers, we did not rely heavily on central tendency theory in this study. In an effort to gain new insights into effective management of nursing homes, we used outlier analysis. However, the findings should be interpreted within the context of the limitations of the method. In particular, when choosing cases based on extreme scores, the range of scores used in analysis is restricted and extreme values in the sample may represent sampling error, measurement error, or a misspecified model (Daft & Lewin, 1990). Because we selected cases using known population values, the data in this study are less susceptible to sampling error, whereas the other sources of error could be influencing the findings.
Footnotes
An earlier version of this paper was presented at the Sixth National Nursing Administration Research Conference, Minneapolis, MN, October 27, 1995. We thank the Texas Health Care Association and the Texas Department of Human Services for their assistance in obtaining the data for the study. We also thank Drs. Glenda Joiner-Rogers, Reuben McDaniel, Jr., and Shirin Catterson for their comments on drafts of this paper. Requests for reprints should be made to the first author at The University of Texas at Austin, School of Nursing, 1700 Red River, Austin, Texas 78701.
References
- Aaronson WE, Zinn JS, Rosko MD. Do for-profit and not-for-profit nursing homes behave differently? Gerontologist. 1994;34:775–786. doi: 10.1093/geront/34.6.775. [DOI] [PubMed] [Google Scholar]
- Anderson, R. A., Issel, L. M., & McDaniel, R. R. (in press). Nursing staff turnover in nursing homes: A new look. Public Administration Quarterly.
- Berlowitz DR, Ash AS, Brandeis GH, Brand HK, Halpern JL, Moskowitz MA. Rating long-term care facilities on pressure ulcer development: Importance of case-mix adjustment. Annals of Internal Medicine. 1996;124:557–563. doi: 10.7326/0003-4819-124-6-199603150-00003. [DOI] [PubMed] [Google Scholar]
- Bettis RA. Strategic management and the straightjacket: An editorial essay. Organization Science. 1991;2:315–319. [Google Scholar]
- Braun BI. The effect of nursing home quality on patient outcome. Journal of the American Geriatrics Society. 1991;39:329–338. doi: 10.1111/j.1532-5415.1991.tb02896.x. [DOI] [PubMed] [Google Scholar]
- Cherry RL. Agents of nursing home quality of care: Ombudsmen and staff ratios revisited. Gerontologist. 1991;31:302–308. doi: 10.1093/geront/31.3.302. [DOI] [PubMed] [Google Scholar]
- Coburn AF, Fortinsky R, McGuire C, McDonald TP. Effect of prospective reimbursement on nursing home costs. Health Services Research. 1993;28:45–68. [PMC free article] [PubMed] [Google Scholar]
- Cohen JW, Dubay LC. The effects of Medicaid reimbursement method and ownership on nursing home costs, case mix, and staffing. Inquiry. 1990;27:183–200. [PubMed] [Google Scholar]
- Daft RL, Lewin AY. Can organization studies begin to break out of the normal science straitjacket? An editorial essay. Organization Science. 1990;1:1–9. [Google Scholar]
- Department of Health and Human Services. 2 CFR Part 405 et al. Federal Register. 1989;54:5316–5373. [Google Scholar]
- Donabedian A. Evaluating the quality of medical care. Milbank Memorial Fund Quarterly. 1966;44 (Suppl):166–206. [PubMed] [Google Scholar]
- Donabedian A. The quality of care: How can it be assessed? Journal of the American Medical Association. 1988;260:1743–1748. doi: 10.1001/jama.260.12.1743. [DOI] [PubMed] [Google Scholar]
- Hays, W. L. (1988). Statistics. New York: Harcourt Brace Jovanovich.
- Health Care Financing Administration. Medicare program: Selected performance information on hospitals providing care to Medicare beneficiaries. Federal Register. 1987;52:30741. [PubMed] [Google Scholar]
- Institute of Medicine. (1996). Nursing staff in hospitals and nursing homes: Is it adequate? Washington DC: National Academy Press.
- Johnson-Pawlson J, Infeld DL. Nurse staffing and quality of care in nursing facilities. Journal of Gerontological Nursing. 1996;22:36–45. doi: 10.3928/0098-9134-19960801-11. [DOI] [PubMed] [Google Scholar]
- Kolanowski A, Hurwitz S, Talyor LA, Evans L, Strumpf N. Contextual factors associated with disturbing behaviors in institutionalized elders. Nursing Research. 1994;43:73–79. [PubMed] [Google Scholar]
- Lieberman T. Nursing homes: A special investigative report. Consumer Reports. 1995;60:518–528. [Google Scholar]
- Linn MW, Gurel L, Linn BS. Patient outcome as a measure of quality of nursing home care. American Journal of Public Health. 1977;67:337–344. doi: 10.2105/ajph.67.4.337. [DOI] [PMC free article] [PubMed] [Google Scholar]
- Maraldo, P. J. (1991). Quality in long-term care. In A. Graubard (Ed.), Mechanisms of quality in long-term care (pp. 1-11). New York: National League for Nursing Press.
- Meyer AD, Tsui AS, Hinings CR. Configurational approaches to organizational analysis. Academy of Management Journal. 1993;36:1175–1195. [Google Scholar]
- Miller D. Configurations of strategy and structure: Toward a synthesis. Strategic Management Journal. 1986;7:233–249. [Google Scholar]
- Munroe DJ. The influence of registered nurse staffing on the quality of nursing home care. Research in Nursing & Health. 1990;13:263–70. doi: 10.1002/nur.4770130409. [DOI] [PubMed] [Google Scholar]
- Norusis, M. J. (1993). SPSS for Windows advanced statistics. Chicago: SPSS Inc.
- Pear, R. (1996, December17). W. S. may curb nursing home inspections. Austin American-Statesman, p. 2A.
- Phillips CD, Hawes C, Fries BE. Reducing the use of physical restraints in the home: Will it increase costs? American Journal of Public Health. 1993;83:342–348. doi: 10.2105/ajph.83.3.342. [DOI] [PMC free article] [PubMed] [Google Scholar]
- Rohrer JE, Momany ET, Chang W. Organizational predictors of outcomes of long-stay nursing home residents. Social Science & Medicine. 1993;37:549–554. doi: 10.1016/0277-9536(93)90290-k. [DOI] [PubMed] [Google Scholar]
- Rudman D, Slater EJ, Richardson TJ, Mattson DE. The occurrence of pressure ulcers in three nursing homes. Journal of General Internal Medicine. 1993;8:653–658. doi: 10.1007/BF02598281. [DOI] [PubMed] [Google Scholar]
- Spector WD, Takada HA. Characteristics of nursing homes that affect resident outcomes. Journal of Aging and Health. 1991;3:427–454. doi: 10.1177/089826439100300401. [DOI] [PubMed] [Google Scholar]
- Stineman MG. Measuring casemix, severity, and complexity in geriatric patients undergoing rehabilitation. Medical Care. 1997;35:JS90–JS105. doi: 10.1097/00005650-199706001-00018. [DOI] [PubMed] [Google Scholar]
- Sullivan-Marx EM. Restraint-free care: How does a nurse decide? Journal of Gerontological Nursing. 1996;22:7–14. doi: 10.3928/0098-9134-19960901-07. [DOI] [PubMed] [Google Scholar]
- Tabachnick, B. G., & Fidell, L. S. (1989). Using multivariate statistics (2nd ed.). New York: Harper Collins.
- Tarr JD. Developing performance measurement systems that support continuous improvement. Hospital Materiel Management Quarterly. 1995;17:59–67. [PubMed] [Google Scholar]
- Texas Department of Human Services. (1990). Instructions. Form 3652-A (CARE). Austin, TX: Texas Department of Human Services.
- Ward, M. (1991, December12). Nursing home violations mount. Austin American-Statesman, p. 1A.
- Weissert WG, Musliner MC. Case mix adjusted nursing-home reimbursement: A critical review of the evidence. Milbank Quarterly. 1992;70:455–490. [PubMed] [Google Scholar]
- Wilson, S., Boulter, C., McDonald-Robers, P., Buchanan, R., Godbout, R., Malitz, D., & Lorenzen, S. (1990). Texas nursing home case mix project: Quarterly Progress Report Austin TX: Texas Department of Human Services.
- Zimmerman DR, Karon SL, Arling G, Clark RB, Sainforth F, Ross R. Development and testing of nursing home quality indicators. Health Care Financing Review. 1995;16(4):107–127. [PMC free article] [PubMed] [Google Scholar]
- Zinn JS, Aaronson WE, Rosko MD. Variations in the outcomes of care provided in Pennsylvania nursing homes. Facility and environmental correlates Medical Care. 1993;31:475–487. doi: 10.1097/00005650-199306000-00001. [DOI] [PubMed] [Google Scholar]
- Zucker LG. Institutional theories of organization. Annual Review of Sociology. 1987;13:443–464. [Google Scholar]