

Abstract
Prolactin (PRL) is secreted from lactotrophs of the anterior pituitary gland of rats in a unique pattern in response to uterine cervical stimulation (CS) during mating. Surges of PRL secretion occur in response to relief from hypothalamic dopaminergic (DA) inhibition and stimulation by hypothalamic releasing neurohormones. In this study we characterize the role of oxytocin (OT) in this system and the involvement of vasoactive intestinal polypeptide (VIP) from the suprachiasmatic nucleus (SCN) in controlling OT and PRL secretion of CS rats.
The effect of OT on PRL secretion was demonstrated in cultured lactotrophs showing simultaneous enhanced secretion rate and increased intracellular Ca2+. Neurosecretory OT cells of the hypothalamic paraventricular nucleus which express VIP receptors were identified by using immunocytochemical techniques in combination with the retrogradely transported neuronal tracer Fluoro-Gold (i.v. injected). OT measurements of serial blood samples obtained from ovariectomized (OVX) CS rats displayed a prominent secretory peak at the time of the afternoon PRL peak. The injection of VIP antisense oligonucleotides into the SCN abolished the afternoon increase of OT and PRL in CS-OVX animals. These findings suggest that there is an involvement of VIP from the SCN contributing in the regulation of OT and PRL secretion in CS rats.
We propose that in CS rats the regulatory mechanism(s) for PRL secretion comprise coordinated action of neuroendocrine DA and OT cells, both governed by the daily rhythm of VIPergic output from the SCN. This hypothesis is illustrated with a mathematical model.
Keywords: Prolactin, Oxytocin, Vasoactive intestinal polypeptide, Periventricular nucleus, Suprachiasmatic nucleus, Computational modeling
INTRODUCTION
Prolactin (PRL) is one of the most versatile hormones of mammalian organisms. It plays a key role in lactation, and contributes to a wide range of physiological functions (1). In the rat, PRL is secreted in various patterns depending on the physiological state of the animal. Pronounced PRL release is initiated in cycling rats during the afternoon of proestrus every fourth/fifth day or by nursing pups on lactating dams. Stimulation of the uterine cervix (CS) during mating (leading to pregnancy/pseudopregnancy) induces a PRL secretory pattern consisting of nocturnal surges (N) between 01:00 – 05:00 h, and diurnal surges (D) between 16:00 – 18:00 h (1).
PRL is synthesized and secreted by lactotrophs in the anterior lobe of the pituitary gland (1). Its release is under tonic inhibition by dopamine (DA) (2), originating from three distinct hypothalamic neuronal populations (3). It has been shown that coincident with the release of PRL, DA levels in the portal blood that supplies the anterior lobe is reduced (4, 5). However, the temporary reduction of the PRL inhibiting hormone (PIH) DA does not fully account for the entire amount of PRL released. Additional prolactin releasing neurohormones (PRH) of hypothalamic origin may be involved in the formation of the surges (1). Oxytocin (OT) is one promising PRH candidate. Several in vivo and in vitro studies have indicated a stimulatory effect of OT on the release of PRL (1, 7, 8). The infusion of OT antagonist also suppressed both the N and D PRL surges of CS rats (9). Furthermore, in situ hybridization studies have shown OT receptor mRNA expression in lactotrophs (6).
Neurons in the paraventricular nucleus (PVN) of the hypothalamus are major production sites for OT (10). It has been shown that OT neurons in PVN of OVX rats display daily activity rhythms that correlate with the PRL releasing pattern in CS rats (11).
The suprachiasmatic nucleus (SCN) of the hypothalamus is known for its pacemaker function, responsible for timing circadian rhythms in mammals (13). The nucleus can be subdivided into a shell and core region; the core dominanted by vasoactive intestinal polypeptide (VIP)-producing neurons (14). Neuronal tract-tracing studies demonstrated efferent connections from SCN to PVN in rats (15). Further studies identify these efferents as VIPergic, innervating several regions of the hypothalamus (16) and in situ hybridization studies have verified VIP2 receptor mRNA expression within the PVN (12). Immunocytochemical investigations and mRNA measurements in the SCN revealed a daily rhythm of VIP that peaks during the dark phase (17, 18, 19). This rhythm is absent under constant dark conditions (19) and is reduced in unilaterally enucleated rats (20).
We hypothesize that OT acts as a PRH in CS rats. In our model, the SCN serves as pacemaker, dictating the activity pattern of hypothalamic DA and OT neurons via its rhythmic VIP output. We illustrate this hypothesis with a mathematical model that demonstrates how VIPergic control of DA and OT neurons may produce the charactersistic PRL secretory pattern in CS rats.
MATERIALS AND METHODS
Animals
Adult female Spargue-Dawley rats (Charles River, Raleigh NC, 200–250 g) were kept in standard rat cages under a 12:12 h light-dark cycle (lights on at 06:00 h) with water and rat chow ad libitum. All animals were bilaterally ovariectomized (OVX) under Halothane anesthesia. The uterine cervix was electrically stimulated with two platinum electrodes placed 2 mm apart at the tip of a Teflon rod. The first CS was applied 30 hours (at 17:00 h) and the second 15 hours (at 09:00 h) before the first blood sampling time. Stimulations were applied as two consecutive trains of electric current of 10 s duration (rectangular pulses 1 ms of 40 V at 200 Hz). This procedure has been shown to yield the highest success rate in initiating two daily PRL surges characteristic of pregnant/pseudopregnant rats (21). All animal procedures were approved by the Florida State University Animal Care and Use Committee.
SCN guide cannula and jugular vein catheter implantation
Rats were anesthetized with a mixture of Ketamine (65 mg/kg) and Xylazine (4 mg/kg) and placed in a stereotaxic frame. After drilling a hole through the skull, bilateral stainless steel guide cannulae (26 gauge, 1 mm apart; Plastics One, Roanoke VA) were lowered to the dorsal border of the SCN (coordinates according to the rat atlas by Paxinos and Watson (22): 0.7 mm caudal to Bregma and 7.9 mm ventral to the dura mater). The cannulae were held in place by dental cement anchored by screws.
Polyurethane catheter tubing (Micro-Renathane, Braintree Scientific Inc., Braintree MA), extended with Tygon tubing (TGY-040–100, Small Parts Inc., Miami Lakes FL), was inserted into the jugular vein while the rats were anesthetized with Halothane. The tubing, filled with heparinized saline (50 U/ml), was fitted subcutaneously and exteriorized at the back of the animal’s neck. A daily flush with heparinized saline kept the line open until the start of the blood collection at 23:00 h, five days after surgery.
Radioimmunoassay (RIA)
Serum concentrations of PRL were estimated in duplicate by the rat PRL RIA kit as previously described (23). Rat PRL RP-3 standard was supplied by Dr. Albert Parlow through the National Hormone and Pituitary Program. The measurement of serum OT concentration was performed with the Phoenix OT kit (Phoenix Pharmaceuticals Inc., Belmont CA, validated for the use of rat serum) according to the manufacturer’s protocol. The assay sensitivity was 1 pg/ml serum.
VIP antisense oligonucleotides injections
Phosphorothioated oligonucleotides dissolved in artificial cerebrospinal fluid (aCSF) was infused through 33 gauge needles inserted in the guide cannulae. The antisense oligonucleotides (AS-ODN) were 20-mers complementary to the cap site (5′-GCTCTGCACTACAACCTGAC-3′) and translation start site (5′-TTGCTTCTGGATTCCATCTC-3′) of the rat VIP mRNA. Control random sequence oligonucleotides (RS-ODN) were 20-mers with the same ATGC content as the AS-oligos but in random sequence that had no significant homology to any known peptides localized in the SCN (24). Each side of the SCN received a 0.4 μl injection (applied within 1 min) of the corresponding ODN (ODN: 1 μg/μl in 0.9% saline solution; aCSF: 125 mM NaCl, 2.5 mM KCl, 1.25 mM NaH2PO4, 1 mM MgCl2, 25 mM NaHCO3, 2 mM CaCl2, 25 mM Glucose), 36 h prior to the first blood collection time point. This dose has been previously reported not to result in significant side effects or toxicity when used for SCN injection (24). ODN were produced locally at the Florida State University Biochemical Analysis and Synthesis Service (BASS) laboratory.
Blood collection
Starting at 23:00 h five days after surgery, 200 μl blood was collected at two-hour intervals over a period of 24 hours (excluding the 09:00 h time point). Serum samples were stored at 4C until analysis.
Immunocytochemistry (ICC)
Rats were transcardially perfused with 60 ml of cold perfusion rinse (0.5% NaNO2 in 0.9% saline solution) followed by 300 ml of cold 4% paraformaldehyde in 0.1 M phosphate buffer saline (PBS, pH 7.2). The brains were removed, post-fixed in 4% paraformaldehyde/PBS overnight and placed in 20% sucrose/PBS for at least 12 h. Coronal sections (40 μm) of the brains (through SCN and PVN) were cut on a freezing microtome and stored in cryoprotectant (25). Before the incubation with the primary antibody (for 24 hours at 4C), the sections were washed three times in 0.1% Triton-X-100 in PBS and exposed to 10% normal goat serum (Chemicon, Temecula CA) in PBS for 1 hour. Depending on the experiment, the following primary antibody combinations were used: a) OT (rabbit anti-OT, IHC8152, Peninsula Lab. Inc., Belmont CA, dilution 1:5000); b) OT and VIP receptor subtype 2 (mouse anti-VIP2R, AS69-P, Antibody Solutions, Palo Alto CA, dilution 1:600) together or c) VIP (sheep anti-VIP, AB 1581, Chemicon International Inc., Temecula CA, dilution 1:5000). The binding specificity of the antibodies were published in a previous study (26). To test for specificity of label in our ICC protocol, tissue sections were incubated in antibody against VIP2R that had been preabsorbed with the immunizing VIP2R peptide (corresponding to amino acids 105–122; Antibody Solutions, Palo Alto CA). whereas other sections were incubated in buffer without primary antibody. Secondary antibodies, conjugated to fluorescent probes CY2 (donkey anti-rabbit/sheep, Jackson Immunoresearch, West Grove PA) or CY3 (donkey anti-goat/mouse, Jackson Immunoresearch, West Grove PA), were added in the concentration of 1:600 for another 24 hours at 4 C. All primary and secondary antibodies were diluted in 0.4% Triton-X-100/0.01% Na-Azide in PBS. Finally, sections were mounted on glass slides, coverslips applied with Aqua Polymount (Polysciences, Inc., Warrington PA) and sealed with nail polish.
For the quantification of protein expression levels after the VIP AS-ODN injection, three 40 μm thick coronal brain sections through the ventrolateral SCN (14) were analyzed per animal for the intensity of VIP immunoreactivity as described by Turgeon et al. (27) and Gerhold et al. (24). Two images were taken by a digital camera (SPOT camera, Diagnostic Instruments Inc., Sterling Heights MI) per brain section (right and left core region of SCN) on a fluorescent microscope (Leica). Using the image analysis software MetaMorph (version 5.0r1, Universal Imaging Corporation), the mean pixel intensity of staining was calculated (relative intensity units) within a circle (d = 400 μm, Fig. 4A) encompassing the core region of SCN. The bases for the calculation were 8-bit monochrome images with a range of 255 gray values. At the end, one average number of mean intensity in the SCN per animal was calculated.
Fig. 4.
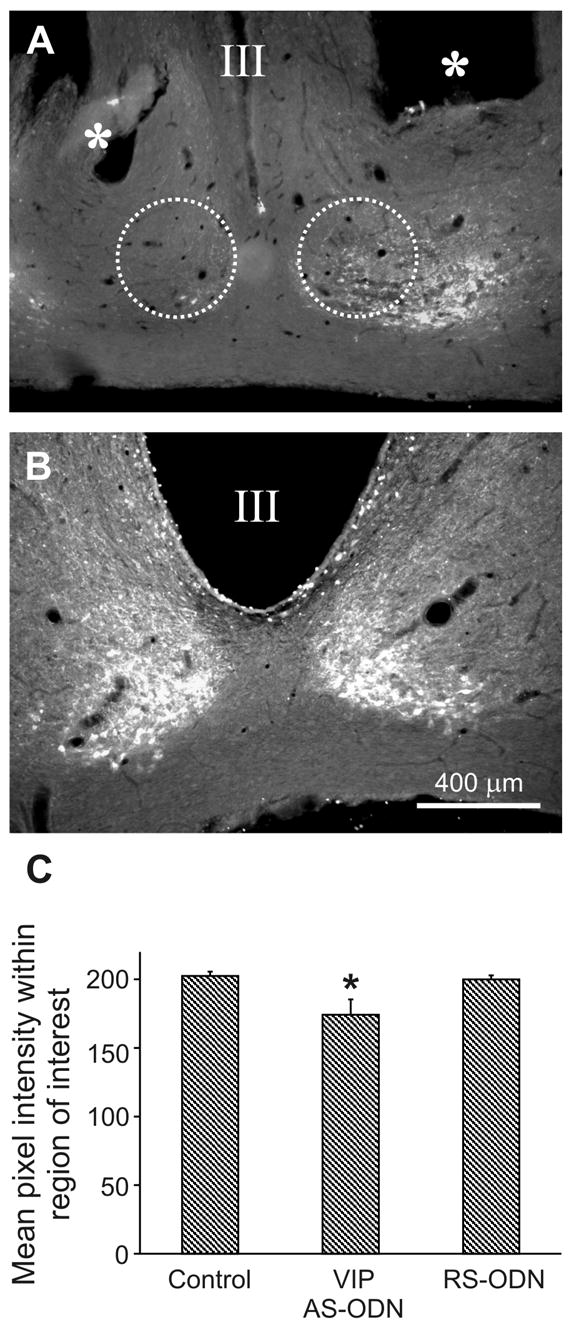
Reduction of VIP immunoreactivity in the SCN after the bilateral injection of AS-oligos complementary to the rat VIP-mRNA. Representative photomicrographs illustrating the reduction in VIP-immunoreactivity by comparing the intensity of the staining 58 hours after the AS-oligo injection (A) with control animals (B). (C) Bar graph of the mean pixel intensities (gray values) within the core region of SCN (d = 400 μm, dashed circle in A) of controls (c, n = 4 animals), and VIP AS-ODN (n = 3 animals) as well as random sequenced oligos (RS-ODN, n = 3 animals) treated rats.. Only the VIP AS-oligo treatment caused a significant reduction (P < 0.05, *) of the VIP immunoreactivity. Values are expressed as mean gray values ± S.E.M. Scale bar = 400 μm.
Fluoro-Gold (FG) and OT double labeling
The systemic administration of FG (Fluorochrome, LLC, Denver CO) is a well established method for labeling neurosecretory cells (28–30). In our experiments, the rats (n = 3) received an injection of 20 mg/kg body weight FG, dissolved in 0.9% saline, via the tail vein. After 72 hours, the same procedure as described above was used for fixing, cutting and ICC OT labeling.
Dispersion of AP glands and lactotroph enrichment
The dispersion of AP glands was similar to our previous published protocol (31). Before plating, the cell suspension was enriched for lactotrophs using a slightly modified version of the Percoll discontinuous density gradient enrichment protocol (32), yielding 75 – 90% lactotrophs. Briefly, the suspension was applied on top of a Percoll (Sigma) density gradient (50% and 35% Percoll in HEPES-buffered saline (HBS)). After 20 min of centrifugation (700 G), the interface was gently aspirated and transferred into HBS. Following rinses in HBS and centrifugation (2x), cells were plated on 35 mm poly-L-lysine (Sigma) -coated glass coverslips in a density of 106 cells/coverslip and stored in 10% fetal bovine serum (FBS, Intergen, Purchase NY)/Dulbecco’s Modified Eagles Medium (DMEM, GIBCO, Rockville MD). The cultures were kept in a CO2 incubator at 5% CO2 and 37 C for two days before use in Ca2+ imaging studies. Lactotrophs express TRH receptors (33) and release PRL in response to TRH in a dose-dependent manner (1). Furthermore, the calcium-mobilizing actions of TRH on lactotrophs have been well characterized (34). Therefore, lactotrophs were further identified by their post-hoc response to TRH application as well as their cell-type specific morphology.
Intracellular Ca2+ recordings
Intracellular Ca2+ ([Ca2+]i) was determinde by quantitative fluorescent microscopy using the calcium probe Fura-2/AM (Molecular Probes) as described previously (35). In brief, after three HBS washes, the coverslips bearing cultured lactotrophs were incubated with 5 μM Fura-2/AM in HBS for 30 min at 37 C in a CO2 incubator before placement in a Dvorak-Stotler chamber. Average intensities of light emission of each cell were measured at 510 nm by a digital camera (C4745-95, Hamamatsu Corporation, Bridgewater NJ) during exposure to alternating 340 nm and 380 nm light beams on an inverted microscope (Axiovert 35, Zeiss). Intracellular Ca2+ is expressed as the ratio of 340 nm/380 nm of single cells that was calculated with the software MetaFluor (version 4.6r9, Universal Imaging Corporation, Downingtown PA). Lactotrophs were perfused with prewarmed HBS supplemented with CaCl2 (2 mM) and MgCl2 (1 mM) at a rate of one ml/min. Temperature was held constant at 37 C by in-line solution heater (SH-27A, Warner Instruments, Inc Hamden CT). After establishing basal condition, test substances were applied for 2 min by switching to a perfusion solution containing OT (10−8 M – 10−6 M, Peninsula Lab. Inc., Belmont CA) or TRH (10−6 M). The effluent media was collected every minute by a fraction collector (FC 203, Gilson Inc., Middleton WI) and stored at 4 C until PRL concentration was determined.
Data analysis and statistics
Fluorecent labeling in brain sections were visualized using the CY2-CY3 filter combination on a fluorescent microscope (Leica) and images produced with a digital camera (SPOT camera, Diagnostic Instruments Inc., Sterling Heights MI). High resolution images of OT and VIP2R immunostained brain sections were taken with a confocal laser-scanning microscope (Zeiss LSM 510, Heidelberg Germany), equipped with Argon/2 (488 nm) and HeNe1 (543 nm) laser light sources. Images were aquired as a Z-series stack at 0.3 μm steps by using a 40x Plan Neofluar 1.3NA oil objective lens in multitracking configuration. Depending on the region of intersest, stacks of 20 to 60 optical sections (0.9 μm of thickness) were taken from the specimens. Statistical analysis was performed using Microsoft Excel or GraphPad Prism 3.0 (GraphPad Software Inc., San Diego CA). Significance was determined using one-way ANOVA and differences were considered significant if P ≤ 0.05.
Modeling
Mathematical modeling was performed to help interpret the experimental data. The model consists of a set of three equations describing the time-dependent variation of PRL, DA, and OT concentrations. The equations reflect the stimulatory and inhibitory interactions among cell types, based on data reported in this study, as well as data from the literature. The first equation, for PRL, is
| (1) |
The factor 1/(kD + DA) is a decreasing function of DA concentration and reflects the inhibitory effect of DA on PRL secretion. The factor is an increasing sigmoidal function of OT concentration and reflects the stimulatory effect of OT. The final term, qPPRL, accounts for removal of PRL from the system.
The second differential equation in the model describes the dynamics of DA,
| (2) |
The parameter DA∞ is the steady state or long-term value of the DA concentration. The term qD(DA∞ − DA) ensures that DA approaches its steady state with a time constant of 1/qD. The second term, νD, is set to a positive value during periods when there is inhibitory VIP input to DA neurons from the SCN (two hours at night in the simulation of VIP RS-ODN treated animals). This causes DA concentration to decrease.
The third differential equation describes the dynamics of OT,
| (3) |
The first term, , is an increasing function of the stimulatory factor x. The existence of such a factor is one of the predictions of the model. This is elevated twice per day in our simulations, at night and in the afternoon. The second term, qOOT, reflects removal of OT from the system. The final term, νO, is a parameter that is elevated once per day (two hours at night in simulations of VIP RS-ODN animals) and reflects inhibitory VIP input onto OT cells.
Parameter values were adjusted to match the experimental PRL and OT time courses. Model equations were integrated using the CVODE numerical method as implemented in the program XPPAUT (36). Parameter values used in the integration are listed in Table 1. The model can be downloaded from our website at www.neuro.fsu.edu/postDocs/egli or www.math.fsu.edu/~bertram.
TABLE 1.
Parameter values used in the mathematical model (see Materials and Methods section for parameter description).
| Parameter | Value |
|---|---|
| DA4 | 20000 ng/ml |
| kD | 300 |
| kO | 9 |
| kx | 50 |
| qD | 0.2 |
| qO | 1 |
| qP | 0.5 |
| rO | 1100 |
| rP | 300000 |
| νO | 500 |
| νD | 10000 |
Initial values for DA, OT, and PRL were set to DA(0) = 20000 ng/ml, OT(0) = 25 pg/ml, and PRL(0) = 20 ng/ml.
RESULTS
OT stimulates PRL secretion in lactotrophs through a calcium-dependent mechanism
To confirm that OT is a potent PRH, we investigated the response of lactotrophs to the application of OT by simultaneously monitoring fluctuations of [Ca2+]i and PRL secretion in the perfusion media. For comparison, the PRL secretory response of lactotrophs to the application of TRH (10−6 M) 10 minutes after the OT challenge served as a reference (regarded as 100% response) (37).
Measurement of the concentration of PRL in effluent media from the recording chamber holding a coverslip with 106 cells, revealed a bell-shaped pattern (Fig. 1A) in response to varying concentrations of OT. In the absence of DAergic inhibition, unstimulated cells (C; Fig. 1A) secreted PRL at 35.4 ± 2.7% of the maximal TRH response (10−6 M) (mean ± S.E.M., n = 12 coverslips). The application of 10−8 M OT led to a significant (P < 0.01) increase in PRL secretion to 72.7 ± 8.8% (n = 4 coverslips) of the TRH response. Secretion peaked with the application of 10−7 M OT (91.7 ± 10.6%, P < 0.01, n = 3 coverslips). A higher dose of OT (10−6 M) yielded a smaller PRL secretory response (59.3 ± 7.6%, n = 5 coverslips) that was still significantly greater (P < 0.05) than the control value, C.
Fig. 1.
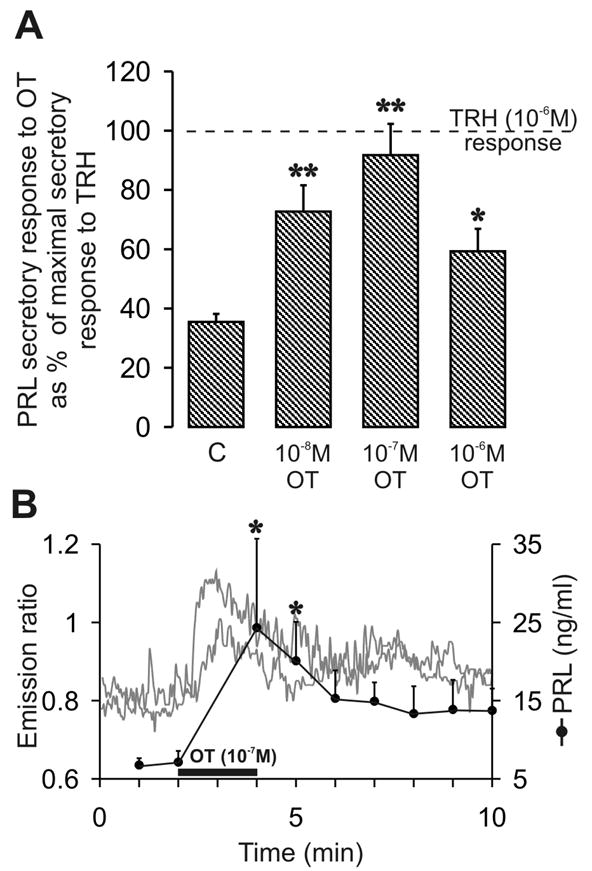
OT induced PRL secretion and [Ca2+]i changes in cultured lactotrophs. (A) Lactotrophs secreted PRL at a rate of 37.9 ± 3.1% of the maximal TRH response (n = 7 coverslips) in control conditions (c) and without DAergic inhibition. OT applied in various concentrations yielded secretion rates of 72.7 ± 8.8% (n = 4 coverslips) under 10−8 M and 91.7 ± 10.6%, (n = 3 coverslips) under 10−7 M. A higher OT concentration (10−6 M) reduced the PRL output to 59.3 ± 7.6% (n = 5 coverslips). Values represents the mean % of secretion rates ± S.E.M.; significant differences from basal value are indicated with * (P < 0.05) and ** (P < 0.01). (B) Application of 10−7 M OT for two minutes provoked a sudden and distinct increase of [Ca2+]i, expressed as an increase in the light emission ratios of Fura-2/AM labeled cells (two representative cells). PRL secretion also increased, coincident with the [Ca2+]i rise. Statistical tests revealed significant differences (P < 0.05) between basal PRL levels and the PRL levels two and three minutes after initiation of OT application. Values represent the mean ± S.E.M. PRL concentration (ng/ml) from three coverslips.
The [Ca2+]i response to OT application (10−8 – 10−6 M) was recorded from 340 individual cells, plated on 20 coverslips. Overall, 31% of these cells demonstrated an increase in the cytosolic Ca2+ concentration. Figure 1B displays the time course of the [Ca2+]i response of two representative cells during and after OT (10−7 M) challenge. The application elicited a rapid rise in [Ca2+]i to a peak within seconds followed by a return to a secondary elevated plateau level. The initial mean emissions ratio rose from 0.84 ± 0.05 up to 1.26 ± 0.13 (P < 0.01, n = 11 cells), under the 10−7 M OT treatment. Analysis of effluent media revealed that PRL secretion increased simultaneously with the [Ca2+]i response in the presence of 10−7 M OT. The peak level of 24.3 ± 11.3 ng/ml secreted PRL was significantly (P < 0.05) higher than basal levels of 6.8 ± 0.9 ng/ml (n = 3 coverslips).
Neurosecretory OT neurons in the PVN and periventricular nucleus (PeVN) express VIP receptor
The retrogradely-transported neurotracer FG (i.v. injected) in combination with ICC was used to identify neurosecretory OT cells. In addition, ICC was performed to determine the pattern of VIP2R expression in neurosecretory OT cells.
Anatomical analysis of OT-FG double staining showed co-localization of almost all of the OT neurons in the anterior magnocellular portion of the PVN (close to the ventral border of the fornix) and the PeVN (yellow staining in Fig. 2A). Similar strong OT-FG co-localization was found further caudal in the lateral and ventral portion of the PVN (yellow staining in Fig. 2B). The localization of OT neurons expressing VIP2R overlapped with OT-FG labeling, especially in the PeVN (filled arrowheas in Fig. 2C) and in the magnocellular portion of the PVN (filled arrowheads in Fig. 2D). These two regions displaied a moderate staining compared to the other subdivisions of the PVN, where just a few scattered cells showed the same co-localization pattern.
Fig. 2.
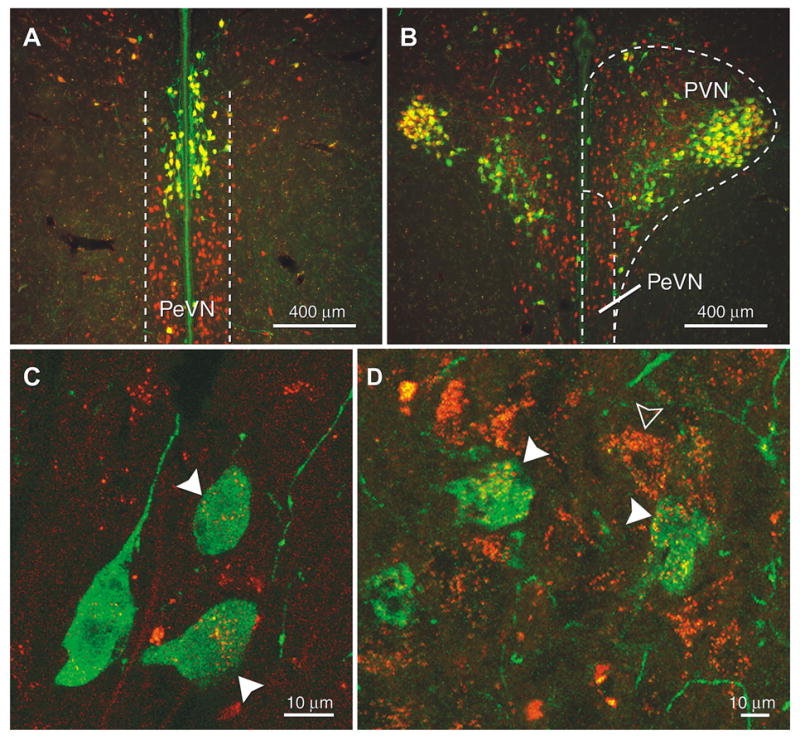
Examples of fluorescent ICC staining for OT and VIP2R in combination with FG in the PeVN and PVN. Double labeled cells (yellow staining) for OT (green) and FG (red) appeared on coronal sections of the PeVN (A) and the PVN (B). High magnified confocal lascer scan images of the same brain areas also showed double labeled cells for OT (green) and VIP2R (red) in the PeVN (C) and the PVN (D). Filled arrowheads indicate co-localization of immunostainging for OT and VIP2R and the outlined arrowhead indicates receptor staining on a non OTergic cell.
VIP antisense oligonucleotides injection into SCN changes the pattern of PRL and OT secretion in CS rats
The AS-ODN technique was used to determine the influence of VIP (SCN origin) in the regulation of OT release and PRL secretion. The reduction of VIP expression caused by the injection of VIP AS-ODN was quantified by analysis of the intensity of ICC VIP staining on SCN sections. On the same sections, a verification of the correct cannulae placement (cannulae tip right above the dorsal border of the SCN) was accomplished in order to validate the measured hormonal response.
The experiments with ODN were performed using the same procedure as described previously (24). AS-ODN against VIP mRNA injected into the SCN caused an ablation of the D PRL surge and a shift of an afternoon OT surges. The remaining surges for both PRL (99.8 ± 34.2 ng/ml, mean ± S.E.M., n = 4; Fig. 3A, open circle) and OT (317.5 ± 128.5 pg/ml, n = 5; Fig. 3B, open circle) peaked simultaneously at 03:00 h. RIA serum measurements from CS-OVX rats, which received RS-ODN injection (as control) confirmed the well known PRL secretory pattern of two peaks per day (N and D surges; Fig. 3A, filled circle). The PRL serum concentration started to rise at 23:00 h and peaked at 03:00 h (61.9 ± 37.6 ng/ml, n = 5) as well as at 17:00 h (41.8 ± 8.5 ng/ml, n = 4). The OT concentration in the serum samples increased in the afternoon, with a peak value of 432.5 ± 161.4 pg/ml (n = 5) at 13:00 h (Fig. 3B, filled circle). Additional control studies were performed on CS-OVX rats without SCN cannula. Blood serum analysis from these experiments demonstrated the same secretory pattern of PRL and OT to that of RS-ODN injected CS-OVX rats (data not shown).
Fig. 3.
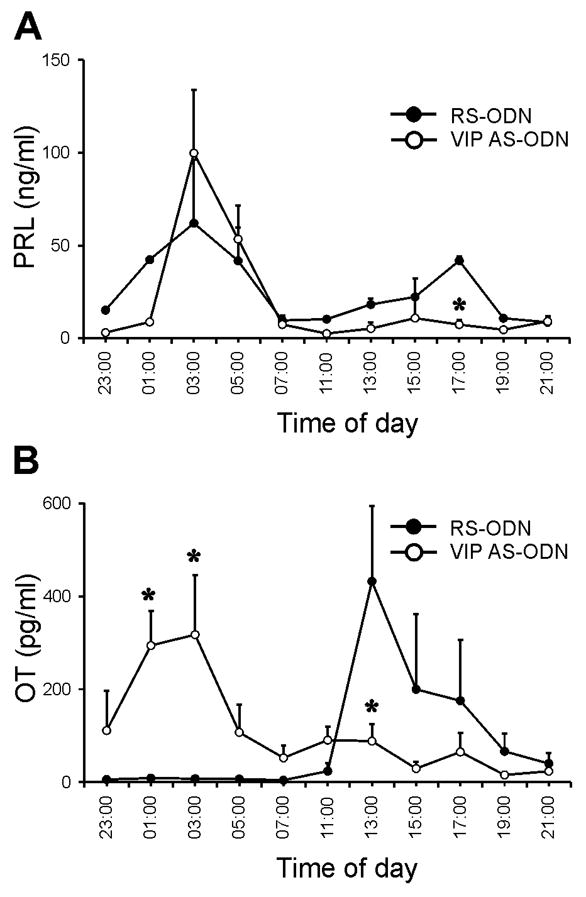
Effect of PRL (A) and OT (B) secretory patterns in CS-OVX rats after intra SCN injcection of VIP AS-ODN or RS-ODN as control. (A) Only nocturnal PRL surges were measured in the serum of VIP AS-ODN treated animals (outlined circles, n = 4) in contrast to the typical nocturnal and diurnal PRL surges in control animals (filled circles, n = 5). (B) Instead of a prominent afternoon OT surges like in the control animals (filled circles, n = 5) there was a nocturnal secretory OT peak coincident with the PRL peak (outlined circles, n = 5). Values are expressed as mean ± S.E.M. ng/ml PRL, mean ± S.E.M. pg/ml OT and * indicates significant differences compared to RS-ODN (P < 0.05).
The effect of VIP AS-ODN administration on VIP synthesis in the SCN is shown in Fig. 4. Compared with the control sections, the injection of the AS-ODN caused a significant reduction (P < 0.05) in VIP immunoreactivity. The mean pixel intensity within the specified area (demonstrated by the dashed circle of an example in Fig. 4A) decreased from 202.5 ± 3.1 (mean intensity value ± S.E.M., n = 4 animals) to 174.2 ± 11.2 (n = 3 animals). In contrast, the injection of RS-ODN did not affect VIP synthesis. The mean pixel intensity remained high at 199.9 ± 2.9 (n = 3 animals).
Mathematical model of the proposed PRL secretion mechanism
To help interpret the data from this study we have developed a mathematical model. This provides the means to illustrate our hypothesis of how the different cell populations interact together to produce the rhythmic PRL secretion shown in Fig. 3.
The model components are illustrated in Fig. 5. Experimental data suggest that VIPergic neurons from the SCN provide rhythmic inhibitory input to DA neurons of the arcuate nucleus (24) and to OT neurons of the PVN/PeVN (Fig. 2C and D, 15, 16). The DA neurons exert sustained inhibitory input to lactotrophs (2), while OT neurons impose stimulatory input (Fig. 1). In addition, there are data suggesting that OT neurons in the PVN receive rhythmic stimulatory input (11), represented as factor x in the model. The pathways illustrated in Fig. 5 are incorporated into the mathematical model, which includes time-dependent equations for PRL, DA, and OT concentrations. The model contains what we postulate to be the main components controlling rhythmic PRL secretion in CS rats. For simplicity, other interactions, such as PRL feedback onto DAergic neurons (38, 39), have not been included in this preliminary model.
Fig. 5.
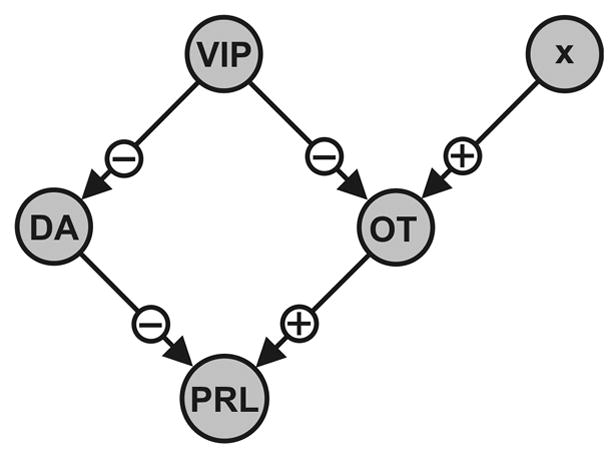
Outline of the network proposed to be involved in the regulation of the rhythmic PRL secretory pattern in CS rats (N and D surges). VIP of SCN relays time-of-day information to DAergic and OTergic neurosecretory cells via inhibition. An additional stimulatory input (x factor) is suggested to feed onto OT neurons. Depending on the activation status of the two categories of secretory cells, OT or DA is released to stimulate or inhibit PRL secretion, respectively.
Figure 6 shows simulations for CS-OVX animals. The N PRL surge (Fig. 6A) is due to a decrease in the DA tone (Fig. 6B), which is caused by the high nighttime level of VIP (Fig. 6C). This elevated VIP activity inhibits the activity of DA neurons, thus eliminating the inhibitory input to the lactotrophs. The OT neurons play little role in the N PRL surge, since their activity is also inhibited by the elevated VIPergic input (Fig. 6B). In the afternoon, the VIPergic input to DA and OT neurons is greatly reduced (Fig. 6C). As a result, the DA tone is greater in the afternoon, providing inhibitory input to the lactotrophs (Fig. 6B). However, there is an afternoon increase in the activity of OT neurons due to drive from a stimulatory “x-factor” and no inhibitory VIP input (Fig. 6B, C) initiating the D PRL surge but because of the higher DA tone at this time of the day, the peak level cannot reacht the N values (Fig. 6A). The identity of the x-factor is unknown at this time, although there is evidence that serotonin plays this role (9, 11).
Fig. 6.
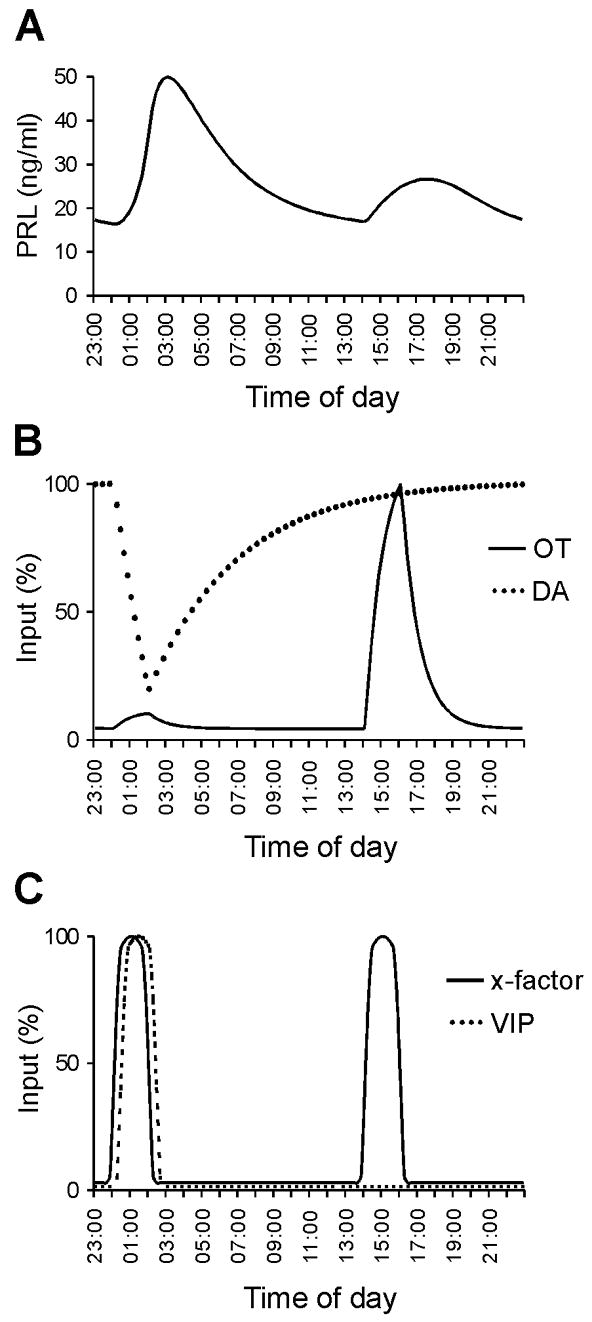
PRL, OT, and DA secretion patterns for CS-OVX rats simulated by the mathematical model. The amount of secreted PRL (A) depends on the input of stimulatory OT (B) and inhibitory DA (B) at any given time. Timing of surges is controlled by the trigger factors VIP and x-factor which provide input to OT and DA neurons (C). The first PRL surge is primarily due to reduction in the inhibitory DA tone, while the second is mainly due to stimulation from OT neurons. The values for OT, DA, VIP, and the x-factor have been normalized to their peak values.
DISCUSSION
Data from this study elucidate the role that OT and VIP play in regulating PRL secretion of rats stimulated in the uterine cervix. However, other stimulatory or inhibitory factors than OT and VIP may be more important in controlling the estrogen- or suckling-induced PRL surges. It is indeed possible that VIP is but a member of a family of neurotransmitters originating in the SCN which in turn regulates families of PRH (e.g. OT) which differ in other physiological states.
Results from the Ca2+ imaging experiments in combination with measurements of PRL highlighted the ability of OT to induce PRL secretion from lactotrophs in a dose-dependent manner. These experiments demonstrated simultaneous elevation of [Ca2+]i and a PRL surge in response to OT application. Therefore, our findings bridge the results from studies demonstrating the pivotal role of [Ca2+]i changes in the regulation of PRL secretion from lactotrophs (37) and the secretion of PRL in a dose dependent fashion during OT treatment of dispersed anterior pituitary cells from lactating rats (40). The biphasic change in the [Ca2+]i response after OT treatment indicates an initial depletion of intracellular Ca2+ stores followed by the opening of Ca2+ channels (41, 42). Further experiments need to be done to clarify the mechanism of this biphasic [Ca2+]i changes. The fact that 31% of the cells (lactotroph-enriched cell population) responded to OT with enhanced [Ca2+]i emphasizes the well known heterogeneity in the response of lactotrophs to secretagogues (43).
The results from the ICC experiments using OT and VIP2R antibodies in combination with FG suggests that VIP controls neurosecretory OT cells. The neurosecretory nature of OTergic cells in the PeVN and PVN was clearly demonstrated by the co-localization of FG (retrogradely transported neurotracer, i.v. applied) and OT immunostaining. Neuronal tracing studies have proven that the median eminence receives fibres from parvocellular and magnocellular OT neurons in the PVN (44) and from neurosecretory cells located in the PeVN (45). Therefore, release of OT from these PeVN and PVN neurons may occur in the median eminence. From there, OT could be further transported to the anterior pituitary gland via the long portal vessels. The pituitary portal vascular system has been proposed to be a window for the central OT neurotransmission to pituitary lactotrophs (44, 46). Alternatively, our detection of OT in the peripheral blood could reflect an overflow from magnocellular cells comprising the hypothalamo-hypophyseal tract to the sinusoids in the posterior lobe and thus could be the route through which OT reaches the anterior pituitary or reflect the delivery through the short portal vessels. Because our results do not distinguish between a magnocellular or parvocellular origin of OT reaching the lactotrophs, additinal investigations are needed to further clarify which of the different subpopulations of neurosecretory OT cells in the PVN and PeVN are responsible for the provision of the lactotrophs stimulating OT during PRL surges of CS rats.
Because PRL surges in CS rats appear in two narrow time windows every day and seem to be light entrained (47, 48), it is likely that these events are triggered by mechanisms involving the light sensing SCN. VIP synthesis in the SCN is mainly regulated by lighting conditions, causing daily fluctuation (17, 18, 19). Since PRL inhibiting neurohormone (PIH) and PRH regulate PRL secretion from lactotrophs in the anterior pituitary gland, it is presumed that the SCN controls these two offsetting factors to govern the PRL surges. VIP would therefore relay time-of-day information to DA neurons as well as OT neurons. Gerhold et al. (24) demonstrated that VIP from the SCN relays time-of-day information to neuroendocrine DAergic neurons by inhibiting the release of the important PIH DA. Although we did not verify a direct connection of VIPergic neurons from the SCN to neurosecretory OT cells, it is reasonable to assume such a link based on our ICC experiments demonstrating VIP2R immunoreactivity on FG-labelled OT neurons. Furthermore, neuronal connection from SCN to the PVN has also been described using different tract-tracing techniques (15, 16). Buijs et al. (49) revealed VIP-containing SCN efferents traveling along the wall of the third ventricle to the PVN. In addition, the authors argued that the rostral PVN, the periventricular PVN and the dorsomedial hypothalamus are excellent candidates for SCN-PVN interactions.
Assuming that VIP controls the activity of DA and OT neurons, an interruption of VIP synthesis in the SCN should consequently alter the PRL release pattern. Indeed, our VIP AS-ODN experiments confirmed such a relationship by demonstrating changes in the timing of PRL and OT surges.
The changes in the PRL and OT secretory pattern as shown in Fig. 3 can be explained by assuming that VIP exerts an inhibitory influence on OTergic and DAergic neurons. Elevated VIP mRNA and peptide content in the SCN at night could indicate an increased VIPergic signaling to target areas (18), including PVN, PeVN and ARC. Studies in which the VIP content in PVN was determined, revealed a higher content between 22:00 h and 06:00 h than during the rest of the day (11). However, further experiments are necessary to define the daily release pattern of VIP at the terminals. The enhanced inhibitory input to the DA and OT neurons consequently decrease their activity. As a result, the reduced DA tone would initiate the nocturnal PRL surge. At this time point, the activity of the OT neurons would be damped through inhibition by VIP. During the day, there would be less inhibition of the DA and OT neurons due to the low VIP expression in the SCN. An additional trigger signal is needed to induce the release of OT that would initiate the D PRL surge. Serotonin may represent such a trigger (factor x), based on earlier data for its involvement in the regulation of the D PRL surge in CS-OVX rats (9). Because there is less inhibition of DA neurons by VIP in the afternoon, the OT-induced afternoon PRL surge would be smaller than the morning surge (50). In order to test our hypothesis, further experiments need to be done to clearify the secretory pattern of VIP as well as 5-HT at these OT and DA neurons.
The injection of VIP AS-ODN into the SCN dampened VIP synthesis (24). The fact that we could still measure OT and PRL surges in these CS rats further supports the idea of the existance of an additional VIP independent factor (factor x) that stimulates OT neurons. However, the appearance of a morning OT and thus PRL surges in these VIP AS-ODN treated animals could indicate that factor x exerts its stimulatory input not only in the afternoon but also in the morning. Such an interpretations is supported by the findings of Arey and Freeman (11), describing an endogenous activity rhythm of OT neurons in the PVN as well as in the PeVN that has two peaks per day (at 03:00 h and 17:00 h) in OVX rats (the rhythmic drive is incorporated into the mathematical model by the timed increase of factor x). The missing afternoon OT and PRL surges implies different strength of the factor x on the OT neurons, (the afternoon signal to the OT neurons must be weaker because no PRL surge can be induced due to the higher DA tone in VIP AS-ODN treated animals). The VIP treatment could also caused a phase-shift of a SCN transmitter signal (other than VIP) that stimulates OT neurons in the PVN. Furthers studies are nessecary to clarify the underlying mechanisms.
Mathematical modeling was used to illustrate our hypothesis of how VIP of SCN origin can serve as a timing signal to control DAergic and OTergic neurosecretory cells, which in turn controls PRL secretion from lactotrophs. In our model, the N PRL surge in CS-OVX animals is due primarily to decreased DA tone, while the D PRL surge is due to pronounced OT stimulation. The model simulations demonstrate that the proposed interactions within this small network might be responsible for the regulation of rhythmic PRL secretion in CS-OVX rats.
While the mathematical model illustrates the self-consistency of our hypothesis for rhythmic PRL secretion, it in no way proves that other processes are not involved. Also, model parameters where chosen to illustrate our hypothesis, and were not independently calibrated. In spite of these caveats, the model has provided an important prediction, that daily stimulatory input (x-factor) is provided to OT neurons. Clarification of the source of this stimulatory factor is target of future work.
In summary, our results suggest that OT is a potent PRH that stimulates lactotrophs via Ca2+-dependent mechanisms. Furthermore, neurosecretory OT cells in the PVN and PeVN showed VIP2R expression. The injection of VIP AS-ODN into the SCN caused an alteration in the OT and PRL secretory rhythms of CS-OVX rats, which indicates that VIP of SCN origin could control the activity of neurosecretory OT cells in the PeVN and the PVN. Therefore, light entrained VIP from the SCN could relay time-of-day information to neurosecretory OT cells in the PeVN and the PVN, triggering PRL secretion from lactotrophs in the anterior pituitary gland.
Acknowledgments
We gratefully acknowledge the technical support of Cheryl Fitch-Pye and Charles Badland as well as the assistance of Kim Riddle and Jon Ekman from the Biological Sciences Imaging Resource at FSU. We also thank Dr. Béla Kanyicska for critical reading of the manuscript and Dr. Albert Parlow for RIA reagents.
Footnotes
Grants/Fellowships: This work was supported by a fellowship of the Lalor Foundation to Marcel Egli, National Science Foundation grant DMS 0311856 to Richard Bertram and National Institute of Health grant DK43200 to Marc Freeman.
References
- 1.Freeman ME, Kanyicska B, Lerant A, Nagy G. Prolactin: structure, function, and regulation of secretion. Physiol Rev. 2000;80:1524–1631. doi: 10.1152/physrev.2000.80.4.1523. [DOI] [PubMed] [Google Scholar]
- 2.Ben-Jonathan N. Dopamine: a prolactin-inhibiting hormone. Endocr Rev. 1985;6:564–589. doi: 10.1210/edrv-6-4-564. [DOI] [PubMed] [Google Scholar]
- 3.Ben-Jonathan N, Hnasko R. Dopamine as a prolactin (PRL) inhibitor. Endocr Rev. 2001;22:724–763. doi: 10.1210/edrv.22.6.0451. [DOI] [PubMed] [Google Scholar]
- 4.DeGreef WJ, Neill JD. Dopamine levels in hypophysial stalk plasma of the rat during surges of prolactin secretion induced by cervical stimulation. Endocrinology. 1979;105:1093–1099. doi: 10.1210/endo-105-5-1093. [DOI] [PubMed] [Google Scholar]
- 5.McKay DW, Pasieka CA, Moore KE, Riegle GD, Demarest KT. Semicircadian rhythm of tuberoinfundibular dopamine neuronal activity during early pregnancy and pseudopregnancy in the rat. Neuroendocrinology. 1982;34:229–235. doi: 10.1159/000123304. [DOI] [PubMed] [Google Scholar]
- 6.Breton C, Pechoux C, Morel G, Zingg HH. Oxytocin receptor messenger ribonucleic acid: characterization, regulation, and cellular localization in the rat pituitary gland. Endocrinology. 1995;136:2928–2936. doi: 10.1210/endo.136.7.7540544. [DOI] [PubMed] [Google Scholar]
- 7.Erskine MS. Prolactin release after mating and genitosensory stimulation in females. Endocr Rev. 1995;16:508–528. doi: 10.1210/edrv-16-4-508. [DOI] [PubMed] [Google Scholar]
- 8.Samson WK, Schell DA. Oxytocin and the anterior pituitary gland. Adv Exp Med Biol. 1995;395:355–364. [PubMed] [Google Scholar]
- 9.Arey BJ, Freeman ME. Oxytocin, vasoactive-intestinal peptide, and serotonin regulate the mating-induced surges of prolactin secretion in the rat. Endocrinology. 1990;126:279–284. doi: 10.1210/endo-126-1-279. [DOI] [PubMed] [Google Scholar]
- 10.Gainer H, Wray S. Cellular and molecular biology of oxytocin and vasopressin. In: Knobil E, Neill JD, editors. The physiology of reproduction. Raven press; New York: 1994. pp. 1099–1129. [Google Scholar]
- 11.Arey BJ, Freeman ME. Activity of oxytocinergic neurons in the paraventricular nucleus mirrors the periodicity of the endogenous stimulatory rhythm regulating prolactin secretion. Endocrinology. 1992;130:126–132. doi: 10.1210/endo.130.1.1727695. [DOI] [PubMed] [Google Scholar]
- 12.Sheward WJ, Lutz EM, Harmar AJ. The distribution of vasoactive intestinal peptide2 receptor messenger RNA in the rat brain and pituitary gland as assessed by in situ hybridization. Neuroscience. 1995;67:409–418. doi: 10.1016/0306-4522(95)00048-n. [DOI] [PubMed] [Google Scholar]
- 13.Weaver DR. The suprachiasmatic nucleus: a 25-year retrospective. J Biol Rhythms. 1998;13:100–112. doi: 10.1177/074873098128999952. [DOI] [PubMed] [Google Scholar]
- 14.Moore RY, Speh JC, Leak RK. Suprachiasmatic nucleus organization. Cell Tissue Res. 2002;309:89–98. doi: 10.1007/s00441-002-0575-2. [DOI] [PubMed] [Google Scholar]
- 15.Watts AG, Swanson LW, Sanchez-Watts G. Efferent projections of the suprachiasmatic nucleus: I. Studies using anterograde transport of Phaseolus vulgaris leucoagglutinin in the rat. J Comp Neurol. 1987;258:204–229. doi: 10.1002/cne.902580204. [DOI] [PubMed] [Google Scholar]
- 16.Teclemariam-Mesbah R, Kalsbeek A, Pevet P, Buijs RM. Direct vasoactive intestinal polypeptide-containing projection from the suprachiasmatic nucleus to spinal projecting hypothalamic paraventricular neurons. Brain Res. 1997;748:71–76. doi: 10.1016/s0006-8993(96)01246-2. [DOI] [PubMed] [Google Scholar]
- 17.Morin A, Denoroy L, Jouvet M. Daily variations in concentration of vasoactive intestinal polypeptide immunoreactivity in discrete brain areas of the rat. Brain Res. 1991;538:136–140. doi: 10.1016/0006-8993(91)90387-b. [DOI] [PubMed] [Google Scholar]
- 18.Okamoto S, Okamura H, Miyake M, Takahashi Y, Takagi S, Akagi Y, Fukui K, Okamoto H, Ibata Y. A diurnal variation of vasoactive intestinal peptide (VIP) mRNA under a daily light-dark cycle in the rat suprachiasmatic nucleus. Histochemistry. 1991;95:525–528. doi: 10.1007/BF00315750. [DOI] [PubMed] [Google Scholar]
- 19.Shinohara K, Tominaga K, Isobe Y, Inouye ST. Photic regulation of peptides located in the ventrolateral subdivision of the suprachiasmatic nucleus of the rat: daily variations of vasoactive intestinal polypeptide, gastrin-releasing peptide, and neuropeptide Y. J Neurosci. 1993;13:793–800. doi: 10.1523/JNEUROSCI.13-02-00793.1993. [DOI] [PMC free article] [PubMed] [Google Scholar]
- 20.Laemle LK. Unilateral enucleation alters vasoactive intestinal polypeptide-like immunoreactivity in the suprachiasmatic nucleus of the rat. Brain Res. 1992;572:325–328. doi: 10.1016/0006-8993(92)90494-t. [DOI] [PubMed] [Google Scholar]
- 21.Gorospe WC, Freeman ME. The effects of various methods of cervical stimulation on continuation of prolactin surges in rats. Pro Soc Exp Biol and Med. 1981;167:78–82. doi: 10.3181/00379727-167-41128. [DOI] [PubMed] [Google Scholar]
- 22.Paxinos G, Watson C. The rat brain in stereotaxic coordinates. 4. London: Academic; 1998. [DOI] [PubMed] [Google Scholar]
- 23.Freeman ME, Sterman JR. Ovarian steroid modulation of prolactin surges in cervically stimulated ovariectomized rats. Endocrinology. 1978;102:1915–1920. doi: 10.1210/endo-102-6-1915. [DOI] [PubMed] [Google Scholar]
- 24.Gerhold LM, Sellix MT, Freeman ME. Antagonism of vasoactive intestinal peptide mRNA in the suprachiasmatic nucleus disrupts the rhythm of FRAs expression in neuroendocrine dopaminergic neurons. J Comp Neurol. 2002;450:135–143. doi: 10.1002/cne.10307. [DOI] [PubMed] [Google Scholar]
- 25.Watson RE, Jr, Wiegand SJ, Clough RW, Hoffman GE. Use of cryoprotectant to maintain long-term peptide immunoreactivity and tissue morphology. Peptides. 1986;7:155–159. doi: 10.1016/0196-9781(86)90076-8. [DOI] [PubMed] [Google Scholar]
- 26.Gerhold LM, Horvath TL, Freeman ME. Vasoactive intestinal peptide fibers innervate neuroendocrine dopaminergic neurons. Brain Res. 2001;919:48–56. doi: 10.1016/s0006-8993(01)02993-6. [DOI] [PubMed] [Google Scholar]
- 27.Turgeon JL, Shyamala G, Waring DW. PR localization and anterior pituitary cell populations in vitro in ovariectomized wild-type and PR-knockout mice. Endocrinology. 2001;142:4479–4485. doi: 10.1210/endo.142.10.8425. [DOI] [PubMed] [Google Scholar]
- 28.Dalcík H, Phelps CJ. Median eminence-afferent vasoactive intestinal peptide (VIP) neurons in the hypothalamus: localization by simultaneous tract tracing and immunocytochemistry. Peptides. 1993;14:1059–1566. doi: 10.1016/0196-9781(93)90087-w. [DOI] [PubMed] [Google Scholar]
- 29.Horvath TL. Suprachiasmatic efferents avoid phenestrated capillaries but innervate neuroendocrine cells, including those producing dopamine. Endocrinology. 1997;138:1312–1320. doi: 10.1210/endo.138.3.4976. [DOI] [PubMed] [Google Scholar]
- 30.Luther JA, Daftary SS, Boudaba C, Gould GC, Halmos KC, Tasker JG. Neurosecretory and non-neurosecretory parvocellular neurones of the hypothalamic paraventricular nucleus express distinct electrophysiological properties. J Neuroendocrinol. 2002;14:929–932. doi: 10.1046/j.1365-2826.2002.00867.x. [DOI] [PubMed] [Google Scholar]
- 31.Livingstone JD, Lerant A, Freeman ME. Ovarian steroids modulate responsiveness to dopamine and expression of G-proteins in lactotropes. Neuroendocrinology. 1998;68:172–179. doi: 10.1159/000054363. [DOI] [PubMed] [Google Scholar]
- 32.Velkeniers B, Hooghe-Peters EL, Hooghe R, Belayew A, Smets G, Claeys A, Robberecht P, Vanhaelst L. Prolactin cell subpopulations separated on discontinuous Percoll gradient: an immunocytochemical, biochemical, and physiological characterization. Endocrinology. 1988;123:1619–1630. doi: 10.1210/endo-123-3-1619. [DOI] [PubMed] [Google Scholar]
- 33.Gershengorn MC, Osman R. Molecular and cellular biology of thyrotropin-releasing hormone receptors. Physiol Rev. 1996;76:175–191. doi: 10.1152/physrev.1996.76.1.175. [DOI] [PubMed] [Google Scholar]
- 34.Ashworth R, Hinkle PM. Thyrotropin-releasing hormone-induced intracellular calcium responses in individual rat lactotrophs and thyrotrophs. Endocrinology. 1996;137:5205–5212. doi: 10.1210/endo.137.12.8940336. [DOI] [PubMed] [Google Scholar]
- 35.Burris TP, Freeman ME. Low concentrations of dopamine increase cytosolic calcium in lactotrophs. Endocrinology. 1993;133:63–68. doi: 10.1210/endo.133.1.8391429. [DOI] [PubMed] [Google Scholar]
- 36.Ermentrout B. Simulating, analyzing and animating dynamical systems: A guide to XPPAUT for researchers and students. Society for Industrial and Applied Mathematics; Philadelphia: 2002. [Google Scholar]
- 37.Huang CY, Kuo WW, Tsai TP, Wu DJ, Hsieh YS, Wang PS, Cheng CK, Liu JY. Prolactin secretion and intracellular Ca(2+) change in rat lactotroph subpopulations stimulated by thyrotropin-releasing hormone. J Cell Biochem. 2002;87:126–132. doi: 10.1002/jcb.10212. [DOI] [PubMed] [Google Scholar]
- 38.DeMaria JE, Nagy GM, Freeman ME. Immunoneutralization of prolactin prevents stimulatory feedback of prolactin on hypothalamic neuroendocrine dopaminergic neurons. Endocrine. 2000;12:333–337. doi: 10.1385/ENDO:12:3:333. [DOI] [PubMed] [Google Scholar]
- 39.Lerant AA, DeMaria JE, Freeman ME. Decreased expression of fos-related antigens (FRAs) in the hypothalamic dopaminergic neurons after immunoneutralization of endogenous prolactin. Endocrine. 2001;16:181–187. doi: 10.1385/ENDO:16:3:181. [DOI] [PubMed] [Google Scholar]
- 40.Samson WK, Lumpkin MD, McCann SM. Evidence for a physiological role for oxytocin in the control of prolactin secretion. Endocrinology. 1986;119:554–550. doi: 10.1210/endo-119-2-554. [DOI] [PubMed] [Google Scholar]
- 41.Carew MA, Mason WT. Control of Ca2+ entry into rat lactotrophs by thyrotrophin-releasing hormone. J Physiol. 1995;486:349–360. doi: 10.1113/jphysiol.1995.sp020817. [DOI] [PMC free article] [PubMed] [Google Scholar]
- 42.Fomina AF, Levitan ES. Three phases of TRH-induced facilitation of exocytosis by single lactotrophs. J Neurosci. 1995;15:4982–4991. doi: 10.1523/JNEUROSCI.15-07-04982.1995. [DOI] [PMC free article] [PubMed] [Google Scholar]
- 43.Castaño JP, Kineman RD, Frawley LS. Dynamic monitoring and quantification of gene expression in single, living cells: a molecular basis for secretory cell heterogeneity. Mol Endocrinol. 1996;10:599–605. doi: 10.1210/mend.10.5.8732690. [DOI] [PubMed] [Google Scholar]
- 44.Zimmerman EA, Nilaver G, Hou-Yu A, Silverman AJ. Vasopressinergic and oxytocinergic pathways in the central nervous system. Fed Proc. 1984;43:91–96. [PubMed] [Google Scholar]
- 45.Swanson LW, Sawchenko PE. Hypothalamic integration: organization of the paraventricular and supraoptic nuclei. Annu Rev Neurosci. 1983;6:269–324. doi: 10.1146/annurev.ne.06.030183.001413. [DOI] [PubMed] [Google Scholar]
- 46.Sarkar DK, Gibbs DM. Cyclic variation of oxytocin in the blood of pituitary portal vessels of rats. Neuroendocrinology. 1984;39:481–483. doi: 10.1159/000124024. [DOI] [PubMed] [Google Scholar]
- 47.Bethea CL, Neill JD. Prolactin secretion after cervical stimulation of rats maintained in constant dark or constant light. Endocrinology. 1979;104:870–876. doi: 10.1210/endo-104-4-870. [DOI] [PubMed] [Google Scholar]
- 48.Yogev L, Terkel J. Effects of photoperiod, absence of photic cues, and suprachiasmatic nucleus lesions on nocturnal prolactin surges in pregnant and pseudopregnant rats. Neroendocrinology. 1980;31:26–33. doi: 10.1159/000123046. [DOI] [PubMed] [Google Scholar]
- 49.Buijs RM, Markman M, Nunes-Cardoso B, Hou YX, Shinn S. Projections of the suprachiasmatic nucleus to stress-related areas in the rat hypothalamus: a light and electron microscopic study. J Comp Neurol. 1993;335:42–54. doi: 10.1002/cne.903350104. [DOI] [PubMed] [Google Scholar]
- 50.Smith MS, Freeman ME, Neill JD. The control of progesterone secretion during the estrous cycle and early pseudopregnancy in the rat: prolactin, gonadotropin and steroid levels associated with rescue of the corpus luteum of pseudopregnancy. Endocrinology. 1975;96:219–226. doi: 10.1210/endo-96-1-219. [DOI] [PubMed] [Google Scholar]