

Abstract
Purpose
To comprehensively quantify through daily, serial measures changes in knee laxity as a function of changing sex-hormone levels across one complete menstrual cycle.
Methods
Twenty-five females, 18–30 yr, body mass index ≤ 30, who reported normal menstrual cycles (28–32 d) over the past 6 months participated. Participants were tested daily across one complete menstrual cycle; 5–7 cc of venous blood were withdrawn to assay serum levels of estradiol, progesterone, and testosterone. Knee laxity was measured as the amount of anterior tibial displacement at 133 N, using a standard knee arthrometer. To evaluate the relationship of knee laxity to changes in sex hormone concentrations, a multiple linear regression model with the possibility of a time delay was performed on each individual subject and the group as a whole.
Results
Individual regression equations revealed an average of 63% of the variance in knee laxity was explained by the three hormones and their interactions. All three hormones significantly contributed to the prediction equation, and the amount of variance explained was substantially greater when a time delay was considered. On average, knee laxity changed approximately 3, 4, and 4.5 d after changes in estradiol, progesterone, and testosterone, respectively. When females were analyzed as a group, only 8% of the variance in knee laxity was explained by sex-hormones levels.
Conclusion
Changes in sex hormones mediate changes in knee laxity across the menstrual cycle. However, the strength of this relationship, the relative contribution of each hormone, and the associated time delay are highly variable between women. This individual variability is consistent with the variability in menstrual cycle characteristics among women.
Keywords: LINEAR REGRESSION, ESTRADIOL, PROGESTERONE, TESTOSTERONE, JOINT BEHAVIOR
Sex hormones appear to influence the strain behavior (4,9,24) and metabolism (30) of the human anterior cruciate ligament (ACL), and the fluctuation in these hormones across the menstrual cycle has been implicated as a potential risk factor for ACL injury in females (25,29). Males and females differ dramatically both in the type and level of circulating sex hormones. Females are also exposed to rhythmic fluctuations in endogenous hormones, with both the absolute levels of estrogen and progesterone and their ratio to each other varying considerably during the course of the menstrual cycle. Although changes in testosterone levels across the menstrual cycle have garnered less attention, this hormone also fluctuates across the menstrual cycle and can vary by phase (3,14).
Research suggests that estrogen and progesterone may influence collagen structure and metabolism. Estrogen and progesterone receptors have been identified on the human ACL (13), and there is evidence to suggest that when the ligament is exposed to increased estrogen levels, there is a dose dependent antagonist effect on fibroblast proliferation and procollagen synthesis that is attenuated within 3–7 d after administration (30). Although not specific to the human ACL, other studies have also noted profound effects of estrogen and progesterone on collagen properties in both animal and human models. These effects include both increased collagen synthesis and degradation (5,6,8), increased elastin content (23), and decreased total collagen and protein content, fiber diameter, and density (1,7) with exposure to estrogen. The interaction of estrogen with progesterone appears to enhance these effects, whereas progesterone or testosterone alone attenuates these effects (1,7). Collectively, these findings suggest the metabolism and structure of collagen tissues may be significantly altered when exposed to varying concentrations of sex hormones.
Based on these basic science investigations, research in recent years has examined the influence of sex specific hormones on knee joint laxity (anterior knee joint displacement with an anterior directed force) via instrumented arthrometry in pregnant (2,21) and normal menstruating females (4,9) at a macroscopic level. Using a standard knee arthrometer to apply anterior-directed loads of 89 N and 133 N to displace the tibia relative to the femur, significant increases in knee laxity during the peri-ovulatory and luteal phases, when compared with menses (i.e., the early follicular phase), have been found (4). Similar increases in the peri-ovulatory and luteal phases compared with menses, measuring knee laxity and serum estrogen and progesterone levels on days 1, 10–13, and 20–23 in seven subjects have also been reported (9). Profound but transient increases in joint laxity have also been demonstrated during pregnancy (2,21), when levels of estrogen and progesterone increased steadily from 6 to 42 wk (27). Although the hormone relaxin is also present at higher concentrations during pregnancy, no correlation was found between joint laxity and relaxin levels (21). Relaxin levels were highest in the first trimester and decreased in each trimester following, whereas knee laxity increased an average of 105%, 128%, and 170% in the first, second, and third trimesters, respectively. Although it is appreciated that the hormonal milieu is substantially different during pregnancy, these studies lend additional support to a relationship between female sex hormones and ligament behavior.
What is yet unclear from these studies is the immediacy and duration of hormonal effects on knee joint laxity, or the relative contribution of each hormone to changes in knee joint laxity. Studies to date provide only limited “snap shot” measurements of knee laxity at various general phases in the menstrual cycle or pregnancy term and have not attempted to relate changes in knee laxity to changes in specific hormones. For example, whether findings of increased laxity in the luteal phase represents a delayed effect from estrogen surges at ovulation that remained elevated into the luteal phase versus an interactive effect between estrogen and progesterone as they rise together in the early luteal phase cannot be determined (9). Considering evidence that progesterone may enhance estrogen’s effect on reducing collagen content in capsular tissues (1,7), and findings that demonstrate greater increases in knee laxity during the third trimester of pregnancy when progesterone levels are nine times greater than estrogen (21), it is necessary to consider the relative phasing and levels of both hormones.
Moreover, pooling data by phase makes it difficult to determine the relative phasing and timing of changes in knee laxity with changes in hormone concentrations. Appreciating that estrogen levels can change dramatically within a 24-h period, daily measures, particularly around ovulation and the early luteal phase, are desirable. Using particular days of the cycle to estimate day of ovulation or cycle phase are likely to be inaccurate and cause considerable variability in the data. Studies involving healthy, premenopausal young women have reported regular cycle lengths ranging from 21 to 38 d (3,11,15) and the day of ovulation ranging from 10 to 23 d (11,19,26).
Also absent from these studies is the examination of endogenous testosterone levels. Although females have significantly lower testosterone levels than males, small but significant fluctuations in testosterone have been noted across the cycle (3,14). Testosterone levels have also been shown to influence the lengths of the follicular and luteal phases of the menstrual cycle (26) and can vary in women as a function of obesity (28) and hyperandrogenism (26). Considering that males have nearly 10-fold higher levels of serum testosterone, it is plausible that higher absolute or transient increases in testosterone levels may confound the potential relationship between estrogen, progesterone and knee laxity.
In summary, much is yet unknown about the relationship between changes in sex hormone levels across the cycle and corresponding changes in knee joint behavior. In an effort to better understand this relationship, our purpose was to comprehensively quantify through daily, serial measures changes in knee laxity as a function of daily changes in sex hormone levels across one complete menstrual cycle. We hypothesized that 1) changes in knee laxity would occur at an identifiable time delay after a rise in hormone levels; 2) estradiol and progesterone combined would explain more of the variance in knee laxity than either hormone alone and that testosterone levels would have a negligible or negative effect on knee laxity changes; and 3) consistent with the variability in individual cycle characteristic between females, the relationship between hormone concentrations, and knee laxity would also be variable between women.
METHODS
Subjects
Twenty-five nonathletic female subjects, between the ages of 18 and 30, with a body mass index (BMI = weight/height2) less than or equal to 30, who reported normal menstrual cycles (28–32 d) over the past 6 months were recruited to participate. A sample size of 20 subjects was determined a priori though pilot analysis. However, given the daily data collection needs of this project, 25 subjects were recruited to offset the potential for subject drop out. Inclusion criteria were no history of pregnancy, no use of oral contraceptives or other hormone-stimulating medications for 6 months, nonsmoking behavior, two healthy knees with no prior history of joint injury or surgery, no medical conditions affecting the connective tissue (e.g., Marfan’s Syndrome, Ehlers-Danlos disease, rheumatoid arthritis, etc.), and physical activity limited to 7 h or less per week. Participants were excluded from the analyses if they experienced an anovulatory cycle or missed three or more consecutive days of testing. An anovulatory cycle was determined when the ovulation kit did not test positive or progesterone levels did not rise to 3 ng·mL−1 (10,22). All subjects were informed of the study and associated risks, and signed an informed consent approved by the University Health System’s Human Investigation Committee. The study also received approval from the University’s General Clinical Research Center’s Research Advisory Committee.
Procedures
At the beginning of the study, participants were provided with a commercially available ovulation kit [CVS One Step Ovulation Predictor (Sensitivity 20 mIU·mL−1 LH, accuracy 99%); CVS Corporation, Woon-socket, RI] to use beginning on day 8 of their menstrual cycle and were asked to report to the research study coordinator the day the test became positive. Day of ovulation was confirmed to: 1) ensure a normal, ovulatory menstrual cycle had occurred; 2) to provide a common reference point by which to counterbalance participants and to mark the beginning and ending of data collection; and 3) to provide indirect confirmation that female subjects were not pregnant.
All testing was performed in the University’s General Clinical Research Center. Participants were tested daily across one complete menstrual cycle, undergoing the same data collection procedures on each day of testing. To control for diurnal fluctuations in hormone levels, testing was performed at the same general time of day (8:00 a.m. to 12:00 p.m.) for all subjects. Participants were counterbalanced to begin and end data collection either at ovulation (ovulation kit detecting the luteinizing hormone (LH) surge), or the onset of menses (self-report of the first day of menstrual bleeding). The counterbalance was assigned by an independent investigator to blind the test examiner to the participant’s time in the cycle.
Upon arrival each day, participants had 5–7 cc of venous blood withdrawn from which to assay serum levels of estradiol (pg·mL−1), progesterone (ng·mL−1), and testosterone (ng·mL−1). Estradiol was analyzed using a double-antibody RIA Assay (DSL-4400; Diagnostic Systems Laboratories, Webster TX). Progesterone and testosterone levels were analyzed using chemiluminescence assays (Coat-A-count; Diagnostic Products Corporation, Los Angeles, CA). Given our desire and need to detect day-to-day changes in our data, we ran quality control checks at the front and back end of each estradiol assay to determine measurement precision. Mean percent coefficient of variations (%CV) were 8.1% for intra-assay (range 3.9–14.1%) and 8.1% for interassay (range 2.8–16.3%) comparisons. As further confirmation of acceptable measurement repeatability, estradiol levels for five participants were analyzed in duplicate for all test days and found to be quite consistent (ICC 2,1 = 0.99 for all subjects; SEM = 1.0–1.6). Percent CV for progesterone and testosterone were similar, with progesterone ranging from 3.4 to 10.0% for intra-assay and 3.8 to 12.0% for interassay, whereas testosterone ranged from 4.5 to 11.3% for intra-assay and 5.2 to 13.8% for interassay.
Knee laxity was defined as the amount of anterior tibial displacement at 133 N, measured by a KT 2000™ knee arthrometer (MEDmetric® Corp., San Diego, CA). Subjects were positioned per manufacturer’s guidelines in supine with a thigh support placed just proximal to the popliteal fossa to support the subject’s knee in 25° of flexion. Their ankles were placed in the manufacturer provided foot cradle, and a Velcro strap was placed around the subject’s thighs to control rotation of the lower extremity. Once positioned, the KT-2000™ was applied to the anterior tibia of the lower extremity (side counterbalanced between participants) in proper alignment with the subject’s joint line per manufacturer’s instructions. Participants were instructed to relax the leg muscles and an anterior-to-posterior directed force was applied to the anterior tibia to identify a stable neutral point from which measures were based. Using consistent pressure over the patella stabilizing plate, an anteriorly directed force just over 133 N was then applied. A bubble level affixed to the device insured a direct anterior pull was achieved for each trial. Five trials were collected on each day of testing, and the average of the middle three trials was recorded as the participant’s knee laxity measure. The first trial was used as a “conditioning” trial and a fifth trial was collected and used only in the rare event of a device malfunction or loss of data of one of the middle three trials. Although we also obtained displacement values at 46 N and 90 N, preliminary graphical and statistical comparisons of knee laxity changes between these measures and 133 N confirmed cyclical changes were not force dependent. Hence, laxity at 133 N was chosen as the criterion variable for this study, as this measure is most commonly reported clinically and in the literature, allowing closer comparisons to previous works.
A single investigator performed the majority of knee laxity measures throughout the study. However, because of the daily data collection demands of this study, and the restriction of testing to the morning hours, a second investigator was also trained to perform knee laxity measures when the primary tester was unavailable. Except for isolated cases, the second tester was used primarily during the course of one academic semester, due to a schedule conflict 2 d a week for the primary tester. Hence, data on the last 17 subjects were obtained by two investigators, with the second tester collecting data on Tuesdays and Thursdays. To limit the effects of measurement variation between testers, both testers participated in extensive pilot testing before actual data collection to establish acceptable intertester and intratester reliability. After a 2-wk period of practice and training, each tester completed two sets of five trials on two separate days, with the participant removed and repositioned for each test set (counterbalanced). The mean of the middle three trials obtained from each tester and test day were used for data analysis. Mean absolute knee laxity values at 133 N for day 1 versus day 2 were 4.36 ± 1.72 versus 4.42 ± 1.64 mm (tester 1) and 5.01 ± 1.61 versus 5.10 ± 2.07 mm (tester 2). Reliability estimates were calculated using Interclass correlation formula 2,k (ICC (2,k)) and the SEM. Results revealed the measures obtained at 133 N were quite consistent both within [ICC (2,k) = 0.97, SEM = 0.38 (T1); ICC (2,k) = 0.95, SEM = 0.38 mm (T2)] and between (ICC (2,k) = 0.92, SEM = 0.50) the primary and secondary testers (17). These data also support our ability to detect changes in knee laxity of 0.08–1.0 mm (95% confidence interval) within subjects as a function of changes in hormone levels.
Data analysis
Data on hormone concentrations (estradiol, progesterone, testosterone) and anterior knee laxity at 133 N were recorded for each testing day. To examine the relationship between changes in knee laxity to changes in hormone concentrations, a series of multiple linear regression models using hormone concentrations as the predictor variables and knee laxity as the criterion variable were performed. To test the hypothesis that changes in knee laxity do not occur immediately, but at an identifiable time delay after a change in hormone concentrations, the multiple linear regression model was computed over a series of time shifts ranging from 0 to 8 d. The complete equation for this model (i.e., including all variables and interactions), using knee laxity as the criterion measure of interest, was as follows:
where each of the hormones was a function of a time shift (t−Δt) relative to knee laxity, and A–H represented the constants for each variable. By allowing the hormone data to shift forward 0–8 d relative to the knee laxity values obtained on the same day, we identified any time delay (± its SE) in changes in knee laxity relative to the change in estradiol, progesterone, and testosterone levels. Therefore, this model allowed us to both compare the magnitude of the relationship between sex hormones and knee laxity across multiple time delays, and to quantify the magnitude of the time delay at which this relationship was the strongest. To accommodate these time shifts, data for each subject were repeated end to end three times. This prevented us from losing any data points at the beginning (hormone concentration values) or end (laxity values) of the cycle once the data were shifted and insured that the regression equation computed for each time shift was based on equivalent data sets.
To test the hypotheses that estradiol and progesterone combined with their interactions would explain more of the variance in knee laxity changes than either hormone alone and that testosterone levels would have a negligible or negative effect on knee laxity changes, we compared simpler models that included: 1) only the main effects for estradiol and 2) only the main effects of estradiol, progesterone, and testosterone with the full regression model previously noted. These models were compared with and without the possibility of a time shift. The inclusion of each hormone is based on the assumption that they are somewhat independent of one another in their mechanisms and actions on connective tissue (1,7) and will each provide unique contributions to the total variance explained.
To determine whether the relationship between hormone concentrations and knee laxity is sufficiently variable between women to warrant individual subject analyses, we compared the results of the individual regression analyses with a group regression analysis that was performed in the same fashion as the individual models but with all subjects entered simultaneously. To allow us to focus primarily on the relationship between the relative changes in each variable across the menstrual cycle, the mean values for each variable was subtracted from each data point within each subject before being entered in the analyses.
RESULTS
Three participants were excluded from the study, one due to voluntary withdrawal, one to an anovulatory cycle, and one due to equipment failure that resulted in more than three consecutive days of missed data collection. Subject demographics for the 22 participants included in the analyses are provided in Table 1. Study compliance for these subjects was excellent, with 15 subjects completing all days of data collection and 7 missing one (N = 6) or two (N = 1) days of data collection.
TABLE 1.
Group demographics.
| Variable | Mean ± SD | Range |
|---|---|---|
| Height (cm) | 163.7 ± 6.1 | 152.0–174.5 |
| Weight (kg) | 65.2 ± 11.5 | 45.4–88.8 |
| BMI (wt·ht−2) | 24.4 ± 3.5 | 18.4–30.0 |
| Age (yr) | 23.0 ± 3.5 | 19.6–30.5 |
| Cycle length (d) | 27.8 ± 2.4 | 24–36 |
| Day of ovulation | 13.9 ± 2.7 | 9–20 |
| Day of 1st estradiol peak (ovulation) | 15.0 ± 3.8 | 8–25 |
| Day of 2nd estradiol peak (luteal) | 21.9 ± 3.1 | 15–27 |
| Day of progesterone rise (>2 ng·mL−1) | 17.4 ± 3.5 | 11–27 |
| Day of progesterone peak | 21.6 ± 3.1 | 15–27 |
| Estradiol at menses (pg·mL−1) | 53.4 ± 10.2 | 33.4–81.6 |
| Peak estradiol (1st peak) (pg·mL−1) | 189.7 ± 53.4 | 85.6–295.0 |
| Peak estradiol (2nd peak) (pg·mL−1) | 143.9 ± 48.7 | 48.2–258.3 |
| Peak progesterone (ng·mL−1) | 14.3 ± 5.8 | 3.6–26.8 |
| Peak testosterone (ng·mL−1) | 68.9 ± 16.7 | 37.0–115.0 |
| Minimum absolute knee laxity values (mm) | 3.7 ± 1.5 | 1.3–7.8 |
| Maximum absolute knee laxity values (mm) | 6.9 ± 1.8 | 4.0–9.7 |
| Magnitude of laxity change (mm) | 3.2 ± 1.1 | 1.5–5.3 |
N = 22.
Time delay between changes in hormone levels and knee laxity
Table 2 shows the variance in knee laxity explained by the hormones was substantially greater in the regression model where a time shift was allowed compared with the model with no time shift, suggesting that any changes in knee laxity in response to changes in serum hormone levels are not immediate, but occur a few days later. Table 3 lists the time shifts (days) that explained the greatest amount of the variance in knee laxity across the cycle for each individual subject and the group as a whole, based on data from the full regression model. The average phase shifts were ~3 d for estradiol, 4 d for progesterone and 4.5 d for testosterone. However, as noted in the table, the range of phase shifts was quite variable between subjects, as was the phase shifts between each hormone within each subject. Figure 1 graphically depicts this time shift in one subject.
TABLE 2.
Comparison of % variance explained (R2) between simple and more complex regression models.
| No Time Shift Allowed
|
Time Shifts Allowed (0–8 d)
|
||||||
|---|---|---|---|---|---|---|---|
| Subject | E Only | E + P + T | E Only | P Only | T Only | E + P + T | EPT + All Interactions |
| 6 | −0.92% | 14.13% | 16.06% | 15.67% | 6.36% | 43.25% | 63.53% |
| 8 | 13.00% | 14.01% | 15.50% | 3.49% | 17.77% | 30.82% | 62.76% |
| 9 | −0.05% | 18.35% | 13.00% | 12.17% | 6.00% | 30.74% | 66.28% |
| 14 | −0.97% | 13.10% | 17.76% | 9.31% | 21.71% | 34.10% | 68.89% |
| 15 | 3.32% | 42.94% | 15.71% | 9.65% | 21.62% | 42.85% | 66.89% |
| 16 | 12.06% | 39.16% | 39.56% | 12.54% | 38.15% | 59.34% | 66.51% |
| 17 | −0.48% | 27.77% | 17.55% | 33.38% | 11.40% | 52.47% | 72.35% |
| 19 | 37.33% | 52.26% | 48.61% | 54.98% | 5.53% | 60.36% | 78.09% |
| 20 | −0.08% | 2.15% | 26.46% | 5.88% | 19.87% | 42.65% | 60.44% |
| 21 | −1.41% | 8.41% | 11.57% | 0.22% | 4.62% | 17.73% | 50.51% |
| 23 | −0.48% | 20.39% | 0.06% | 2.03% | 14.46% | 23.68% | 59.70% |
| 25 | 3.10% | 18.55% | 23.51% | 9.94% | 12.61% | 45.24% | 69.76% |
| 26 | 3.81% | 46.39% | 18.11% | 1.80% | 19.68% | 37.34% | 59.03% |
| 27 | 5.96% | 18.09% | 15.34% | 14.47% | 16.88% | 41.11% | 48.64% |
| 29 | 1.41% | 18.40% | 15.59% | 1.56% | 13.28% | 26.57% | 57.28% |
| 30 | 15.26% | 66.56% | 18.31% | 24.39% | 18.01% | 48.71% | 69.41% |
| 33 | 4.94% | 34.99% | 13.32% | 19.46% | 13.56% | 50.13% | 72.68% |
| 34 | 0.30% | 22.89% | 7.41% | 16.11% | 15.05% | 40.06% | 65.83% |
| 35 | −0.79% | 9.77% | 15.83% | 6.13% | 4.77% | 29.27% | 58.77% |
| 36 | −0.60% | 23.53% | 26.59% | 9.66% | 0.82% | 32.71% | 55.17% |
| 37 | 11.78% | 23.61% | 14.28% | 3.77% | 9.90% | 27.07% | 51.12% |
| 38 | 11.66% | 34.23% | 18.56% | 15.16% | 37.59% | 49.79% | 68.93% |
| Mean | 5.37% | 25.89% | 18.58% | 12.81% | 14.98% | 39.36% | 63.30% |
E, estradiol; P, progesterone; T, testosterone.
TABLE 3.
Time delays for individual and group (N = 22) regression models explaining the greatest amount of variance in knee laxity changes across the menstrual cycle.
| Time Delay (d)
|
|||
|---|---|---|---|
| Subject | E | P | T |
| 6 | 1 | 6 | 4 |
| 8 | 3 | 4 | 8 |
| 9 | 4 | 3 | 6 |
| 14 | 0 | 1 | 3 |
| 15 | 1 | 0 | 2 |
| 16 | 0 | 5 | 1 |
| 17 | 5 | 1 | 7 |
| 19 | 4 | 1 | 2 |
| 20 | 3 | 8 | 4 |
| 21 | 3 | 0 | 4 |
| 23 | 4 | 5 | 4 |
| 25 | 6 | 0 | 2 |
| 26 | 7 | 2 | 7 |
| 27 | 5 | 5 | 3 |
| 29 | 1 | 8 | 4 |
| 30 | 0 | 1 | 3 |
| 33 | 2 | 2 | 8 |
| 34 | 2 | 6 | 8 |
| 35 | 6 | 5 | 8 |
| 36 | 7 | 7 | 1 |
| 37 | 0 | 7 | 5 |
| 38 | 5 | 8 | 6 |
| Mean | 3.1 | 3.9 | 4.5 |
| Group | 3 | 3 | 8 |
FIGURE 1.
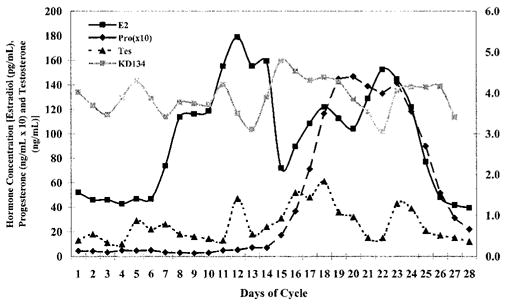
Graphic representation of subject 26, showing a characteristic time delay between change in hormone levels and change in knee joint laxity.
Relationship between hormone concentrations and knee laxity
Our second hypothesis was that estradiol and progesterone combined would explain more of the variance in knee laxity changes than either hormone alone, with testosterone having a negligible or inhibitory effect on knee laxity changes. Table 2 also shows the comparison of variance explained in the primary model compared with each of the simpler models with and without time shifts. Although we intended to explore the role of testosterone and its potential interaction with estradiol and progesterone as a secondary interest, these comparisons revealed that the inclusion of testosterone in the analysis substantially contributed to the variance explained in the data. Given our findings in support of hypotheses 1 and 2, the full regression model with the potential for a time delay was used to determine the relationship between changes in hormone concentrations and changes in knee laxity.
Two primary relational trends were noted in the full regression model, with nine subjects showing one trend and eight subjects showing an opposite trend (Table 4). Subjects 6, 9, 17, 21–25, 27, 33, and 38 predicted knee laxity with the individual hormone coefficients being positive, the two-way interaction coefficients negative, and the three-way interaction coefficient positive. Subjects 8, 15, 16, 20, 34, 35, 36, and 37 predicted knee laxity, with the relationships being exactly opposite.
TABLE 4.
Individual and group regression coefficients and variance explained in knee laxity by changes in estradiol, progesterone, and testosterone across the menstrual cycle.
| Regression Coefficients with Constant (*P < 0.01)
|
|||||||||
|---|---|---|---|---|---|---|---|---|---|
| Subject | R2 | Const | E | P | T | E*P | E*T | P*T | E*P*T |
| 6 | 63.53% | 2.38 | 1.42E−02* | 4.47E−01* | 2.25E−02* | −4.03E−03* | −2.78E−04* | −9.09E−03* | 8.41E−05* |
| 8 | 62.76% | 5.56 | −9.83E−02* | −2.22E+00 | −8.94E−03 | 9.08E−02* | 1.42E−03* | 2.11E−02 | −1.41E−03* |
| 9 | 66.28% | −2.95 | 6.27E−02* | 1.76E+00* | 1.26E−01* | −1.26E−02* | −1.04E−03* | −3.08E−02* | 2.17E−04* |
| 14 | 68.89% | 3.00 | 1.39E−02* | −7.81E−01* | −1.06E−02 | 4.80E−03 | −6.13E−04* | 1.76E−02* | −9.86E−05 |
| 15 | 66.89% | 11.91 | −6.32E−02* | −1.74E+00* | −1.14E−01* | 1.59E−02* | 1.24E−03* | 2.49E−02* | −2.43E−04* |
| 16 | 66.51% | 5.94 | −8.48E−02* | −5.04E+00* | −1.09E−01* | 1.07E−01* | 3.12E−03* | 1.67E−01* | −3.43E−03* |
| 17 | 72.35% | −0.30 | 4.92E−02* | 3.38E+00* | 1.78E−01* | −2.46E−02* | −1.46E−03* | −1.40E−01* | 8.70E−04* |
| 19 | 78.09% | 5.11 | −6.08E−03 | 1.59E+00* | −2.92E−02 | −1.76E−02* | 3.56E−04 | −2.81E−02* | 3.54E−04* |
| 20 | 60.44% | 10.89 | −3.62E−02* | −4.01E−01* | −1.22E−01* | 4.83E−03* | 1.05E−03* | 7.79E−03* | −1.08E−04* |
| 21 | 50.51% | 0.64 | 4.22E−02* | 2.70E−01 | 3.57E−02 | −5.05E−03* | −7.89E−04* | 3.00E−03 | 6.79E−05 |
| 23 | 59.70% | 2.30 | 1.87E−02* | 1.27E+00* | 8.58E−02* | −5.97E−03* | −3.39E−04* | −2.34E−02* | 1.11E−04* |
| 25 | 69.76% | 3.24 | 3.66E−02* | 2.88E+00* | 5.48E−02* | −3.42E−02* | −7.91E−04* | −5.95E−02* | 7.14E−04* |
| 26 | 59.03% | 3.95 | 8.86E−03* | −1.97E−01* | −3.32E−02* | 2.97E−04 | −8.80E−06 | 5.82E−03* | −1.14E−05 |
| 27 | 48.64% | −0.22 | 5.58E−02* | 8.57E−01* | 1.20E−01* | −8.32E−03* | −1.26E−03* | −2.33E−02* | 2.07E−04* |
| 29 | 57.28% | −0.80 | 4.71E−02* | 2.01E−01 | 1.77E−01* | 3.10E−03 | −9.49E−04* | −1.78E−03 | −1.25E−04 |
| 30 | 69.41% | 2.42 | 1.36E−02* | −1.46E+00* | 6.45E−02* | 8.97E−03* | −4.19E−04* | 4.68E−02 | −3.08E−04 |
| 33 | 72.68% | 2.36 | 2.42E−02* | 2.06E+00* | 1.13E−01* | −1.67E−02* | −1.06E−03* | −7.11E−02* | 6.14E−04* |
| 34 | 65.83% | 24.08 | −2.05E−01* | −5.72E+00* | −6.44E−01* | 5.50E−02* | 6.40E−03* | 1.88E−01* | −1.84E−03* |
| 35 | 58.77% | 14.67 | −1.00E−01* | −3.59E+00* | −1.39E−01* | 4.64E−02* | 1.79E−03* | 5.57E−02 | −7.07E−04* |
| 36 | 55.17% | 15.54 | −1.17E−01* | −2.62E+00* | −3.47E−01* | 3.07E−02* | 4.03E−03* | 1.18E−01* | −1.41E−03* |
| 37 | 51.12% | 13.32 | −2.34E−02* | 7.51E−01* | −9.06E−02* | −1.41E−02* | 3.70E−04 | −1.62E−02* | 3.13E−04* |
| 38 | 68.93% | 5.41 | 2.01E−02* | 4.87E−01* | 7.87E−02* | −3.89E−03* | −7.00E−04* | −3.22E−02* | 2.23E−04* |
| Mean | 63.30% | 2.94 | 9.10E−03 | 2.21E−01 | 4.42E−02 | 5.75E−03 | −2.11E−04 | −7.79E−03 | −1.27E−04 |
| Group | 7.60% | 0.01 | 4.19E−03* | −1.28E−02* | 9.35E−03* | −5.80E−05 | 8.84E−05* | −2.39E−04 | −3.44E−05* |
E, estradiol; P, progesterone; T, testosterone.
Significant contribution to the model, P < 0.01.
Of those showing the second trend, unusually large constants (mean laxity values) were observed that suggests a poor regression fit (i.e., the resultant constant was substantially different than the actual mean laxity values for that subject). We then recomputed the regression equation with the constant removed (i.e., essentially subtracting the mean laxity value from each data point), making the intercept “0” for all subjects and focusing only on the value of change from day to day. Table 5 lists the phase shifts and regression coefficients explaining the greatest amount of variance with the constant removed. These results revealed 18 of 22 subjects yielding equations consistent with the trend of individual hormone coefficients being positive, the two-way interaction coefficients negative and the three-way interaction coefficient positive. To confirm the accuracy of the prediction equation and whether removing the constant truly yielded a better fit to the actual data, Figure 2, a and b, compares the prediction equations with and without the constant included for one subject (subject 15) who initially showed a relationship consistent with the opposite trend. Removing the constant (Fig. 2b) clearly yielded a better fit to the corresponding raw data.
TABLE 5.
Individual and group (N = 22) regression model coefficients and phase shifts with constant removed.
| Time Delay (Days)
|
Regression Coefficients with Constant Removed (*P < 0.01)
|
||||||||||
|---|---|---|---|---|---|---|---|---|---|---|---|
| Subject | Variance Explained (R2) | E | P | T | E | P | T | E*P | E*T | P*T | E*P*T |
| 6 | 50.92% | 1 | 1 | 6 | 2.72E−02* | 6.97E−03* | 8.32E−02* | −2.11E−03* | −5.84E−04* | −3.71E−03* | −8.88E−05* |
| 8 | 54.29% | 5 | 1 | 6 | 7.32E−02* | 2.46E+00* | 1.00E−01* | −3.53E−02* | −1.79E−03* | −8.64E−02* | 1.08E−03* |
| 9 | 61.84% | 4 | 3 | 6 | 4.24E−02* | 8.61E−02 | 6.53E−02* | −3.08E−03 | −6.24E−04* | 4.52E−03 | 1.67E−05 |
| 14 | 47.18% | 0 | 1 | 3 | 4.17E−02* | 5.07E−01 | 8.09E−02* | −9.64E−03 | −1.42E−03* | −1.41E−02 | 2.63E−04 |
| 15 | 58.32% | 1 | 0 | 6 | 8.24E−02* | 1.53E+00* | 6.92E−02* | −1.25E−02* | −1.00E−03* | −2.67E−02* | 2.04E−04* |
| 16 | 65.05% | 6 | 0 | 1 | 3.21E−02* | −6.48E−01 | 8.12E−02* | 4.75E−03 | −7.05E−04* | 3.39E−02* | −1.96E−04* |
| 17 | 72.73% | 5 | 1 | 7 | 4.71E−02* | 3.17E+00* | 1.68E−01* | −2.34E−02* | −1.39E−03* | −1.33E−01* | 8.30E−04* |
| 19 | 77.03% | 2 | 0 | 2 | 1.03E−01* | −4.40E−01 | 1.23E−01* | 1.30E−03 | −2.86E−03* | 1.35E−02* | 2.92E−06 |
| 20 | 44.48% | 0 | 1 | 2 | 6.05E−02* | 1.09E+00* | 1.29E−01* | −7.60E−03* | −1.39E−03* | −1.76E−00* | 1.34E−04* |
| 21 | 50.44% | 3 | 0 | 4 | 4.85E−02* | 4.31E−01* | 5.68E−02* | −6.51E−03* | −9.84E−04* | −2.43E−03 | 1.15E−04 |
| 23 | 54.43% | 4 | 5 | 4 | 3.20E−02* | 1.67E+00* | 1.28E−01* | −7.88E−03* | −5.81E−04* | −3.09E−02* | 1.46E−04* |
| 25 | 64.07% | 6 | 0 | 2 | 7.22E−02* | 3.48E+00* | 1.58E−01* | −4.09E−02* | −1.95E−03* | −7.48E−02* | 8.86E−04* |
| 26 | 17.50% | 2 | 7 | 6 | 4.18E−02* | 5.37E−01* | 2.10E−01* | −7.56E−03* | −2.16E−03* | −2.26E−02* | 2.96E−04* |
| 27 | 34.23% | 0 | 0 | 0 | 3.17E−02* | 9.60E−01* | 1.17E−01* | −5.41E−03* | −7.09E−04* | −2.67E−02* | 1.40E−04* |
| 29 | 57.59% | 1 | 8 | 4 | 4.27E−02* | 1.00E−01 | 1.57E−01* | 3.79E−03 | −8.41E−04* | 7.42E−04 | −1.43E−04* |
| 30 | 64.73% | 1 | 0 | 7 | 3.35E−02* | 4.41E+00* | 1.59E−01* | −3.00E−02* | −1.24E−03* | −2.18E−01* | 1.42E−03* |
| 33 | 69.18% | 2 | 2 | 8 | 5.77E−02* | 2.63E+00* | 1.73E−01* | −2.25E−02* | −1.93E−03* | −8.53E−02* | 7.63E−04* |
| 34 | 45.98% | 2 | 5 | 3 | −4.40E−03* | 1.09E+01 | −1.15E−02* | −8.13E−02 | 9.95E−04* | −2.51E−01 | 1.89E−03 |
| 35 | 49.25% | 8 | 2 | 3 | 1.05E−01* | 2.43E+00 | 1.93E−01* | −4.46E−02* | −2.90E−03* | −7.41E−02* | 1.22E−03* |
| 36 | 37.22% | 8 | 0 | 3 | 6.93E−02* | 1.98E+00* | 1.96E−01* | −2.22E−02* | −2.42E−03* | −6.85E−02* | 7.26E−04* |
| 37 | 31.35% | 6 | 5 | 4 | 9.21E−02* | 2.09E+00* | 1.77E−01* | −1.85E−02* | −1.85E−03* | −4.14E−02* | 3.67E−04* |
| 38 | 56.18% | 3 | 4 | 0 | 4.92E−02* | 7.68E−01* | 2.88E−01* | −5.00E−03* | −1.93E−03* | −4.13E−02* | 2.71E−04* |
| Mean | 52.91% | 3.2 | 2.1 | 4.0 | 5.37E−02 | 1.83E+00 | 1.32E−01 | −1.71E−02 | −1.38E−03 | −1.32E−01 | 4.70E−04 |
| Group | 7.63% | 3 | 3 | 8 | 4.22E−03* | −1.34E−02* | 9.35E−03* | −3.86E−05 | 8.81E−05* | −2.11E−04 | −3.45E−05* |
E, estradiol; P, progesterone; T, testosterone.
Significant contribution to the model, P < 0.01.
FIGURE 2.
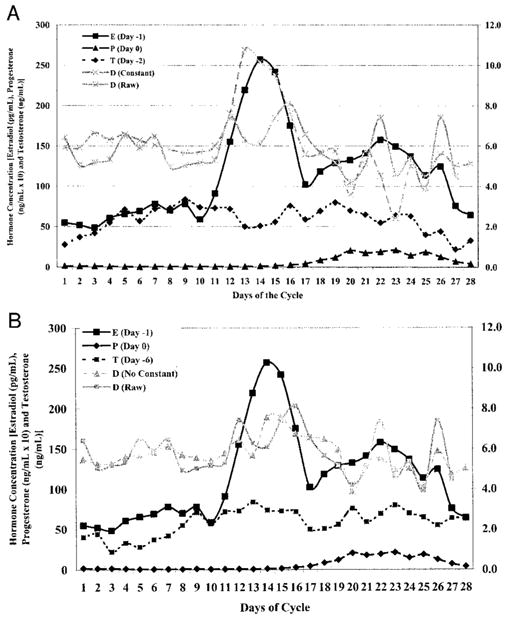
Graphic representation comparing fit of prediction equation to actual raw data collected for subject 15. Figure A compares raw data to prediction equation with constant. Figure B compares raw data to prediction equation with constant = 0.
Comparison of individual versus group results
Examination of the group regression analyses revealed that when data for all subjects were pooled, only ~8% of the variance in knee laxity was explained by the three hormones (see group data, last rows of Tables 4 and 5). The corresponding time shifts for the pooled data were 3 d for both estradiol and progesterone and 8 d for testosterone. Although the interaction of estradiol and testosterone was a significant predictor of knee laxity in the group model, the interaction of estradiol with progesterone, and progesterone with testosterone contributed little to the regression model.
DISCUSSION
The primary findings were that estradiol, progesterone, and testosterone each contribute to changes in knee laxity across the cycle, and that this relationship is stronger when changes in hormone concentrations are compared with changes in knee laxity occurring approximately 3–4 d later. However, the variable time shifts between subjects and the substantially greater variance explained by the regression model for each individual subject compared with the group analysis suggests this relationship is quite variable between subjects.
Relationship between hormone concentrations and knee laxity
Our findings support our hypothesis that estradiol and progesterone combined would explain more of the variance in knee laxity changes than either hormone alone but appear to reject our hypothesis that testosterone would have a negligible or negative effect on knee laxity changes. Considerably more variance in knee laxity was explained when all three hormones and their interaction were included in the model. As the multiple regression analysis is able to account for any correlations that exist between the hormones, these findings would support our assumption that each hormone contributes unique information to the total variance explained in knee laxity. Two primary and opposing trends were revealed in the full regression model when the constant (mean laxity value) remained in the equation. We believe this is likely due to the absolute magnitude of the interactive terms (due to high concentration levels of one or both hormones) that in some cases potentially suppressed the contribution of the individual hormone, yielding an inaccurate prediction equation. This seemed to be corrected once the mean laxity value was removed from the data, forcing the regression model to explain all of the variance in the data. Once the constant was removed, a rather consistent regression model was noted. From these data, it can be seen that, in the majority of cases, knee laxity increases were associated with isolated increases in estradiol, progesterone, and testosterone and with increased concentrations of all three hormones together. Knee laxity decreased when the cross product of estradiol and progesterone, estradiol and testosterone, and progesterone and testosterone increased. However, it is important to note that the value of each regression coefficient is dependent on which other independent variables are in the equation. Hence, the described changes in knee laxity with each of these variables are relative to one another and should not be considered in isolation.
In all cases, both across individual subjects and the group comparison, estradiol, testosterone, and the interaction of estradiol and testosterone were significant predictors in the regression equation (Table 4). Coefficients that included progesterone or its interaction contributed less to the variance explained and were not always significant predictors in the equation. The amount of variance explained by progesterone alone (Table 2) or the relative magnitude of changes in progesterone across the cycle did not appear to be factors in the strength of this relationship. Our findings are consistent with basic science studies comparing progesterone effects on collagen content, density, and elastin content. Progesterone alone was found to have a lesser effect on collagen tissue than either estrogen or testosterone alone (23), with its effect being either positive or negative depending on whether it was administered in combination with estrogen (1,7). Hence, the degree of synchrony between the rise and fall of estrogen and progesterone during the luteal phase may dictate whether the contribution of progesterone has a negative vs positive relationship with changes in knee laxity. Our findings from simpler regression models support this, as increases in knee laxity were always associated with increases in estradiol and testosterone, but could either increase or decrease with progesterone levels, depending on the subject.
A unique finding of this study was the significant contribution of testosterone in predicting knee laxity changes. Studies published to date have only examined changes in knee laxity across the cycle where relative and absolute levels of estrogen and progesterone are expected to change. Although small but significant changes in testosterone levels have been noted across the cycle (3,14), our original intent was to include testosterone simply as a control variable. Appreciating that some women are known to have significantly higher testosterone levels in response to certain physiological characteristics (26,28), we felt this could possibly suppress the effect of estradiol and progesterone and confound our findings. In reality, testosterone had a positive rather than negative relationship with changes in knee laxity, essentially augmenting the relationship. In fact, testosterone, on average, explained more of the variance in knee laxity than progesterone (Table 2).
One must be cautious however not to view this relationship as one of cause and effect. If testosterone were to be a true agonist increasing knee laxity, one would expect males (who have significantly higher concentrations of testosterone) to have greater knee laxity than females. However, research has shown this is not the case (18,20). Whether the strength of the relationship between testosterone and knee laxity is dose dependent or is influenced by the relative presence of other hormones is unclear and requires further study. Although previous reports indicate an interactive effect of these competing sex hormones when present together (1,7,23), these investigations did not specifically evaluate the interaction of estradiol and testosterone in combination. Finally, as estradiol is metabolized to testosterone in peripheral tissues via the enzyme aromatase (16), it is difficult to completely separate the two hormones. However, data from the regression model suggest that they are at least somewhat independent in their actions, as they each contributed significantly to the model once their co-linearity had been accounted for. Further study is needed to clarify the interactive and dose dependent effect of testosterone as well as that of progesterone on knee laxity.
Time delay between changes in hormone levels and knee laxity
Our findings support our hypothesis that the relationship between sex hormones and knee laxity is stronger when a time delay is considered. Although the average time delay was 3–4 d, the actual time delay was quite variable between the females in this study (Table 3). Qualitative inspection of the data failed to reveal any readily apparent observations to explain the individual variability in the time delay between the rise and fall of the three hormones and knee laxity. Because of the number of variables that are changing at any one time in the cycle, it was difficult to identify any one factor or group of factors that might explain this variability. However, we suspected that the relative change in concentration levels across the cycle, as well as the timing of change in one hormone relative to another, were likely factors contributing to these variations. Hence, we followed this qualitative assessment with an exploratory post hoc multivariate linear regression, and found that 75% of the variance in the estradiol phase shift was explained by the length of the follicular phase and the absolute levels of estradiol and progesterone. Essentially, the time delay between changes in estradiol levels and changes in knee laxity was greater (identified by an increasing positive shift in Table 3) in subjects who had a longer follicular phase, higher mean levels of estradiol and progesterone, and lower peak estradiol levels. In other words, knee laxity was slower to respond when there were less dramatic changes in estradiol levels. This would seem reasonable given the positive relationship between estradiol and knee laxity in the individual regression models.
Although these observations are exploratory in nature and are presented for descriptive purposes only, they once again suggest that multiple factors contribute to this variable relationship between women and the need for further inquiry in this area. These findings also reinforce the limitation of using a specific day or range of days (e.g., days 10–14 for ovulation, days 14–28 for luteal phase) to represent the same time point or “phase” in the cycle for all women. We suggest a more accurate way to compare physiological changes across menstrual cycle phases in future studies is to use a time-dependent factor relative to when a particular hormone rises and falls.
Intersubject variability
Comparison of the individual and group regression model supports our third hypothesis, that the relationship between hormone concentrations and knee laxity is quite variable between women. Consistent with previous literature (11), females in this study varied considerably in the length of their cycle (both follicular and luteal phases), as well as the hormone phasing and absolute changes in hormone levels across their cycle (Table 1). Given this variability, it is not surprising that the range of phase shifts and regression coefficients corresponding to each subject were also variable (Tables 3–5). We were surprised to find, however, the variable contribution of each hormone to changes in knee laxity. In some cases the variance in knee laxity explained by the three hormones was fairly equal, whereas in other cases a single hormone would predominate (Table 2). Still other cases showed very weak relationships between knee laxity and all three hormones, until the interactions of these hormones were also considered. These findings once again demonstrate the considerable variability among women and the complex relationship that exists between sex hormones and changes in knee joint laxity.
Another important clinical finding of this study is that not all women demonstrated the same degree of knee laxity change across the cycle. Whereas some subjects had a 4- to 5-mm increase in knee laxity across the cycle, other subjects showed little or no change. We believe this intersubject variance is again due to the individual variability in menstrual cycle characteristics, relative to both the concentration and timing of circulating sex hormones as well as the variability of each individual’s response to sex hormone concentrations. Should sex hormones ultimately be linked to anterior cruciate ligament injury risk, these findings suggest this may represent a variable risk factor among women.
Clinical relevance
Our findings support the influence of sex hormones on biomechanical properties affecting knee joint laxity. Sufficient evidence now exists that women generally have greater knee joint laxity than males (18,20) and that transient increases in knee laxity occur in women across the menstrual cycle as a function of changing hormone levels. When considering the results of the regression model, our findings would suggest that the continued increase in knee laxity from the peri-ovulatory to luteal phase of the menstrual cycle found in previous studies (4,9) may be more a function of a delayed response to the initial estradiol rise than an interactive effect with progesterone. Hence, future studies should consider less important the hormonal environment at the time of measurement or injury but rather focus more so on the hormonal milieu during the preceding 4–7 d.
What remains unknown is the consequence of these transient increases in knee laxity on neuromuscular and biomechanical function of the knee and subsequent injury risk. Given the biological and morphological changes in collagen that have been previously described (1,7,30), increased knee laxity may represent a substantial alteration of the mechanical properties of the ACL when exposed to large fluctuations in hormone levels, rendering the collagen tissue more compliant and susceptible to tensile failure and injury. This is supported by work that has found estrogen to alter the failure load of the ACL (24) and that ACL injury risk may be cycle dependent (25,29).
To elucidate the contribution of sex hormones and knee laxity to ACL injury risk, future studies should begin to explore the consequence of hormone-mediated changes in knee laxity on neuromuscular and biomechanical function of the lower extremity. Unfortunately, the considerable intersubject variability in the relationship between sex hormones and knee laxity presents substantial challenges to exploring this consequence. The variable contribution of each hormone as well as the variable time shifts associated with these hormones makes it difficult to predict with certainty when knee laxity will be at its minimum and maximum across the menstrual cycle. Although knee laxity generally increases in the postovulatory/early luteal phase of the menstrual cycle, this increase can be rather transient and short lived. Moreover, we often observed a second transient increase in knee laxity near the end of the luteal phase and start of menses, presumably a delayed response to the second rise in estradiol levels in the mid-luteal phase (see Figs. 1 and 2). As knee laxity appears to transition both in the postovulatory and late luteal phases of the cycle, this may explain in part what some may consider contradictory findings of increased injury risk in both the peri-ovulatory (29) and early menstrual (25) phases of the cycle. Future investigators should consider expanding their range of time measurements to capture the end of the cycle characteristics as well.
Limitations
Collecting data on a daily basis across one complete menstrual cycle is not without challenges. The potential for subject attrition, missed days due to illness and holiday, and equipment failure in the course of the study is not trivial. Even with these challenges, we were able to obtain near complete data on over 85% of our subjects. Although the information gained from these subjects has yielded considerable insight regarding the relationship between changes in hormone levels and knee joint behavior, it is not without limitations. An unavoidable limitation in a study of this magnitude was the need for two testers to obtain laxity measures, which may introduce more measurement error than a single tester. Although we made every effort to extensively train both testers and confirm acceptable intra- and intertester reliability, some variance between testers was noted. Ideally, we would have had one tester collect all measurements on a single subject, but the daily data collection needs of this project essentially made this impossible. Although this may have introduced greater error variance in the data, the fact that consistent trends were noted in our findings suggests this concern may be minimal.
A second acknowledged limitation to this study is the end-to-end data procedure used in our analyses to accommodate the phase shifts. Had we not performed this procedure, we would have essentially lost the knee laxity data for the first 8 d of the cycle (i.e., menses) once the hormone data was shifted. However, placing each subject’s data set end-to-end assumes that the preceding and following menstrual cycles are consistent, and may have reduced the accuracy of the prediction equation, particularly in regard to the time delay characteristics. Although cycle variability is substantially less within women than between women (12), cycle-to-cycle variations do exist. The only way to have truly determined cycle length would have been to measure daily samples for 3 months (before, during, and after), which would have been prohibitive, both in terms of inconvenience to the subjects and cost. Future studies wishing to replicate these findings should collect data for a sufficient number of days preceding and following the cycle of interest to accommodate the desired range of time shifts. However, the need to collect additional days of data poses further challenges to confining data collection to a single tester.
Footnotes
This research was supported by NIAMS/NIH RO3 AR 47178, and in part by a grant to the University of Virginia, General Clinical Research Center, NIH MO1 RR00847. Support was also provided by NICHD/NIH through cooperative agreement [U54 HD28934] as part of the Specialized Cooperative Centers Program in Reproductive Research.
References
- 1.Abubaker AO, Hebda PC, Gunsolley JN. Effects of sex hormones on protein and collagen content of the temporomandibular joint disc of the rat. J Oral Maxillofac Surg. 1996;54:721–727. doi: 10.1016/s0278-2391(96)90690-4. [DOI] [PubMed] [Google Scholar]
- 2.Charlton WPH, Coslett-Charlton LM, Cic-cotti MG. Correlation of estradiol in pregnancy and anterior cruciate ligament laxity. Clin Orthop Relat Res. 2001;1:165–170. doi: 10.1097/00003086-200106000-00022. [DOI] [PubMed] [Google Scholar]
- 3.Dawood MY, Saxena BB. Plasma testosterone and dihydrotestosterone in ovulatory and anovulatory cycles. Am J Obstet Gynecol. 1976;126:430–435. doi: 10.1016/0002-9378(76)90632-3. [DOI] [PubMed] [Google Scholar]
- 4.Deie M, Sakamaki Y, Sumen Y, Urabe Y, Ikuta Y. Anterior knee laxity in young women varies with their menstrual cycle. Int Orthop. 2002;26:154–156. doi: 10.1007/s00264-001-0326-0. [DOI] [PMC free article] [PubMed] [Google Scholar]
- 5.Dyer R, Sodek J, Heersche JM. The effect of 17 B-Estradiol on collagen and noncollagenous protein synthesis in the uterus and some periodontal tissues. Endocrinology. 1980;107:1014–1021. doi: 10.1210/endo-107-4-1014. [DOI] [PubMed] [Google Scholar]
- 6.Fischer GM. Comparison of collagen dynamics in different tissues under the influence of estradiol. Endocrinology. 1973;93:1216–1218. doi: 10.1210/endo-93-5-1216. [DOI] [PubMed] [Google Scholar]
- 7.Hama H, Yamamuro T, Takeda T. Experimental studies on connective tissue of the capsular ligament: influences of aging and sex hormones. Acta Orthop Scand. 1976;47:473–479. doi: 10.3109/17453677608988723. [DOI] [PubMed] [Google Scholar]
- 8.Hassager C, Jensen LT, Podenphant J, Riis BJ, Christiansen C. Collage synthesis in postmenopausal women during therapy with anabolic steroid or female sex hormones. Metabolism. 1990;39:1167–1169. doi: 10.1016/0026-0495(90)90089-u. [DOI] [PubMed] [Google Scholar]
- 9.Heitz NA. Hormonal changes throughout the menstrual cycle and increased anterior cruciate ligament laxity in females. J Athl Train. 1999;343:144–149. [PMC free article] [PubMed] [Google Scholar]
- 10.Israel R, Mishell DR, Stone SC, Thorneycroft IH, Moyer DL. Single luteal phase serum progesterone assay as an indicator of ovulation. Am J Obstet Gynecol. 1972;112:1043–1046. doi: 10.1016/0002-9378(72)90178-0. [DOI] [PubMed] [Google Scholar]
- 11.Landgren BM, Unden AL, Deczfalusy E. Hormonal profile of the cycle in 68 normal menstruating women. Acta Endocrinol. 1980;94:89–98. doi: 10.1530/acta.0.0940089. [DOI] [PubMed] [Google Scholar]
- 12.Lenton EA, Lawrence GF, Coleman RA, Cooke ID. Individual variation in gonadotropin and steroid concentrations and in the lengths of the follicular and luteal phases in women with regular menstrual cycles. Clin Reprod Fertil. 1983;2:143–150. [PubMed] [Google Scholar]
- 13.Liu SH, Al-Shaikh RA, Panossian V, Finerman GM. Primary immunolocalization of estrogen and progesterone target cells in the human anterior cruciate ligament. Orthop Res Soc. 1996;14:526–533. doi: 10.1002/jor.1100140405. [DOI] [PubMed] [Google Scholar]
- 14.Mathor MB, Achado SS, Wajchenberg BL, Germek OA. Free plasma testosterone levels during the normal menstrual cycle. J Endrocrinol Invest. 1985;8:437–441. doi: 10.1007/BF03348533. [DOI] [PubMed] [Google Scholar]
- 15.Nestour EL, Marraoui J, Lahlou N, Roger M, Ziegler DD, Bouchard P. Role of estradiol in the rise in follicle-stimulating hormone levels during the luteal-follicular transition. J Clin Endocrinol Metab. 1993;77:439–442. doi: 10.1210/jcem.77.2.8345049. [DOI] [PubMed] [Google Scholar]
- 16.Orth DN, Kovacs WJ. The adrenal cortex. In: Wilson JD, Foster DW, Kronenberg HM, Larsen PR, editors. Williams Textbook of Endocrinology. 9. Philadelphia: W. B. Saunders; 1998. p. 525. [Google Scholar]
- 17.Perrin DH, Shultz SJ, Sander TC, Carcia CR. Reliability of ligament compliance and tibial displacement measures obtained from two knee arthrometers. Med Sci Sports Exerc. 2002;34:S147. [Google Scholar]
- 18.Rosene JM, Fogarty TD. Anterior tibial translation in collegiate athletes with normal anterior cruciate ligament integrity. J Athl Train. 1999;34:93–98. [PMC free article] [PubMed] [Google Scholar]
- 19.Rossmanith WG, Schenkel B, Benz R. Role of androgens in the regulation of the human menstrual cycle. Gynecol Endocrinol. 1994;8:151–159. doi: 10.3109/09513599409072449. [DOI] [PubMed] [Google Scholar]
- 20.Rozzi SL, Lephart SM, Gear WS, Fu FH. Knee joint laxity and neuromuscular characteristics of male and female soccer and basketball players. Am J Sports Med. 1999;27:312–319. doi: 10.1177/03635465990270030801. [DOI] [PubMed] [Google Scholar]
- 21.Schauberger CW, Rooney BL, Goldsmith L, Shenton D, Silva PD, Schaper A. Peripheral joint laxity increases in pregnancy but does not correlate with serum relaxin levels. Am J Obstet Gynecol. 1996;174:667–671. doi: 10.1016/s0002-9378(96)70447-7. [DOI] [PubMed] [Google Scholar]
- 22.Shepard MK, Senturia YD. Comparison of serum progesterone and endometrial biopsy for confirmation of ovulation and evaluation of luteal function. Fertil Steril. 1977;28:541–548. doi: 10.1016/s0015-0282(16)42554-9. [DOI] [PubMed] [Google Scholar]
- 23.Shikata J, Sanda H, Yamamuro T, Takeda T. Experimental studies of the elastic fiber of the capsular ligament: influence of aging and sex hormones on the hip joint capsule of rats. Connect Tiss Res. 1979;7:21–27. doi: 10.3109/03008207909152349. [DOI] [PubMed] [Google Scholar]
- 24.Slauterbeck J, Clevenger C, Lundberg W, Burch-field DM. Estrogen level alters the failure load of the rabbit anterior cruciate ligament. J Orthop Res. 1999;17:405–408. doi: 10.1002/jor.1100170316. [DOI] [PubMed] [Google Scholar]
- 25.Slauterbeck JR, Fuzie SF, Smith MP, et al. The menstrual cycle, sex hormones, and anterior cruciate ligament injury. J Athl Train. 2002;37:275–278. [PMC free article] [PubMed] [Google Scholar]
- 26.Smith KD, Rodriguez LJ, Tcholakian RK, Steinberger E. The relation between plasma testosterone levels and the lengths of phases of the menstrual cycle. Fertil Steril. 1979;32:403–407. doi: 10.1016/s0015-0282(16)44295-0. [DOI] [PubMed] [Google Scholar]
- 27.Tulchinsky D, Hobel CJ, Yeager E, Marshall JR. Plasma estrone, estradiol, estriol, progesterone, and 17-hydroxyprogesterone in human pregnancy. Am J Obstet Gynecol. 1972;112:1095–1100. doi: 10.1016/0002-9378(72)90185-8. [DOI] [PubMed] [Google Scholar]
- 28.Wajchenberg BL, Marcondes JA, Mathor MB, Achando SS, Germak OA, Kirschner MA. Free testosterone levels during the menstrual cycle in obese versus normal women. Fertil Steril. 1989;51:535–537. doi: 10.1016/s0015-0282(16)60571-x. [DOI] [PubMed] [Google Scholar]
- 29.Wojtys EM, Huston L, Boynton MD, Spindler KP, Lindenfeld TN. The effect of menstrual cycle on anterior cruciate ligament in women as determined by hormone levels. Am J Sports Med. 2002;30:182–188. doi: 10.1177/03635465020300020601. [DOI] [PubMed] [Google Scholar]
- 30.Yu WD, Liu SH, Hatch JD, Panossian V, Finerman GA. Effect of estrogen on cellular metabolism of the human anterior cruciate ligament. Clin Orthop Relat Res. 1999;366:229–238. doi: 10.1097/00003086-199909000-00030. [DOI] [PubMed] [Google Scholar]