

Abstract
The effects of laser fluence on ion formation in MALDI were studied using a tandem TOF mass spectrometer with a Nd-YAG laser and alpha-cyano hydrocinnamic acid matrix. Leucine enkephalin ionization and fragmentation were followed as a function of laser fluence ranging from the threshold of ion formation to the maximum available, i.e., approximately 280 – 930 mJ/mm2. The most notable finding was the appearance of immonium ions at fluence values close to threshold, increasing rapidly and then tapering in intensity with the appearance of typical backbone fragment ions. The data suggest the presence of two distinct environments for ion formation. One is associated with molecular desorption at low values of laser fluence that leads to extensive immonium ion formation. The second becomes dominant at higher fluences, is associated initially with backbone type fragments, but, at the highest values of fluence, progresses to immonium fragments. This second environment is suggestive of ion desorption from large pieces of material ablated from the surface. Arrhenius rate law considerations were used to estimate temperatures associated with the onset of these two processes.
INTRODUCTION
The fragmentation of protonated peptide ions to amino acid-specific sequence ions, and the subsequent algorithm based matching of the fragmentation, is one of the primary processes enabling the mass spectrometric identification and characterization of proteins [1, 2]. At the same time, understanding the fundamental features of the processes behind the fragmentations will serve to increase both the scope of the problems addressable by tandem mass spectrometry as well as the confidence in the answers obtained. In particular, investigations of the extent and type of fragmentation as a function of charge state, ion internal energy, attained by collision and/or formation mechanism, or peptide sequence are vital. Such studies have been undertaken by various investigators [3–6] over a number of years, but nevertheless continue to be of central importance to the identification problem as shown by a recent conference organized to address such questions [7].
At the most fundamental level, the fragmentation of any gas phase ion is a function of both the internal energy imparted to the ion and the length of time available for dissociation to occur [8, 9]. Hence, the fragments observed in any mass spectrometer depend upon the design of the mass spectrometer itself - the ionization mechanism, the activation method, and the time scales for fragment formation and detection. Multiple groups have completed detailed analyses of the effects of each on fragmentation. The earliest studies focused on the fragmentations resulting from the relatively energetic radical cations obtained by electron ionization of derivatized peptides [10–12]. With the invention of fast atom bombardment (FAB) and the development of four sector mass spectrometers, it became possible to study the effect of internal energy variation on fragmentation patterns [3, 13] arising from collisionally induced dissociations (CID). Simultaneously these studies made it possible to describe ion dissociation leading to the production of characteristic amino acid side chain fragment ions. More recently, the remarkable successes of electrospray ionization (ESI) coupled with triple quadrupole or ion trap type mass analyzers has led to intense study of the low energy fragmentations typically seen in these analyzers [14, 6]. At the same time, more extensive fragmentation has been observed by Wysocki and co-workers [4] using surface induced dissociation of electrosprayed ions. Other analyzers such as the hybrid quadrupole- time of flight (Q-q-TOF) instrument, also yield low energy fragmentation, similar to that observed in triple quadrupoles and traps. Although insufficiently energetic to consistently yield complete fragmentations or to ever produce side chain fragments, ion trap analyzers potentially allow sufficient time for the study of rearrangement reactions leading to sequence isomerization as reported by Glish and co-workers [15].
In principle matrix assisted laser desorption ionization (MALDI) [16–18] could be as important an ionization method as ESI for protein and peptide characterization. To date, however, this method has been used mostly for peptide mass mapping rather than for the more informative peptide fragmentation-based approaches. Most likely the reason for this is the substantial effort required to undertake such studies in the absence of a tandem mass analyzer. While Post Source Decay (PSD) analysis [19] represents a pioneering way of simulating a tandem analyzer, the difficulty of reconstructing fragmentation spectra has precluded its being used for extensive peptide sequencing studies. The advent of true tandem TOF instruments [20, 21] has increased the interest in MALDI as an ionization method, and has led to the development of new MALDI based proteomics workflows, notably LC-MALDI [22]. One of these new analyzers, the MALDI TOF/TOF [20] has unique fragmentation patterns where the tandem spectra are a combination of the products of both high energy CID and lower energy PSD. The properties of both these types of fragmentation has been discussed elsewhere [23]. Detailed analyses of the properties of fragmentation as a function of collision parameters have been completed elsewhere [24]. The purpose of this work is to examine, in detail, the properties of fragmentation as a function of the energy used for ionization. To do this properly, one must examine in part the nature of the MALDI ionization process.
Ion formation in MALDI has been described as a result of three processes that follow the strong absorption of laser energy:
“first, a controllable energy transfer to the condensed-phase matrix-analyte mixture inducing a “uniform and soft desorption”, second, a promotion of ionization by chemical reactions, and third, to generate favourable prerequisites” by isolating analyte molecules in the excess matrix.” [25]
Fundamental studies of the MALDI process have addressed these three points from both the experimental and theoretical perspectives. Several groups, most notably those of Karas, Hillenkamp and, more recently, Driesewerd, have studied cluster ejection from the matrix, effects of sample morphology, plume dynamics and initial velocities [26–28, 25]. Internal energy into the ions produced by these processes has been investigated by Zenobi and co-workers [29] and by Karas’ group [25, 30]. From the theoretical perspective, molecular dynamics simulations of these processes has been carried out by groups led by Vertes [31–34] and Garrison [35–38] and Knochenmuss [39]. In addition, Knochenmuss [40] has developed an overall quantitative model for ion formation. Furthermore, there have been several studies conducted using a series of pre-formed "thermometer" ions that fragment in a manner well characterized by fundamental reaction rate theory [33, 30]. Most of these studies however have focused on the process of ionization itself, rather than the coupling of internal energy to the analyte during ionization. Hence, such studies ignore fragmentation post ionization. The experimental examination of the effect of laser fluence on ion fragmentation has also been investigated in dinucleotides [29] in protein complexes [41], and peptides [42, 43]. This paper presents the results of our preliminary investigations of peptide fragmentation and sets the stage for a systematic investigation of peptide fragmentations in MALDI. While the overall aim of this and subsequent work is the optimization of peptide fragmentations produced by MALDI to enable more effective protein characterization, we have chosen leucine enkephalin (LeuEnk) for the initial study because of its extensive use by other investigators [14, 15, 44–48]. It is the intent of this paper to present a systematic study of the observed fragmentations and to characterize those observations within the context of the several exisiting models of the MALDI process.
EXPERIMENTAL
Mass Spectrometry
An ABI 4700 Proteomics Analyzer MALDI TOF-TOF (MDS Sciex/ABI Proteomics, Concord ON, Canada) was used in either MS or MS/MS mode for all measurements. The instrument is shown schematically in Figure 1. In MS, the accelerating voltage was lowered from the typical 20 kV to 10kV in order to obtain optimal resolution of the low mass fragments. The grid was operated at 70% of the accelerating voltage and the time between the laser pulse striking the sample and the high voltage extraction pulse was 400 ns. The two lenses were used to provide optimal radial focusing, and the two-stage reflector was operated such that a resolution of 12,000 was attained. In reflector mode, only ions that are formed in the source will appear as focused features in the final spectrum. Without ramping the laser fluence, one would not be able to distinguish whether these features resulted from chemicals present in the sample or fragmentation resulting from the process of ionization. This mechanism of fragment formation is traditionally termed in source decay (ISD) [42, 43]. It should also be noted that ions that fragment after acceleration, but before the detector, have an energy defined by Efrag = Eprec*(mfrag/mprec) and would thus appeared as unfocused metastable features in the spectrum. These are ignored in the analyses.
Figure 1.

Schematic of the ABI 4700 Proteomics Analyzer MALDI TOF-TOF instrument. Note that TIS in schematic represents the 'Timed Ion Selector' used for selection of precursor ions for MS/MS studies.
In MS/MS mode, it is useful to review instrument operation in order to understand the significance of the ions observed. In MS/MS mode in the TOF/TOF, ions are accelerated out of the first source and into a 40 cm long field free region. At the end of the field free region, there is a timed ion selector (TIS) that prevents ions traveling at a velocity other than that of the precursor from entering the collision cell region. The collision cell region is operated at a floating potential, and the nominal collision energy is defined by the potential difference between the accelerating voltage and the collision cell voltage. There is a deceleration stack that provides radial focusing for the ions entering the collision cell. The region defined as the collision cell is approximately 20 cm long, extending from the timed ion selector to the second source. The fragment ions, along with any remaining precursor ion, enter the second source simultaneously, and the extraction pulse of the second source is timed to pulse when the ions are approximately 4 mm into the source region. The pulse serves as the start time for the time to mass conversion of the fragment spectrum.
As this study focuses on fragmentation, it is prudent to review in MSMS mode, where fragmentation can occur. Ions fragmenting in the source (i.e., are analogous to those discussed above for reflector mode) will have a different velocity than the precursor, and will be prohibited from entering the collision cell region, and hence the second source, by the timed ion selector. Similarly, ions that fragment during the flight time from the first source to the timed ion selector have the same velocity as the precursor, but have too low an energy to enter the collision cell region. Ions that fragment during the transit from the timed ion selector to the second source, will arrive in the second source at the calculated extraction time for the precursor and hence will appear as focused fragment ions in the fragment spectra. Ions that fragment during the flight time from the second source to the detector will appear as unfocused metastable ions in the fragment spectrum.
For the MSMS experiments completed here, an 8kV accelerating voltage, an 85% grid voltage and a 400 ns delay between the laser and extraction high voltage pulse was used in the first source. The system was operated at a nominal 1 kV nominal collision energy, meaning that the potential offset between the source (8kV) and the collision cell (7kV) was 1kV. No gas was added to the collision cell hence fragments resulting from CID do not need to be considered. In the case of selecting the LeuEnk MH+ as precursor, the time of the flight from the 1st source to the timed ion selector is approximately 8 μsec. It takes the same ions, approximately 11 μsec to travel from the timed ion selector to the second source, hence fragment ions observed in MS/MS mode are the result of ion dissociation taking between 8 and 20 μsec. The second source was pulsed with an accelerating voltage of 15 kV and a grid voltage of 7kV.
The Nd:YAG laser (355 nm, 5 ns Pulse width) (Laser -Compact, Moscow, Russia) was operated over a range of attenuator settings between 3900 and 6500 (arbitrary units), corresponding to the threshold for ion signal to maximum power. Laser power output was measured using a Molectron Energy Max 400 (Coherent, Inc. Santa Clara, CA) power meter and ranged from 285 μJ/mm2 ("attenuator" setting of 3900) to 917 μJ/mm2 ("attenuator" setting of 6500). Laser spot size on the sample plate was determined by ablating matrix from a sample plate coated only with a matrix solution until the underlying plate surface was exposed. Spot size was then estimated by microscopic comparison with a standard reference object. Results of these measurements were verified using a beam profiler. The majority of these experiments were completed with a laser spot size of 155 μm diameter, but for comparison, spectra were obtained at spot sizes of 120 and 160 μm. It was determined that the three different spot sizes give rise to comparable degrees of fragmentation of protonated LeuEnk when fluence values were adjusted to comparable levels for each spot; this is shown in Figure 2.
Figure 2.

Extent of fragmentation as a function of spot size adjusted for comparable fluence. Data plotted as a fraction of total ions where ◆ = immonium ions and ◇ = y-series ions.
LeuEnk samples were prepared as a 5 pmole/μL solution in a 0.01.% trifluoroacetic acid (TFA) aqueous solvent. Matrix was a 5 mg/mL solution of re-crystallized a-cyano hydrocinnamic acid (CHCA) in a 1:1 acetonitrile:0.1% TFA solution made 10mM in (NH3)2H2PO4 [49, 50]. A 20:1 matrix:sample mixture was made, applied to the sample plate as 1 μL drops and left to air dry. A given sample spot was used to generate only a single 5000 laser shot spectrum thus insuring each spectrum was generated from surfaces of a similar physical state with no possibility of sample depletion. Laser attenuation was stepped incrementally over the range described above under automated control software. The absence of signal saturation in the averaged spectra, particularly at intermediate attenuator settings, was accomplished by instrument control software (single shot protection feature) to reject single shot spectra with signal intensities higher 8.5 x 10⁴ counts from being averaged into the final spectrum. In MSMS mode no metastable suppressor was utilized, hence precursor and fragment areas reflect abundances resultant from fragmentation and instrument transmission.
Materials
Acetonitrile (HPLC grade), TFA and (NH3)2H2PO4 (reagent grade) were used as received from the supplier (Aldrich); CHCA (Aldrich) was re-crystallized prior to use. LeuEnk (Sigma) was used as received.
Data Analysis
Individual spectra were copied from the default data base format of the 4700 Version 2.0 Console software into individual files accessible to a freestanding version of the ABI Data Explorer™ software. Using a Perl script written to execute a batch task, spectra were calibrated externally against a LeuEnk spectrum obtained close to the onset of ionization. Spectra were calibrated in MS mode using m/z ratios of LeuEnk MH+ and the matrix monomer and dimer ions and in MS/MS mode by using the MH+ and m/z 136 fragment ion. Tables of m/z – intensity pairs were generated for ions exceeding a Signal-to Noise ratio (S/N) of 5. To account for differences in resolution as a function of m/z in both MS and MSMS mode, the area of the C12 isotope peak was used as the metric of ion abundance. These tables were then written in ASCII format under control of the same Perl script; the tables were subsequently parsed using a separate Perl script into summary tables containing intensity information for LeuEnk fragment ions as a function of attenuator setting/laser fluence. All subsequent data analysis was carried out using these final tables. The masses and ion types used for this parsing are listed in Table I.
Table I.
Fragments of Leucine Enkephalin (YGGFL, MH+ = 556.28) Ion Series/Fragment
| 1 | 2 | 3 | 4 | |
|---|---|---|---|---|
| y | 132.10 | 279.17 | 336.19 | 393.21 |
| b | 164.07 | 221.09 | 278.11 | 425.18 |
| a | 136.08* | 193.10 | 250.12 | 397.19 |
| Internal fragments: | 115.05 (GG), 205.10 (GF), 262.12 (GGF) | |||
| Immonium** | 86.10 (L), 120.08 (F), 136.08 (Y) | |||
Intensity of m/z 136.08 is taken as Immonium (Y) rather than a1.
Immonium of G (m/z 30) is below scan limit of experiment.
RESULTS and DISCUSSION
Total Fragments - Protonated Parent & Precursor
The overall behavior of LeuEnk as a function of laser fluence is illustrated in Figure 3 with total ion current shown in the upper panel and MH+ intensity, as a fraction of total fragment ion current, for both MS and MS/MS modes shown in the lower panel. Figure 3B shows that in MS mode the MH+ ion intensity rapidly diminishes as fluence increases above the threshold for ion production, up to about 480 μJ/mm2. After this point the intensity continues to diminish, but at a markedly slower rate until it disappears entirely just above 800 μJ/mm2. In MS/MS mode on the other hand, the protonated parent ion remains the base peak of spectra over the whole range of laser fluence. It is clear from Figure 3 that there is an association between laser fluence and ion fragmentation and it is also apparent that the extent of the fragmentation is associated with differences in the time at which the MH+ ion is sampled, i.e., MS vs MS/MS. We believe, in the light of the discussion below, that this behavior is internally consistent.
Figure 3.

a. Total fragment ion signal vs laser fluence plotted over operating fluence range..
b. LeuEnk MH+ signal intensity vs laser fluence plotted as a fraction of total ion signal normalized at each laser fluence level, for MS (○) and MS/MS (●) modes.
Fragmentation
Laser fluence-induced fragmentation processes in MS mode are shown in more detail in the breakdown curves of Figure 4. Since all fragment ions observed in MS mode must be formed prior to exiting the source, these must be considered prompt fragments. Peak areas resulting from each of five different types of dissociations are summed for the Figure, i.e., the y-, b- and a-series ions, internal fragments and immonium ions. It can be seen in this Figure that, while immonium ion production quickly becomes the dominant process, at the very onset of fragmentation immonium ion formation appears to be preceded by backbone fragmentations of both y-and b-series ions. In terms of the immonium ions observed, both Phe-, m/z 120, and Tyr-immonium, m/z 136, ions contribute equally to this curve over the entire range measured but there are no contributions observed from either the Gly- or Leu-immonium ions at m/z 30 and 86 respectively. Note that, although the m/z 136 ion is isobaric with the a1 fragment, we assign its origin to the immonium series because of its strong resemblance between the breakdown curves for m/z 120 and 136. The threshold behavior of these processes is not inconsistent with those predicted by Knochemmuss [40] for similar laser spot sizes considering that our measurements used CHCA matrix rather than the DHB of the calculations.
Figure 4.

Summed fragment ion signal intensity in MS mode vs laser fluence plotted as a fraction of total ion signal normalized at each laser fluence level. Five fragment ion series shown as normalized sums: ◁ (Immonium), ○ (b-series), ● (a-series), □ (y-series), ■
The second intriguing characteristic of Figure 4 is the behavior of the C- and N-terminal fragment ions. Figure 4 suggests the occurrence of something other than a simple response to increasing laser fluence for these two ion series. That this is indeed the case is shown more clearly in Figure 5 where details of N-terminal fragments are shown in the upper panel and C-terminal fragments in the lower. Figure 5a shows a progression from higher to lower mass members of the two series as a function of laser fluence. This progression is consistent with a series of consecutive fragmentations. Harrison and Boyd [14, 6] have both previously demonstrated such consecutive fragmentations for LeuEnk, using electrospray ionization and in-source CID, but to our knowledge, such behavior has not been demonstrated previously in MALDI.
Figure 5.
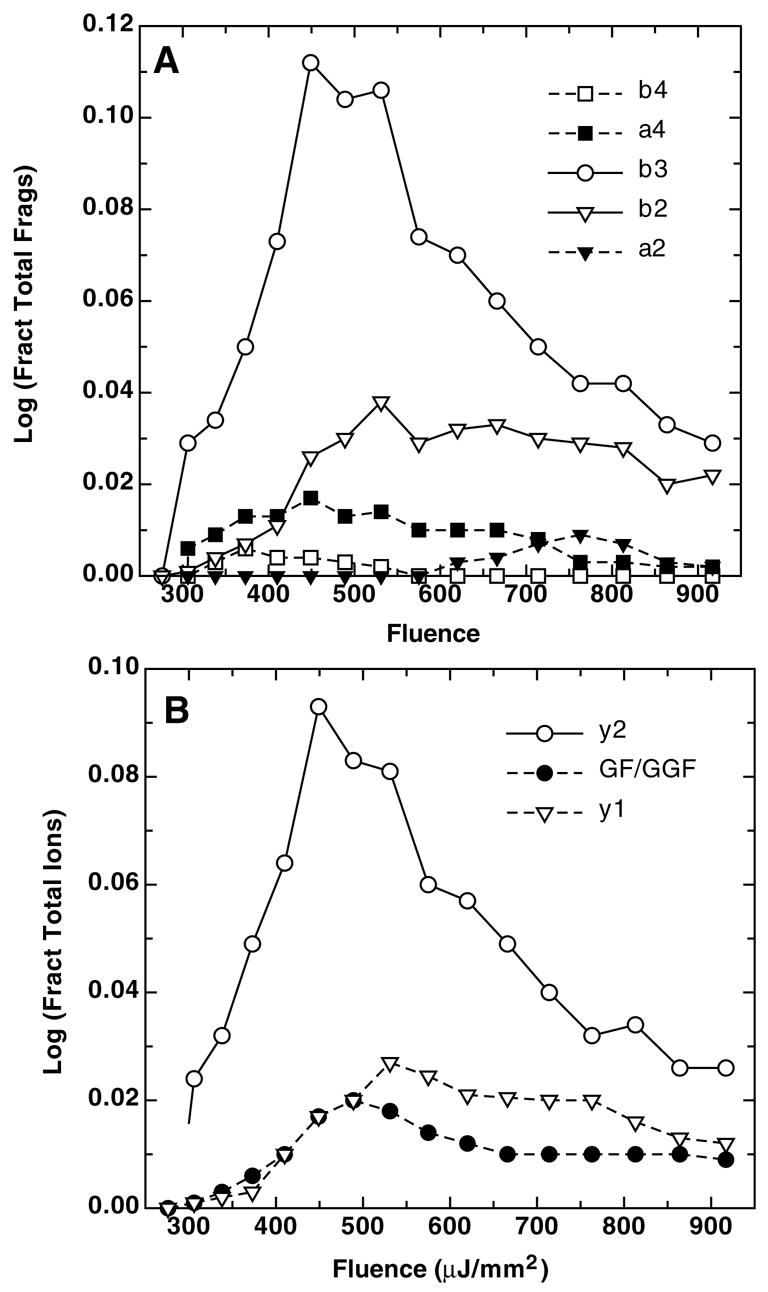
Fragment ion signal intensity for consecutive fragmentations in MS mode vs laser fluence, as a fraction of total ion signal normalized at each laser fluence level.
a. N-terminal ions: □ (b4), ■ (a4), ○ (b3), ▽ (b2), ▼ (a2).
b. C-terminal ions: ○ (y2), ● (GF & GGF), ▽ (y1)
If the energy required to yield a particular fragment is indeed a function of laser fluence, then the succession of maxima in Figure 5 should yield an energy dependent ion series. Based on the observed progression of maxima, the energy dependent series for the N-terminal fragments is: b4 < a4 < b3 < [a3] < b2 < a2. There was no signal seen for the a3 ion, and interestingly, it was absent from the series reported by Harrison [6]. There was also no signal observed for the b1 ion either, and, if the a1 is truly present, its existence was masked by the immonium ion as noted above.
An analogous pattern was observed for the C-terminal series, the y ions and internal fragments, shown in Figure 5b. The GF+ and GGF+ internal fragments overlap in their behavior and for this reason only the GF+ signal is plotted. No intensities that can be associated with the GG+ internal ion were observed. The C-terminal ions observed, in order of increasing energy requirements, are: y2 < GG+/GGF+ < y1. A similar progression of energy requirements was reported by Harrison over ESI source cone voltages in the range of 44–62 V [6]. The presence of the GF+ internal fragment was reported by only two other groups, Alexander and Boyd [14] in a CID spectrum with ELAB = 70 eV with 90% attenuation of MH+using a sector instrument [14] and Wysocki and co-workers under thermal degradation conditions for which the ions were at temperatures between 658 and 679 K [44]. In general other studies appear to have been undertaken under CID [48, 51] or thermal conditions [47] which were insufficiently energetic to allow decompositions to the extent of producing either these internal fragments or immonium ions.
It is interesting to note in Figure 5a that the intensity of any a-series ions observed is approximately 10-fold lower than the b-series ion from which it derives or to which it leads. Further inspection of Figure 5 shows that the most intense ions are the complimentary pair, b3 and y2, and that their maxima occur at the same laser fluence. Taken together, these data make a clear case for the presence of a series of energy dependent fragmentations that occur within the ion source of the instrument.
Consideration of the fragmentation observed in MS/MS mode, as seen in Figure 6, reveals an appreciably less complex pattern than that seen in MS mode. Neither internal nor immonium ion fragments are seen over the entire range of laser fluence in MS/MS mode and only a limited number of C- and N-terminal ions are observed. While the total C- and N-terminal fragments are of comparable relative intensity to each other as those observed in MS mode, any clear indication of a series of consecutive reactions is absent in MS/MS; those fragments that are observed are present at all values of fluence. Furthermore, the onset of these fragment signals in MS/MS occurs at appreciably higher fluence levels than in MS.
Figure 6.

Fragment ion signal intensity for consecutive fragmentations in MS/MS mode vs laser fluence, as a fraction of total ion signal normalized at each laser fluence level. □ (sum of y-series), ○ (sum of b-series), ● (sum of a-series).
General interpretation of the overall behavior of LeuEnk fragmentation shown in Figures 4–6 suggests several significant points. There appears to be two broad classes of reactions that occur within the one μsec interval accessible in MS mode. These classes correspond first, to a rapid and extensive coupling of energy into the molecule leading to extensive fragmentations as suggested by the presence of immonium fragments close to the onset of ionization; this is termed Process 1. This Process leads to extensive fragmentation resulting in rapidly increasing levels of immonium ions up to a laser fluence of about 500 μJ/mm2. Above this value of fluence, the rapid production of immonium ions vs fluence appears to become slower.
The sequence ions seen in MS, and the similar ions observed in MS/MS, as shown in Figures 4–6, suggest the presence of a second, discrete, energy distribution by which smaller amounts of energy appear to be coupled into the molecule; this will be referred to as Process 2. This second class of reaction leads to a series of fragmentations that proceed as a series of consecutive reactions in which the product of each reaction gains the thermal energy necessary to serve as the precursor of the next reaction. These consecutive fragmentations suggest the presence of a second ion fragmentation process. One might speculate that these arise as a result of a somewhat separable energy distribution in the plume of ions and neutral molecules formed by the laser irradiation. If distribution of ion energies associated with Process 2 were indeed present, then it might also serve as the basis for the fragmentation seen in MS/MS mode. That is, in MS/MS fragments would be those arising from decompositions of MH+ ions in the 8–20 μsec interval which had insufficient internal energy for prompt fragmentation, yet sufficient to fragment in the longer, MS/MS time interval. The second set of fragmentations seen in MS and all of those seen in MS/MS suggest the presence of an energy distribution that is somewhat distinct from the first one described above within the plume of ions generated from the sample.
Figure 7 is an attempt to represent the second group of decompositions in MS mode, i.e., those associated with Process 2. The Figure was generated by subtracting the immonium ion intensity at 480 μJ/mm2 from the total immonium ion intensity and re-plotting Figure 4 using only those immonium ion intensities greater than zero. Figure 7 clearly shows that the second group of prompt fragmentations proceeds from backbone processes to immonium ion formation. Note, the assumption behind this Figure is that the first process continues over the entire range of fluences studied but contribute relatively less than the fragments of the seconded set of processes above a fluence of 500 μJ/mm2.
Figure 7.

Summed fragment ion signal intensity in MS mode, as a fraction of total ion signal normalized at each laser fluence level vs laser fluence plotted for five fragment ion series. Immonium signal intensity "corrected" from data of Figure 4 to emphasize terminal consecutive reactions of Process 2 described in text. □ (sum of y-series), ○ (sum of b-series), ● (sum of a-series), ■ (Internal ions), * ("Corrected" sum of immonium ions).
There are several possible explanations that might account for the observations summarized in Figures 4–7. Before presenting them it is critical to note that our aim in this paper is to present what is clearly a novel set of observations – the fragmentation of an easily fragmented peptide under MALDI conditions where the laser fluence is increased from threshold to to the maximum available for the instrument. What we intend to provide is the simplest physical model to account for the observations in our extensive experimental study. It is not our intention to formulate a new theoretical model for MALDI. Furthermore, our hope is that the explanation we provide is model independent and therefore neither supports or negates any of the existing models of MALDI.
To summarize our interpretation of the data, we suggest that these data support the presence of two classes of processes, the one beginning just above the threshold for ionization and the other beginning at about 480 μJ/mm2. Both processes lead to progressive fragmentation of the MH+ ion, but the first appears to couple energy into the protonated parent much more quickly than the second. As a result, the first process shows a rapid dominance of the immonium ion intensity in the MH+ breakdown curves. On the other hand, the second process, while ultimately reaching the same point, i.e., domination by immonium ion production, proceeds in a manner in which energy is coupled into the MH+ more slowly than the first. In very simple terms, in this system of analyte and matrix, the first process leads to immonium ions being dominant at fluences above 350 μJ/mm2 while the second requires fluences above 600 μJ/mm2. We also suggest that the first process is strongly associated with the duration of the laser pulse and the second is more strongly associated with the time required for the ion extractions from the first source to occur. That is, we suggest that the timing for ion production by the first process is on the order of the laser flash duration, 5 x 10⁻⁹s and the timing for ion production by the second process is on the order of 1 x 10⁻⁶s.
The simple physical model that has just been described might be reconciled with two somewhat different theoretical models. In the first, a molecular dynamics simulation developed by Garrison and co-workers [36], there is a progression with increasing laser fluence from the initial desorption of individual molecules through chunks of ablated material. These ablated chunks ultimately progress, with increasing fluence, to smaller pieces and finally essentially individual molecules. Such a progression might account for our observations if the initial individual molecules were desorbed with high internal energies, which in our case would lead to the rapid production of immonium ions as seen in Figure 4. As the chunks ablated, one might expect ions to be produced with lower internal energies by desorption from the overall somewhat cooler chunks. This would lead to the observed production of backbone fragments that ultimately progress to the immonium ions as shown in Figure 7. However, a recent paper by Knochenmuss and Zhigilei [39] shows that this simple interpretation of the molecular dynamics simulation may be incomplete. Their work predicts that the initial individually emitted molecules are no hotter than the clusters. They furthermore show that the cluster temperatures do not differ from that of the surrounding gas.
The molecular dynamics simulations might however still provide a means of explaining the origins of the first group of processes and thereby account for our observations. As proposed in two recent papers and a review by Knochenmuss [39, 52, 53], laser irradiation of the MALDI sample induces charging of the upper layers of the sample through the migration of mobile free electrons from the surface. The migration yields a charged surface of the sample which could in turn lead to the ejection of protonated ions from the surface. These ejected ions will carry internal energies associated with the temperature of the heated surface, and due to low molecular densities above the surface, would not thermalize, but rather fragment in a manner consistent with our observations. While this process becomes masked at higher fluences, it should persist over the entire range studied, in a manner consistent with Figure 7.
On the other hand, at high fluences the relatively dense plume leads to a near equilibrium state that favors proton transfers from matrix to analyte. As the fluence increases beyond 480 μJ/mm2, the increasing plume density leads to higher numbers of ion-molecule collisions, approaching a high pressure limit and quasi-equilibrium conditions. Under these circumstances, energy deposition into the LeuEnk MH+ is limited by collisions with the plume gases and increases only with plume temperature/laser fluence giving rise to the observed sequence of fragments, dominated ultimately by immonium ions.
Energetic Considerations
The temperatures at which the two classes of processes occur can be estimated using an approach based on the Arrhenius rate law. As a starting point, we assume that all of the prompt fragmentation reactions, those observed in MS mode, occur near the 'high pressure' regime for unimolecular reactions. We make this assumption initially for reasons discussed below. The high-pressure limit is generally assumed to exist in the laser induced plume of ions and neutrals of the size (number of oscillators) of concern in this work. While not likely a classical equilibrium state, we assume that we can derive an effective temperature in the regime of interest. In order to estimate temperature, we equate the unimolecular reaction rate constant, k, describing the loss of MH+ intensity with the Arrhenius rate constant expression as shown in Equation 1
| (1) |
where E‡ and A are the activation and frequency factor, respectively, k the Boltzmann constant, T the absolute temperature and t the duration of the reaction. The rate constant can be eliminated from Equation 1 and the resulting expression solved for T, the temperature at which an observed extent of reaction will be achieved for particular values of A and E‡.
The temperatures to be evaluated are those in what we propose as two different reaction regimes. Initially we will assume that both groups of reactions occur in the high pressures that are likely associated with the higher laser fluences. Furthermore, we will initially assume that both reactions occur in the longer time frame being considered: 1x10⁻⁶s, the time necessary to extract the ions from the source. For the initial temperature estimates we will differentiate the two groups of reaction from one another by their reaction extent. We assume that the process leading to extensive fragmentation, essentially breaking sufficient bonds to yield only immonium ions, breaks about 16% of the bonds in the peptide. This reaction extent must occur in two regions of the observed data, i.e., in the region between threshold and the break seen in Figure 4 (below about 480 μJ/mm2) and at fluences above about 600 μJ/mm2. On the other hand, the beginnings of the second process, at about 480 μJ/mm2, would appear to involve a lower extent of reaction, breaking only the bonds necessary to form a single y-or b-series ion, or about 2–3% of the peptide bonds. The Arrhenius parameters used for the two estimates are given in Table II. Since Arrhenius parameters for the dissociation of LeuEnk are not accurately known, we use high and low estimates ginven in this Table in an effort to bracket temperatures. The Arrhenius parameters for the first estimate were taken from the thermal degradation measurement of Mautner, et al. which showed the presence of immonium ions [44] and those for second from typical peptide dissociations [54]. The results of the calculations for the two sets of Arrhenius parameters, a 1 μs reaction time and the two different extents of reaction are shown in the upper part of Table III.
Table II.
Parameter Values§
| A (sec−1) | E‡ (kcal/mole) | |
|---|---|---|
| Estimate 1 | 1016 | 37 |
| Estimate 2 | 1015 | 25 |
Table III.
Results
| t (sec) | Extent (1-[MH+/MH0]) | Estimate 1 | Estimate 2 | |
|---|---|---|---|---|
| High Pressure Limit | 1x10⁻⁶ | 0.02 | 694 K | 513 K |
| 1x10⁻⁶ | 0.16 | 755 K | 562 K | |
| Process 1 only | 5x10⁻⁹ | 0.16 | 960 | 736 |
As expected, Table III indicates a higher temperature is required for a greater extent of reaction. As for the temperatures calculated for the 2% reaction extent, 513–694 K, are rather close to those observed in BIRD work [47], in which backbone fragmentation ions were found to predominate the spectra. They are not inconsistent with the temperature for the onset of ion formation predicted by Knochenmuss [55]. Immonium ion production becomes dominant in what we have termed Process 2 at a 16% reaction extent corresponding to a fluence of about 600 μJ/mm2. We estimate the temperature necessary to induce these fragmentations to be in the range 562–755 K.
In order to produce immonium ions by what we have termed the Process 1, we speculate that the bond ruptures occur in a shorter time-frame than those that are simply limited by the extraction pulse length; we suggest a time frame of the laser pulse duration, 5 ns. Recognizing that such processes are not likely to be strictly amenable to estimation using the approach taken in Equation 1, we nevertheless use it here. We assume the same values of activation energy and pre-exponential factors and reaction extent, but simply shorten the time for the reaction to proceed. The results of this calculation are in the last line of Table III; they show a temperature range of 736–960 K. The lower end of this range is in reasonable agreement with the immonium ion formation observed in thermal degradation measurements by Wysocki's group [44], i.e., between 658 and 679K.
In terms of the MS/MS fragmentations that are observed, we suggest that these ions result from processes arising from the low energy portion of a thermal distribution. That is, ions that do not fragment in the source, but do so when given the timeframe available in MS/MS. Figure 6 shows that the MS/MS fragments are the product of the lowest energy pathways available to the MH+ and are not observed until appreciably above the onset of the backbone type fragments shown in Figure 5. From this we conclude that the fragments seen in MS/MS arise only from the low energy portion of the distribution generated by the chunk ablation process of the laser.
CONCLUSIONS
Leucine enkephalin has been shown to undergo two regimes of ion formation as a function of MALDI laser fluence. These two regimes correspond to two different ion formation environments that occur within the MALDI plume at different levels of fluence. The first is associated with molecular desorption from the surface even at relatively low fluence values, but leads to virtually complete fragmentation within very short times. The second process is associated with the evaporation of ions from large pieces of material ablated from the sample surface, occurs at longer times and is associated, initially at least, with consecutive backbone fragmentations. There is a clear point of crossover between these two different processes. While leucine enkephalin is a rather small peptide given to extensive fragmentation, nevertheless these initial studies appear to give significant experimentally based insights into the processes that occur in MALDI ion formation.
Acknowledgments
This research was supported (in part) by the Intramural Research Program of the National Institute of Child Health and Human Development.
Certain commercial equipment, instruments, or materials are identified in this document. Such identification does not imply recommendation or endorsement by the National Institute of Standards and Technology, nor does it imply that the products identified are necessarily the best available for the purpose.
Footnotes
Publisher's Disclaimer: This is a PDF file of an unedited manuscript that has been accepted for publication. As a service to our customers we are providing this early version of the manuscript. The manuscript will undergo copyediting, typesetting, and review of the resulting proof before it is published in its final citable form. Please note that during the production process errors may be discovered which could affect the content, and all legal disclaimers that apply to the journal pertain.
LITERATURE CITED
- 1.Ferguson P, Smith R. Proteome Analysis by Mass Spectrometry. Annual Review of Biophysics and Biomolecular Structure. 2003;32:399–424. doi: 10.1146/annurev.biophys.32.110601.141854. [DOI] [PubMed] [Google Scholar]
- 2.Steen H, Mann M. The ABC's (and XYZ's) of Peptide Sequencing. Nature Reviews of Molecular and Celluar Biology. 2004;5:699–711. doi: 10.1038/nrm1468. [DOI] [PubMed] [Google Scholar]
- 3.Johnson R, Martin S, Biemann K. COLLISION-INDUCED FRAGMENTATION OF (M + I-l) + IONS OF PEPTIDES. SIDE CHAIN SPECIFIC SEQUENCE IONS *. International Journal of Mass Spectrometry and Ion Processes. 1988;86:137–154. [Google Scholar]
- 4.Jones J, Dong A, Somogyi A, Wysocki V. Sequence Dependence of Peptide Fragmentation Efficiency Curves Determined by Electrospray Ionization/Surface-Induced Dissociation Mass Spectrometry. Journal of the American Chemical Society. 1994;116:8368–8369. [Google Scholar]
- 5.Vachet R, Winders A, Glish G. Correlation of Kinetic Energy Losses in High-Energy Collision-Induced Dissociation with Observed Peptide Product Ions. Anal Chem. 1996;68:522–526. doi: 10.1021/ac950893r. [DOI] [PubMed] [Google Scholar]
- 6.Harrison A. Energy-resolved Mass Spectrometry: a Comparison of Quadrupole Cell and Cone-voltage Collision-induced Dissociation. Rapid Commun Mass Spectrom. 1999;13:1663–1670. doi: 10.1002/(SICI)1097-0231(19990830)13:16<1663::AID-RCM695>3.0.CO;2-T. [DOI] [PubMed] [Google Scholar]
- 7.Geer L, Yergey A, Stein S, Nesvizhskii A, Markey S, Kowalak J, Epstein J. NIH/NIST/ISB Peptide Fragmentation and Identification Workshop. April 8–9, 2004. [Google Scholar]
- 8.Benson S. Thermodynamical Kinetics. McGraw-Hill; New York: 1960. [Google Scholar]
- 9.Forst W. Theory of unimolecular Reactions. Academic Press; New York: 1973. [Google Scholar]
- 10.Biemann K, Gapp F, Seibl J. Application of Mass Spectrometry to Structure Problems. I. Amino Acid Sequence in Peptides. J Am Chem Soc. 1960;81:2274–2275. [Google Scholar]
- 11.Stenhagen E. Massenspektrometrie als Hilfsmittel bei der Strukturbestimmung Organischer Verbindungen, Besonders bei Lipieden und Peptiden. Fresenius ZeitschriFresenius Zeitschrift fur Analtische Chemieft fur Analtische Chemie. 1961;181:462–480. [Google Scholar]
- 12.Biemann K. Mass Spectrometry: Organic Chemical Applications. Mcgraw-Hill; New York: 1962. p. 370. [Google Scholar]
- 13.Bordoli R, Bateman R. The effect of collision energy, target gas and target gas purity on the high energy collision induced product ion spectrum of renin substrate. International Journal of Mass Spectrometry and Ion Processes. 1992;122:243–254. [Google Scholar]
- 14.Alexander A, Boyd R. Experimental Investigations of Factors Controlling the Collision Induced Dissociation Spectra of Peptide Ions in a Tandem Hybrid Mass Spectrometer. I. Leucine Enkephalin. International Journal of Mass Spectrometry and Ion Processes. 1989;90:211–240. [Google Scholar]
- 15.Vachet R, Asam M, Glish G. Secondary Interactions Affecting the Dissociation Patterns of Arginine-Containing Peptide Ions. Journal of the American Chemical Society. 1996;118:6252–6256. [Google Scholar]
- 16.Karas M, Hillenkamp F. Laser Desorption Ionization of Proteins with Molecular Masses Exceeding 10000 Daltons. Analytical Chemistry. 1988;60:2299–2301. doi: 10.1021/ac00171a028. [DOI] [PubMed] [Google Scholar]
- 17.Tanaka K, Waki H, Ido Y, Akita S, Yoshida Y, Yoshida T. Protein and Polymer Analysis up to m/z 100,000 by Laser Ionization Time-of-Flight Mass Spectrometry. Rapid Communications in Mass Spectrometry. 1988;2:151–153. [Google Scholar]
- 18.Hillenkamp F, Karas M, Beavis R, Chait B. Matrix-assisted Laser Desorption of Biopolymers. Analytical Chemistry. 1991;63:1193A–1203A. doi: 10.1021/ac00024a002. [DOI] [PubMed] [Google Scholar]
- 19.Spengler B. Post-source Decay Analysis in Matrix-assisted Laser Desorption/Ionization Mass Spectrometry of Biomolecules. JOURNAL OF MASS SPECTROMETRY. 1997;32:1019–1036. [Google Scholar]
- 20.Medzihradszky K, Campbell J, Baldwin M, Juhasz P, Vestal M, Burlingame A. The Characteristics of Peptide Collision-Induced Dissociation Using a High-Performance MALDI-TOF/TOF Tandem Mass Spectrometer. Analytical Chemistry. 2000;72:552–558. doi: 10.1021/ac990809y. [DOI] [PubMed] [Google Scholar]
- 21.Shevchenko A, Loboda A, Shevchenko A, Ens W, Standing K. MALDI Quadrupole Time-of-Flight Mass Spectrometry: A Powerful Tool for Proteomics Research. Analytical Chemistry. 2000;72:2132–2141. doi: 10.1021/ac9913659. [DOI] [PubMed] [Google Scholar]
- 22.Zhan Y, Richardson B, Becklin R, Savage JKB, Peltier J. Development of an LC-MALDI Method for the Analysis of Protein Complexes. Journal of the American Chemical Society. 2004;15:803–822. doi: 10.1016/j.jasms.2004.02.004. [DOI] [PubMed] [Google Scholar]
- 23.Yergey A, Coorssen J, Backlund P, Blank P, Humphrey G, Campbell J, Vestal M. De Novo Sequencing of Peptides Using MALDI/TOF-TOF. Journal of the American Society for Mass Spectrometry. 2002;13:784–791. doi: 10.1016/S1044-0305(02)00393-8. [DOI] [PubMed] [Google Scholar]
- 24.Campbell J. Mapping the Properties of Center of Mass Collision Energy on a MALDI TOF/TOF Mass Spectrometer – Fundamentals and Applications; Proceedings of the 51st ASMS Conference on Mass Spectrometry and Allied Topics; Montral, Quebec. 2003. [Google Scholar]
- 25.Karas M, Kruger R. Ion Formation in MALDI: The Cluster Ionization Mechanism. Chemical Reviews. 2003;103:427–439. doi: 10.1021/cr010376a. [DOI] [PubMed] [Google Scholar]
- 26.Berkenkamp S, Menzel C, Hillenkamp F, Dreisewerd K. Measurements of Mean Initial Velocities of Analyte and Matrix Ions in Infrared Matrix-Assisted Laser Desorption Ionization Mass Spectrometry. J Am Soc Mass Spectrom. 2002;13:209–220. doi: 10.1016/S1044-0305(01)00355-5. [DOI] [PubMed] [Google Scholar]
- 27.Menzel C, Dreisewerd K, Berkenkamp S, Hillenkamp F. The Role of the Laser Pulse Duration in Infrared Matrix-Assisted Laser Desorption/Ionization Mass Spectrometry. J Am Soc Mass Spectrom. 2002;13:975–984. doi: 10.1016/S1044-0305(02)00397-5. [DOI] [PubMed] [Google Scholar]
- 28.Dreisewerd K. The Desorption Process in MALDI. Chemical Reviews. 2003;103:395–425. doi: 10.1021/cr010375i. [DOI] [PubMed] [Google Scholar]
- 29.Stevenson E, Breuker K, Zenobi R. Internal energies of analyte ions generated from different matrix-assisted laser desorption/ionization matrices. Journal of Mass Spectrometry. 2000;35:1035–1041. doi: 10.1002/1096-9888(200008)35:8<1035::AID-JMS34>3.0.CO;2-V. [DOI] [PubMed] [Google Scholar]
- 30.Gabelica V, Schulz E, Karas M. Internal Energy Build-up in Matrix-Assisted Laser Desorption/Ionization. International Journal of Mass Spectrometry. 2004;39:579–593. doi: 10.1002/jms.651. [DOI] [PubMed] [Google Scholar]
- 31.Bencsura A, Navale V, Sadeghi M, Vertes A. Matrix–Guest Energy Transfer in Matrix-assisted Laser Desorption†. Rapid Commun Mass Spectrom. 1997;11:679–682. [Google Scholar]
- 32.Sadeghi M, Wu X, Vertes A. Conformation Changes, Complexation, and Phase Transition in Matrix-Assisted Laser Desorption. J Phys Chem B. 2001;05:2578–2587. [Google Scholar]
- 33.Luo G, Marginean I, Vertes A. Internal Energy of Ions Generated by Matrix-Assisted Laser Desorption/Ionization. Anal Chem. 2002;74:6185–6190. doi: 10.1021/ac020339z. [DOI] [PubMed] [Google Scholar]
- 34.Moskovets E, Vertes A. Fast Dynamics of Ionization in Ultraviolet Matrix-Assisted Laser Desorption Ionization of Biomolecules. J Phys Chem B. 2002;106:3301–3306. [Google Scholar]
- 35.Zhigilei L, Kodali P, Garrison B. Molecular Dynamics Model for Laser Ablation and Desorption of Organic Solids. J Phys Chem B. 1997;101:2028–2037. [Google Scholar]
- 36.Zhigilei L, Kodali P, Garrison B. On the Threshold Behavior in Laser Ablation of Organic Solids. Chemical Physics Letters. 1997;276:269–273. [Google Scholar]
- 37.Zhigilei L, Garrison B. Velocity Distributions of Analyte Molecules in Matrix-assisted Laser Desorption from Computer Simulations. Rapid Commun Mass Spectrom. 1998;12:1273–1277. [Google Scholar]
- 38.Zhigilei L, Kodali P, Garrison B. A Microscopic View of Laser Ablation. J Phys Chem B. 1998;102:2845–2853. [Google Scholar]
- 39.Knochenmuss R, Zhigilei L. Molecular Dynamics Model of Ultraviolet Matrix-Assisted Laser Desorption/Ionization Including Ionization Processes. Journal of Physical Chemistry B. 2005;109:22947–22957. doi: 10.1021/jp052945e. [DOI] [PubMed] [Google Scholar]
- 40.Knochenmuss R. A quantitative model of ultraviolet matrix-assisted laser desorption/ionization. Journal of Mass Spectrometry. 2002;37:867–877. doi: 10.1002/jms.349. [DOI] [PubMed] [Google Scholar]
- 41.Liu Z, Schey K. Optimization of a MALDI TOF-TOF Mass Spectrometer for Intact Protein Analysis. Journal of the American Society for Mass Spectrometry. 2005;16:482–490. doi: 10.1016/j.jasms.2004.12.018. [DOI] [PubMed] [Google Scholar]
- 42.Brown R, Lennon J. Sequence-Specific Fragmentation of Matrix-Assisted Laser Desorbed Protein/Peptide Ions. Analytical Chemistry. 1995;65:3990–3999. doi: 10.1021/ac00117a027. [DOI] [PubMed] [Google Scholar]
- 43.Takayama M. In Source Decay Characteristics of Peptides in Matrix Assisted Laser Desorption/Ionization Time-of-Flight Mass Spectrometry. Journal of the American Society for Mass Spectrometry. 2001;12:420–427. doi: 10.1016/S1044-0305(01)00218-5. [DOI] [PubMed] [Google Scholar]
- 44.Meot-Ner (Mautner) M, Dongre A, Somogyi A, Wysocki V. Thermal Decomposition Kinetics of Protonated Peptides and Peptide Dimers, and Comparison with Surface-Induced Dissociation. Rapid Communications in Mass Spectrometry. 1995;9:829–836. doi: 10.1002/rcm.1290090922. [DOI] [PubMed] [Google Scholar]
- 45.Speir J, Amster I. An Investigation of the Energetics of Peptide Ion Dissociation by Laser Desorption Chemical Ionization Fourier Transform Mass Spectrometry. Journal of the American Society for Mass Spectrometry. 1995;6:1069–1078. doi: 10.1016/1044-0305(95)00547-1. [DOI] [PubMed] [Google Scholar]
- 46.Dongre A, Somogyi A, Wysocki V. Surface-induced Dissociation: An Effective Tool to Probe Structure, Energetics and Fragmentation Mechanisms of Protonated Peptides. Journal of Mass Spectrometry. 1996;31:339–350. doi: 10.1002/(SICI)1096-9888(199604)31:4<339::AID-JMS322>3.0.CO;2-L. [DOI] [PubMed] [Google Scholar]
- 47.Schnier P, Price W, Strittmatter E, Williams E. Dissociation Energetics and Mechanisms of Leucine Enkephalin (M+H)+ and (2M+X)+ Ions (X=H,Li,Na,K and Rb) Measured by Blackbody Infrared Radiative Dissociation. Journal of the American Society for Mass Spectrometry. 1997;8:771–780. doi: 10.1016/S1044-0305(97)84129-3. [DOI] [PMC free article] [PubMed] [Google Scholar]
- 48.Hager J. Product ion spectral simplification using time-delayed fragment ion capture with tandem linear ion traps. Rapid Commun Mass Spectrom. 2003;17:1389–1398. doi: 10.1002/rcm.1061. [DOI] [PubMed] [Google Scholar]
- 49.Zhu X, Papayanopoulos I. Improvement in the Detection of Low Concentration Protein Digests on a MALDI TOF/TOF Workstation by Reducing α-Cyano-4-hydroxycinnamic Acid Adduct Ions. Journal of Biomolecular Techniques. 2003;14:298–307. [PMC free article] [PubMed] [Google Scholar]
- 50.Smirnov I, Zhu X, Taylor T, Huang Y, Ross P, Papayanopoulos I, Martin S, Pappin D. Suppression of α-Cyano-4-hydroxycinnamic Acid Matrix Clusters and Reduction of Chemical Noise in MALDI-TOF Mass Spectrometry. Analytical Chemistry. 2004;76:2958–2965. doi: 10.1021/ac035331j. [DOI] [PubMed] [Google Scholar]
- 51.Rakov V, Borisov O, Whitehouse C. Establishing Low Energy Sequential Decomposition Pathways of Leucine Enkephalin and Its N- and C-Terminus Fragments Using Multiple-Resonance CID in Quadrupolar Ion Guide. Journal of the American Society for Mass Spectrometry. 2004;15:1794–1809. doi: 10.1016/j.jasms.2004.06.020. [DOI] [PubMed] [Google Scholar]
- 52.Knochenmuss R. Photoionization Pathways and Free Electrons in UV-MALDI. Analytical Chemistry. 2004;76:3179–3184. doi: 10.1021/ac035501s. [DOI] [PubMed] [Google Scholar]
- 53.Knochenmuss R. Ion Formation Mechanisms in UV-MALDI. Analyst. 2006;131:966–986. doi: 10.1039/b605646f. [DOI] [PubMed] [Google Scholar]
- 54.Stein S. Personal communication.
- 55.Knochenmuss R, Zenobi R. MALDI Ionization: The Role of In-Plume Processes. Chemical Reviews. 2003;103:441–452. doi: 10.1021/cr0103773. [DOI] [PubMed] [Google Scholar]