Abstract
Objective
The aim of this study was to develop and compare two DXA-based four-compartment [body weight = body cell mass (BCM) + extracellular fluid (ECF) + extracellular solids (ECS) + fat] cellular level models.
Research Methods and Procedures
Total body potassium (TBK) model: BCM from TBK by whole-body counting—ECFTBK = LST − [BCMTBK + 0.73 × osseous mineral (Mo)]. Bromide model: ECF from sodium bromide dilution—BCMBROMIDE = LST − (ECFBROMIDE + 0.73 × Mo); Mo and LST measurements came from DXA. The two approaches were evaluated in 99 healthy men and 118 women.
Results
BCM estimates were highly correlated (r = 0.97, p < 0.001), as were ECF estimates (r = 0.87, p < 0.001); a small statistically significant mean difference was present (mean ± SD; BCMTBK model, 30.4 ± 8.9 kg; BCMBROMIDE, 31.4 ± 9.3 kg; Δ = 1.0 ± 2.8 kg; p < 0.001; ECFTBK, 18.5 ± 4.2 kg; ECFBROMIDE, 17.5 ± 3.6 kg; Δ = 1.0 ± 2.8 kg; p < 0.001). A high correlation (r = 0.97, p < 0.001) and good agreement (38.9 ± 9.5 vs. 38.9 ± 9.5 kg; Δ = 0.0 ± 2.4 kg; p = 0.39) were present between TBW, derived as the sum of intracellular water from TBK and ECW from bromide, and measured TBW by 2H2O dilution.
Discussion
Two developed four-compartment cellular level DXA models, one of which is appropriate for use in most clinical and research settings, provide comparable results and are applicable for BCM and ECF estimation of subject groups with hydration disturbances.
Keywords: whole body counting, nutritional assessment, DXA, body cell mass, bromide dilution
Introduction
There is growing interest in quantifying the effects of interventions, including pharmacological weight loss treatments, on components of body mass (1–3). An important, relatively new method of evaluating body composition is DXA (4). Widely available, DXA systems provide whole body and regional estimates of three main components: fat, lean soft tissue (LST),1 and osseous (i.e., bone) mineral (Mo) (5). The DXA method is being used increasingly to evaluate body composition in both small-scale clinical trials (6) and large epidemiological studies (7).
Although often used as a surrogate of metabolically active tissue mass (8), the LST component estimated by DXA actually consists of two main compartments, body cell mass (BCM) and extracellular fluid (ECF), along with a small amount of extracellular solids (ECS LST) (9). BCM is a large and metabolically active compartment that reflects the protoplasmic component of body mass (10) and is sensitive to changes in nutritional status (11) and the catabolic effects of disease (12). ECF is also a clinically important compartment but has no intrinsic metabolic activity such as oxygen consumption or heat production (13). Changes in LST mass estimated by DXA thus reflect the combined changes in BCM and ECF, with their very different underlying physiological and pathological implications.
Both BCM and ECF can be quantified in vivo by currently available methods (14,15). Total body potassium (TBK) is almost entirely distributed in the intra-cellular compartment, with only ~2% of TBK found in ECF and ECS (14,16). The intracellular concentration of potassium is relatively stable, and, therefore, TBK can be used to estimate BCM, as described by Moore et al. (12), Cohn et al. (14), and Wang et al. (10). Whole body counting for naturally occurring 40K can be used to estimate TBK (17), and combining DXA with whole body 40K counting measurements would thus provide a new approach for estimating the cellular level of body composition as fat, BCM, ECF, and ECS. However, there are now only ~30 40K analytical systems worldwide, and the instrument is costly to purchase and maintain (18). Thus, in this study, we developed an alternative method for estimating BCM by combining extracellular water (ECW) and DXA measurements. The ECW compartment can be measured by the tracer dilution method, the most widely used being non-radioactive bromide (15). The bromide dilution method for estimating ECW, and thereby ECF, is easy to carry out and relatively inexpensive. Once ECF is known, BCM can be calculated as the difference between DXA-measured LST mass and ECF, with a small correction for the ECS LST compartment. The ECS LST can be derived from DXA-measured Mo as reported by Wang et al. (19). This new approach, combining DXA and bromide dilution methods, thus represents a second and more practical strategy for creating a four-compartment cellular level body composition model.
The primary aim of this study was to develop a four-compartment cellular level model for estimating BCM with DXA and bromide dilution methods and to validate the BCM estimates of the developed model against BCM estimates by whole-body 40K counting. A second aim was to compare ECF estimates by the two models for the purpose of establishing method comparability.
Research Methods and Procedures
Experimental Design and Models
The four-compartment model under study is summarized by the equation:
| (1) |
BCM (in kilograms), using 40K, served as the reference method (TBK model) and was estimated as previously described (10):
| (2) |
The proposed new model requires measures of fat and ECS. Fat was measured by DXA using the conventional system software and protocol. The ECS component was calculated from DXA-measured Mo, assuming a relatively stable relationship between the two (19):
| (3) |
The portion of ECS in LST is thus equal to 0.73 × Mo.
Thus, because
| (4) |
only an estimate of ECF remains to be acquired to calculate BCM.
ECW was derived from the bromide dilution space (15). ECF was calculated from ECW as (20):
| (5) |
BCM was derived as (bromide model):
| (6) |
These two models differ in cost and availability. Both models share fat and ECS LST estimates by DXA. The TBK model, the more costly and less available model for clinical studies, is based on BCM estimates by TBK. According to this model, ECF can be calculated by rearranging Equation 4 as
| (7) |
The bromide model, the simpler and more practical model, is based on ECW and ECF as derived by bromide dilution. Equation 6 is used to estimate BCM.
The TBK estimates from whole body counting and ECW estimates from bromide dilution provided the opportunity to compare common elements of both models. The TBK model is based on the assumption that intracellular water (ICW) has a potassium concentration of 152 mM (16). Thus, the sum of ICW calculated from TBK and ECW from bromide dilution should provide an estimate of total body water (TBW). Accordingly, we compared TBW, calculated as the sum of ICW and ECW, to TBW measured by deuterium dilution.
Subjects
Two hundred seventeen subjects (99 men and 118 women) were recruited through newspaper advertisements and from the local community. Subjects were included if they were healthy, as defined by medical history, physical examination, and screening blood studies. The study was limited to subjects with a BMI < 35 kg/m2. The project was approved by the Institutional Review Board of St. Luke’s-Roosevelt Hospital (New York, NY), and all subjects signed an informed consent before participation. Each subject completed four evaluations on the same day: DXA, bromide dilution, deuterium dilution, and whole-body 40K counting.
Body Composition
Anthropometric Measurements
Anthropometric measurements were made with all subjects clothed in a hospital gown. The subject’s body weight was measured to the nearest 0.01 kg using a Weight-Tronix electronic scale (Scale Electronics Development, New York, NY). Standing height was measured without shoes to the nearest 10 mm with a wall-mounted Holtain stadiometer (Cross-well, Wales, United Kingdom).
Whole Body Counting
The St. Luke’s 4π whole-body counter was used to detect the natural 1.46-MeV γ-ray of 40K as previously reported (21). The 40K counts accumulated over 9 minutes were adjusted for body size on the basis of a 42K calibration formula reported by Pierson et al. (21). Total body potassium was calculated as 40K/0.000118, as suggested by Forbes (22) and Ellis (23). The technical error in our laboratory for repeated counting of a 40K phantom is 2.4% (24).
DXA
DXA was used to measure fat, LST, and Mo. The scan was completed with a whole body pencil beam DPX system (version 3.6 software; GE Lunar Radiation Corp., Madison, WI). Detailed methods for image acquisition are described elsewhere (9). The DXA system coefficient of variations are 0.5% for Mo and 0.8% for LST (25).
Bromide Dilution
The subject was asked to drink 5 grams of a 4 M solution of NaBr. The NaBr concentration in plasma was measured by high-performance liquid chromatography before and 3 hours after tracer administration. The volume of ECW was estimated as:
| (8) |
where 0.90 is a correction factor for intracellular bromide (Br−), found mainly in red blood cells, and 0.95 is the Donnan equilibrium factor (26). The within-person between-day technical error for NaBr dilution is 2.9% for healthy control subjects in our laboratory (15).
Deuterium Dilution (2H2O)
The deuterium space and TBW were measured as previously described (27). The within-person between-day technical error for deuterium space measurement is 1.2% for healthy control subjects in our laboratory. The deuterium space was converted into TBW mass by correcting for non-aqueous hydrogen exchange and water density at 36 °C (TBW = dilution space × 0.96 × 0.994) (26).
Statistical Methods
The agreement in BCM estimates by the two methods was examined using simple linear regression analysis, comparison of group mean values by paired Student’s t tests, and the use of Bland-Altman analysis (28). Because both models include ECF, we also compared these estimates using similar statistical methods. Additionally, we also compared TBW calculated as ICW (by TBK) + ECW (by bromide) with TBW estimated from deuterium using similar statistical methods.
Group data are expressed as mean ± SD. Data were analyzed using SPSS version 10.0 (SPSS, Chicago, IL), and statistical significance was set at p < 0.05.
Results
Subjects
The group of 217 subjects (Table 1) as a whole was ethnically diverse, with 17 African Americans, 56 Asians, 116 whites, and 28 Hispanics. The baseline DXA and whole body counting TBK data are also summarized in Table 1.
Table 1.
Subject characteristics
| Men | Women | All | |
|---|---|---|---|
| Number | 99 | 118 | 217 |
| Age (years) | 35.6 ± 14.4 | 41.1 ± 15.9 | 38.6 ± 15.4 |
| Weight (kg) | 79.5 ± 13.0 | 62.5 ± 11.6 | 70.3 ± 14.9 |
| Height (cm) | 175.5 ± 7.3 | 162.7 ± 7.0 | 168.5 ± 9.6 |
| BMI (kg/m2) | 25.8 ± 3.7 | 23.6 ± 4.1 | 24.6 ± 4.0 |
| Mo (kg) | 3.25 ± 0.51 | 2.42 ± 0.39 | 2.80 ± 6.10 |
| ECW (liter)* | 19.7 ± 2.9 | 15.1 ± 2.6 | 17.2 ± 3.6 |
| LST (kg) | 61.7 ± 9.5 | 41.9 ± 6.3 | 50.9 ± 12.6 |
| TBK (mmol) | 4151 ± 721 | 2589 ± 431 | 3302 ± 972 |
| TBW (kg)† | 46.6 ± 7.5 | 32.4 ± 5.2 | 38.9 ± 9.5 |
Values are means ± SD.
ECW was measured by bromide dilution.
TBW was measured by deuterium dilution.
Body Composition Results
The results of the two four-compartment models are presented in Table 2. The same values for total body fat and ECS LST are used in both models.
Table 2.
Results of four-component cellular level model estimates
| Component (kg) | Males | Females | All |
|---|---|---|---|
| Fat | 14.8 ± 0.8 | 18.5 ± 1.0 | 16.8 ± 9.4 |
| ECS | 5.86 ± 0.92 | 4.36 ± 0.69 | 5.04 ± 1.10 |
| BCM (TBK model) | 38.2 ± 6.6 | 23.8 ± 4.0 | 30.4 ± 8.9 |
| BCM (bromide model) | 39.2 ± 7.1* | 24.7 ± 4.6* | 31.4 ± 9.3* |
| ΔBCM | 1.0 ± 3.3 | 0.9 ± 2.4 | 1.0 ± 2.8 |
| ECF (TBK model) | 21.1 ± 4.0 | 16.3 ± 3.0 | 18.5 ± 4.2 |
| ECF (bromide model) | 20.1 ± 3.0* | 15.4 ± 2.6* | 17.5 ± 3.6* |
| ΔECF | 1.0 ± 3.3 | 0.9 ± 2.4 | 1.0 ± 2.8 |
Values are means ± SD.
Significantly different from TBK model at p < 0.001.
BCM estimates from the bromide model showed small (~1 kg) but statistically significant differences from corresponding BCM estimates using 40K counting (TBK model; Table 2). BCM estimates from the bromide model for men and women combined were highly correlated with BCM estimates from 40K counting (r = 0.97, p < 0.001; regression slope vs. 1.0 not significantly different; intercept = 1.25, p = 0.07; Figure 1). The SE of this regression equation was 2.84 kg. Bland-Altman analysis failed to disclose a significant bias between BCM estimates by the two models in relation to the mean values (r = 0.13, p = 0.06; Figure 2). The regression equation of BCM by TBK from BCM by bromide dilution is BCMTBK = 0.92 × BCMBROMIDE + 1.67.
Figure 1.
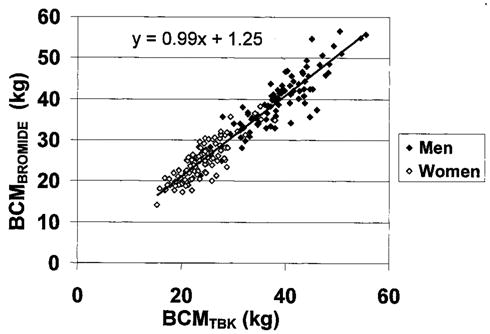
BCM estimated by bromide model vs. BMC estimated by TBK. The regression line and equation are presented (r = 0.97, p < 0.001; regression slope vs. 1.0, not significantly different; intercept, p = 0.07).
Figure 2.
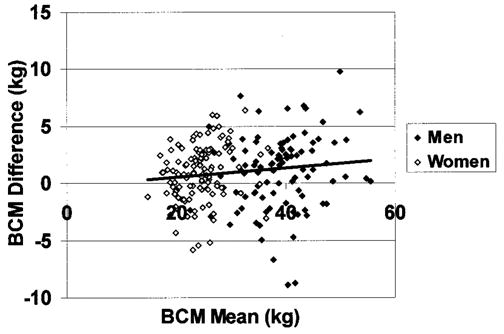
Differences between the two BCM estimation methods (BCMBROMIDE − BCMTBK) vs. mean of the two methods. The regression line is presented (r = 0.13, p = 0.06).
ECF from the TBK model showed small (~1 kg) but significant differences from corresponding ECF estimates by the bromide model (Table 2). ECF estimates from the TBK model for men and women combined were correlated with ECF estimates from bromide dilution (r = 0.87, p < 0.001; regression slope is significantly different from 1.0, p < 0.05; intercept = −2.16, p < 0.001; Figure 3). The SE of this regression equation was 2.80 kg. Bland-Altman analysis disclosed a small but significant bias between ECF estimates by the two models (r = 0.23, p < 0.001; Figure 4).
Figure 3.
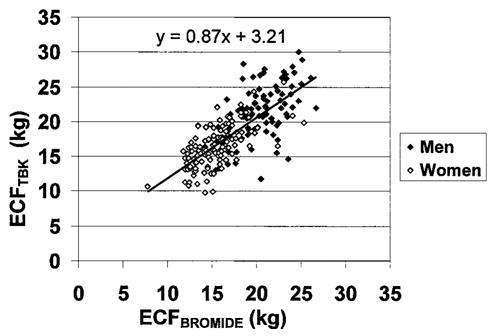
ECF estimated by TBK model vs. ECF estimated by bromide dilution. The regression line and equation are presented (r = 0.87, p < 0.001; regression slope is significantly different from 1.0, p < 0.05; intercept, p < 0.001).
Figure 4.
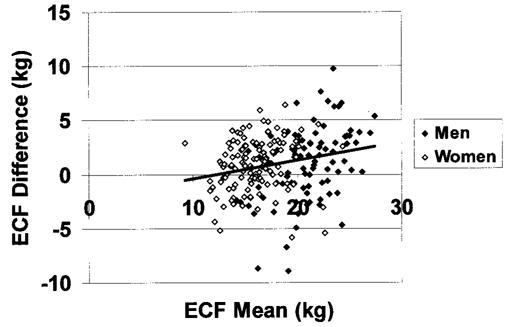
Differences between the two ECF estimation methods (ECFTBK − ECFBROMIDE) vs. mean of the two methods. The regression line is presented (r = 0.23, p < 0.001).
TBW calculated as ICW (by TBK) + ECW (by bromide dilution) did not differ significantly from TBW estimates using the 2H2O dilution method (men, 47.0 ± 7.2 vs. 46.5 ± 7.5 kg, Δ = 0.4 ± 2.8 kg, p = 0.10; women, 33.0 ± 5.0 vs. 32.1 ± 4.9 kg, Δ = 0.2 ± 2.0 kg, p = 0.12). TBW estimates by ICW + ECW for men and women combined were highly correlated with TBW estimates from 2H2O dilution (r = 0.97, p < 0.001; regression slope vs. 1.0 not significantly different; intercept = 1.13, p = 0.10; Figure 5). The SE of this regression equation was 2.38 kg. Bland-Altman analysis failed to disclose a significant bias between TBW estimates by the two methods (r = 0.01, p = 0.83; Figure 6).
Figure 5.
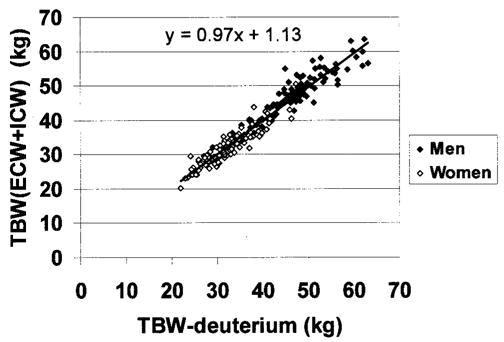
TBW estimated from the sum of ECW and ICW vs. TBW by deuterium dilution. The regression line and equations are presented (r = 0.97, p < 0.001; regression slope vs. 1.0 not significantly different; intercept, p = 0.10).
Figure 6.
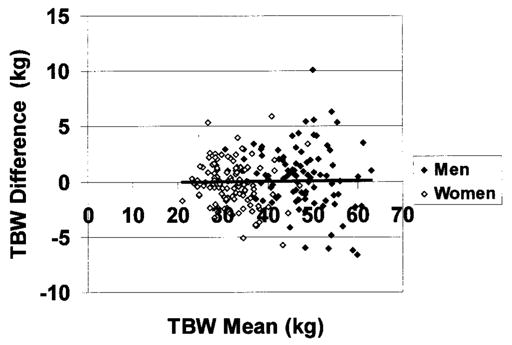
Differences between the two TBW estimation methods [ICW (by TBK) + ECW (by bromide) − TBW estimated from deuterium] vs. mean of the two methods. The regression line is presented (r = 0.01, p = 0.83).
Discussion
The two photon energy levels of DXA systems allow partitioning of body mass into three molecular level components: fat, LST, and Mo (5,29). By adding one more measurement, either TBK or the bromide dilution space, we are able to create a cellular level four-compartment model. The impetus for expanding the three-compartment model was provided by reports of LST and ECF changes independent of cell mass with aging (9), weight loss (30), and treatment with pharmacological agents such as thiazolidinediones (31). LST is often assumed to be metabolically homogeneous or directly proportional to protein mass (32), but changes in the relative contribution of fluid to this compartment may lead to inaccurate interpretations if anabolic or catabolic effects are involved.
The main strategy of our two alternate models is the use of either TBK or bromide dilution space combined with DXA estimates to derive the BCM, ECF, and ECS portions of LST. Our findings indicate that BCM estimates by bromide dilution/DXA are highly correlated with the BCM-derived TBK reference method, and the slope of this association does not differ significantly from 1. Although a small but significant difference was detected between BCM by bromide dilution/DXA and BCM by TBK, there was no significant bias with greater BCM, as established by Bland-Altman analysis.
The small between-method systematic difference could be the result of a number of assumptions used to develop the two models. The observed between-method differences could arise from small errors in any one of the assumptions of the two models. Nevertheless, the high correlation indicates excellent agreement between the two models in the relative ranking of individuals or groups with respect to amount of BCM. We would expect this high level of agreement to remain in studies of BCM changes over time, although longitudinal data are needed for confirmation of this prediction.
There was also a good association observed between the two ECF estimates, although a small significant bias was detected, with larger differences observed at higher levels of ECF. On average, BCM was ~1 kg larger and ECF was ~1 kg smaller by the bromide model compared with the TBK model. Although we cannot specifically account for the cause of ECF bias, variation between ECF measurement methods is well recognized (22). ECW is particularly complex to measure using specific markers, because at least four different components are included in the measured dilution space—plasma water, interstitial water (i.e., water in the lymphatic system), dense connective tissue water (e.g., water in bone, cartilage, etc.), and transcellular water, a varied group of excretory ECWs including bile, gastrointestinal secretions, and cerebrospinal fluids components (33). This may account for why ECW markers vary in their volume of distribution, and bromide is known to provide a larger ECW volume compared with some of the other available markers (11). While the between-model compartmental differences are small, longitudinal studies should use the same model and methods over time. Also, compartmental size estimates by the two different models would not be directly comparable across studies using different models. The equation BCMTBK = 0.92 × BCMBROMIDE + 1.67 can be used for converting bromide-derived BCM to TBK-derived BCM for those wishing to compare their results to earlier research.
Most major medical centers and research programs now have DXA systems, and bromide dilution is easy to carry out, even in remote settings (15). This approach to the four-compartment cellular level model would thus be practical and affordable compared with the alternative TBK approach. An important proviso is that DXA systems vary in body composition estimates across instruments from the same (34) and different (35) manufacturers. Similarly, bromide measurements are also variable between laboratories, and the suggested DXA-bromide model should, therefore, be applied within a single center or between centers in which the methods are carefully cross-calibrated.
Model and Measurement Error
The two developed modeling approaches have associated model and measurement errors. The TBK-BCM model is based on the assumption that intracellular fluid has a constant potassium concentration (10). According to this model, the fraction of BCM as ICW is 0.70, [K]ICW = 152 mmol/kg, [K]ECW = 4 mmol/kg, and mean ECW/ICW = 0.95.
Thus,
| (9) |
These physiological relationships all tend to be stable in healthy subjects but can be altered by some diseases (10). However, even with a 50% change in ECW/ICW, the BCM measurement is altered by only ~1%. Thus, it is reasonable to conclude that the TBK-BCM model is very stable when intracellular hydration and potassium concentrations are within their physiological ranges.
The DXA and bromide dilution methods used in deriving BCM include more assumptions than the TBK method. The individual variation in DXA systems on LST estimates is an important cause of the error. The measurement of LST by DXA assumes a relatively stable fat-free mass hydration (36). DXA systems also cannot accurately distinguish between bone and soft tissue composition in the chest due to large amounts of bone (36). Models and assumptions are required to overcome the effects of the limited number of bone-free pixels in the chest, and small measurement errors can influence the LST and Mo estimates required in our model. DXA is also used to estimate ECS LST from bone mineral measurements, and the evaluation of bone is the primary clinical use of DXA (37). However, the assumption that ECS is directly proportional to Mo is not well validated, and individual variation in the ECS/Mo relationship can be anticipated.
With respect to bromide dilution, the volume of distribution is adjusted for the Donnan correction factor and intra-cellular bromide penetration to arrive at an ECW estimate (26), thus adding several assumptions to the final derived value for ECF. These two adjustments to the bromide dilution space may also contribute to the observed bias when comparing our results to ECF estimates from the TBK model.
Considering measurement error for the TBK model, only TBK is required, and the error can be calculated as:
| (10) |
For the bromide model, the LST, ECW, and Mo measurement precisions are 0.8%, 2.9%, and 0.5%, respectively, and the propagated error can be calculated as:
| (11) |
These calculations reveal that the ECF estimate for the bromide model is a major source of measurement error. The propagated BCM measurement error (σBCM) for the bromide model is 0.66 kg for healthy subjects. Therefore, the BCM measurement errors for the two models are comparable.
The calculated ECF error estimates for the bromide and TBK models are 0.52 and 0.89 kg, respectively. Although the absolute ECF error is comparable with that of BCM (i.e., 0.73 and 0.66 kg), the total ECF mass is much smaller than that of BCM (i.e., ~18 vs. ~31 kg), and it, therefore, could be anticipated that the error of the two model ECF measurements would differ from each other.
The calculated errors of ECW + ICW and TBW from deuterium dilution are 0.47 and 0.73 kg, respectively. Because the TBW mass is larger than either BCM or ECF (i.e., ~39 vs. ~31 or ~18 kg), the agreement between these two TBW estimates is very good. TBW derived as the sum of ECW and ICW was identical to TBW measured independently by deuterium dilution (38.9 ± 9.5 vs. 38.9 ± 9.5 kg).
Thus, even though several assumptions are involved in their derivation, BCM and ECF estimates derived by the two different models agreed well with each other, as did the sum of ECW by bromide dilution and ICW by TBK and TBW by deuterium dilution. Small deviations in these assumptions from actual relations in vivo may account for the differences in BCM and ECF observed for the two models.
Applications
Evaluating and monitoring fluid and cellular compartments is critical to both weight loss interventions for obese subjects and weight gain interventions for emaciated patients, such as those with anorexia nervosa, HIV infection, and advanced cancer. Although fat-free mass is generally proportional to BCM, this may not be the case with some interventions, including drug treatments that alter fluid distribution, such as growth hormone and insulin-like growth factor-1 (38–40). An increase in LST with growth hormone or insulin-like growth factor-1 treatment would, therefore, not necessarily reflect an anabolic increase in cell mass or protein. BCM is an important component when evaluating conditions such as Cushing’s syndrome (41). However, LST, including both ECF and BCM, may not reliably reflect metabolically active tissue because of fluid retention in the presence of high cortisol levels (41) or with corticosteroid treatments (42). BCM has been used in evaluating energy metabolism in clinical practice (43) and research studies (44), especially when monitoring anabolic treatment effects of drugs (e.g., oxymetholone) (45). Our proposed four-compartment models may prove useful in a wide range of research applications.
Generally, both models should be used cautiously for individual subjects because of the relatively large errors observed in some subjects (see Figures 2 and 4), although the approaches should be reliable when applied in healthy adults, because the assumptions involved are not influenced to a measurable degree by usual physiological processes. However, in the presence of disease or with interventions, there may be situations in which one of the models is less reliable than the other. Investigators should consider the specific model assumptions when applying these models outside of the healthy population.
Conclusions
The increasing reliance on DXA body composition analysis for metabolic phenotyping led us to seek means by which LST could be partitioned into cellular level components BCM, ECF, and ECS LST. Our findings support the comparability of two models differing in their cost and availability to investigators. These approaches have the potential to give new insight into between-subject metabolic differences and responses to interventions, particularly in the presence of altered tissue hydration. Finally, the bromide model is relatively simple to develop in most clinical and research settings and, thus, creates new opportunities for cellular level body composition research.
Acknowledgments
This study was supported by National Institutes of Health Grants RR00645 and NIDDK 42618.
Nonstandard abbreviations
- LST
lean soft tissue
- Mo
osseus mineral
- BCM
body cell mass
- ECF
extracellular fluid
- ECS
extracellular solids
- ECW
extracellular water
- TBK
total body potassium
- ICW
intracellular water
- TBW
total body water
- [BR]PLASMA
plasma bromide
- σBCM
propagated BCM measurement error
References
- 1.Muller MJ, Bosy-Westphal A, Kutzner D, Heller M. Metabolically active components of fat-free mass and resting energy expenditure in humans: recent lessons from imaging technologies. Obes Rev. 2002;3:113–22. doi: 10.1046/j.1467-789x.2002.00057.x. [DOI] [PubMed] [Google Scholar]
- 2.Ellis KJ. Selected body composition methods can be used in field studies. J Nutr. 2001;131:1589S–95S. doi: 10.1093/jn/131.5.1589S. [DOI] [PubMed] [Google Scholar]
- 3.Engelson ES. HIV lipodystrophy diagnosis and management. Body composition and metabolic alterations: diagnosis and management. AIDS Read. 2003;13:S10–4. [PubMed] [Google Scholar]
- 4.Albanese CV, Diessel E, Genant HK. Clinical applications of body composition measurements using DXA. J Clin Densitom. 2003;6:75–85. doi: 10.1385/jcd:6:2:75. [DOI] [PubMed] [Google Scholar]
- 5.Pietrobelli A, Formica C, Wang Z, Heymsfield SB. Dual-energy X-ray absorptiometry body composition model: review of physical concepts. Am J Physiol. 1996;271:E941–51. doi: 10.1152/ajpendo.1996.271.6.E941. [DOI] [PubMed] [Google Scholar]
- 6.Ionescu AA, Evans WD, Pettit RJ, et al. Hidden depletion of fat-free mass and bone mineral density in adults with cystic fibrosis. Chest. 2003;124:2220–8. doi: 10.1378/chest.124.6.2220. [DOI] [PubMed] [Google Scholar]
- 7.Schuit SC, van der Klift M, Weel AE, et al. Fracture incidence and association with bone mineral density in elderly men and women: the Rotterdam Study. Bone. 2004;34:195–202. doi: 10.1016/j.bone.2003.10.001. [DOI] [PubMed] [Google Scholar]
- 8.Wang Z, Heshka S, Zhang K, et al. Resting energy expenditure: systematic organization and critique of prediction methods. Obes Res. 2001;9:331–6. doi: 10.1038/oby.2001.42. [DOI] [PubMed] [Google Scholar]
- 9.St-Onge MP, Wang J, Shen W, et al. Dual-energy x-ray absorptiometry-measured lean soft tissue mass: differing relation to body cell mass across the adult life span. J Gerontol A Biol Sci Med Sci. 2004;59:796–800. doi: 10.1093/gerona/59.8.b796. [DOI] [PubMed] [Google Scholar]
- 10.Wang Z, St-Onge MP, Lecumberri B, et al. Body cell mass: model development and validation at the cellular level of body composition. Am J Physiol Endocrinol Metab. 2004;286:E123–8. doi: 10.1152/ajpendo.00227.2003. [DOI] [PubMed] [Google Scholar]
- 11.Forbes GB. Human Body Composition, Growth, Aging, Nutrition, and Activity. New York: Springer-Verlag; 1987. Influence of nutrition; pp. 209–47. [Google Scholar]
- 12.Moore FD, Olsen KH, McMurray JD, et al. The Body Cell Mass and Its Supporting Environment: Body Composition in Health and Disease. Philadelphia, PA: WB Saunders; 1963. [Google Scholar]
- 13.Wang ZM, Pierson RNJ, Heymsfield SB. The five level model: a new approach to organizing body composition research. Am J Clin Nutr. 1992;56:19–28. doi: 10.1093/ajcn/56.1.19. [DOI] [PubMed] [Google Scholar]
- 14.Cohn SH, Vaswani AN, Yasumura S, et al. Assessment of cellular mass and lean body mass by non-invasive nuclear techniques. J Lab Clin Med. 1985;105:305–11. [PubMed] [Google Scholar]
- 15.Kim J, Wang Z, Gallagher D, et al. Extracellular water: sodium bromide dilution estimates compared with other markers in patients with acquired immunodeficiency syndrome. J Parenter Enter Nutr. 1999;23:61–6. doi: 10.1177/014860719902300261. [DOI] [PubMed] [Google Scholar]
- 16.Maffly RH. Anatomy of body water and electrolytes. In: Brenner BM, Rector FCJ, editors. The Kidney. Philadelphia, PA: W.B. Saunders; 1976. pp. 75–88. [Google Scholar]
- 17.Cohn SH, Vartsky D, Yasumura S, et al. Indexes of body cell mass: nitrogen versus potassium. Am J Physiol. 1983;244:E305–10. doi: 10.1152/ajpendo.1983.244.3.E305. [DOI] [PubMed] [Google Scholar]
- 18.Wang Z, Zhu S, Wang J, et al. Whole-body skeletal muscle mass: development and validation of total-body potassium prediction models. Am J Clin Nutr. 2003;77:76–82. doi: 10.1093/ajcn/77.1.76. [DOI] [PubMed] [Google Scholar]
- 19.Wang ZM, Shen W, Kotler DP, et al. Total-body protein: a new cellular level mass and distribution prediction model. Am J Clin Nutr. 2003;78:979–84. doi: 10.1093/ajcn/78.5.979. [DOI] [PubMed] [Google Scholar]
- 20.Wang J, Thornton JC, Bari S, et al. Comparisons of waist circumferences measured at 4 sites. Am J Clin Nutr. 2003;77:379–84. doi: 10.1093/ajcn/77.2.379. [DOI] [PubMed] [Google Scholar]
- 21.Pierson RNJ, Wang J, Thornton JC, et al. Body potassium by four-pi 40K counting: an anthropometric correction. Am J Physiol. 1984;246:F234–9. doi: 10.1152/ajprenal.1984.246.2.F234. [DOI] [PubMed] [Google Scholar]
- 22.Forbes GB. Human Body Composition, Growth, Aging, Nutrition, and Activity. New York: Springer-Verlag; 1987. Techniques for estimating body composition; pp. 5–100. [Google Scholar]
- 23.Ellis KJ. Whole-body counting and neutron activation analysis. In: Roche AF, Heymsfield SB, Lohman TG, editors. Human Body Composition. Champaign, IL: Human Kinetics; 1996. pp. 45–62. [Google Scholar]
- 24.Gallagher D, Belmonte D, Deurenberg P, et al. Organ-tissue mass measurement allows modeling of REE and metabolically active tissue mass. Am J Physiol. 1998;275:E249–58. doi: 10.1152/ajpendo.1998.275.2.E249. [DOI] [PubMed] [Google Scholar]
- 25.Russell-Aulet M, Wang J, Thornton J, Pierson RNJ. Comparison of dual-photon absorptiometry systems for total-body bone and soft tissue measurements: dual-energy X-rays versus gadolinium 153. J Bone Miner Res. 1991;6:411–5. doi: 10.1002/jbmr.5650060413. [DOI] [PubMed] [Google Scholar]
- 26.Schoeller DA. Hydrometry. In: Roche AF, Heymsfield SB, Lohman TG, editors. Human Body Composition. Champaign, IL: Human Kinetics; 1996. pp. 25–43. [Google Scholar]
- 27.Ma K, Kotler DP, Wang J, et al. Reliability of in vivo neutron activation analysis for measuring body composition: comparisons with tracer dilution and dual-energy x-ray absorptiometry. J Lab Clin Med. 1996;127:420–7. doi: 10.1016/s0022-2143(96)90058-x. [DOI] [PubMed] [Google Scholar]
- 28.Bland JM, Altman DG. Statistical methods for assessing agreement between two methods of clinical measurement. Lancet. 1986;1:307–10. [PubMed] [Google Scholar]
- 29.Pietrobelli A, Wang ZM, Formica C, Heymsfield SB. Dual-energy X-ray absorptiometry: fat estimation error due to variation in soft tissue hydration. Am J Physiol. 1998;274:E808–16. doi: 10.1152/ajpendo.1998.274.5.E808. [DOI] [PubMed] [Google Scholar]
- 30.Leone PA, Gallagher D, Wang J, Heymsfield SB. Relative overhydration of fat-free mass in postobese versus never-obese subjects. Ann N Y Acad Sci. 2000;904:514–9. doi: 10.1111/j.1749-6632.2000.tb06508.x. [DOI] [PubMed] [Google Scholar]
- 31.Hollenberg NK. Considerations for management of fluid dynamic issues associated with thiazolidinediones. Am J Med. 2003;8:111S–5S. doi: 10.1016/j.amjmed.2003.09.018. [DOI] [PubMed] [Google Scholar]
- 32.Heymsfield SB, Gallagher D, Kotler DP, et al. Body-size dependence of resting energy expenditure can be attributed to non-energetic homogeneity of fat-free mass. Am J Physiol Endocrinol Metab. 2002;282:E132–8. doi: 10.1152/ajpendo.2002.282.1.E132. [DOI] [PubMed] [Google Scholar]
- 33.Edelman I, Leibman J. Anatomy of body water and electrolytes. Am J Med. 1959;27:256–77. doi: 10.1016/0002-9343(59)90346-8. [DOI] [PubMed] [Google Scholar]
- 34.Economos CD, Nelson ME, Fiatarone MA, et al. A multi-center comparison of dual energy X-ray absorptiometers: in vivo and in vitro soft tissue measurement. Eur J Clin Nutr. 1997;51:312–7. doi: 10.1038/sj.ejcn.1600400. [DOI] [PubMed] [Google Scholar]
- 35.Gillette-Guyonnet S, Andrieu S, Nourhashemi F, et al. Comparison of bone mineral density and body composition measurements in women obtained from two DXA instruments. Mech Ageing Dev. 2003;124:317–21. doi: 10.1016/s0047-6374(02)00199-9. [DOI] [PubMed] [Google Scholar]
- 36.Roubenoff R, Kehayias JJ, Dawson-Hughes B, Heymsfield SB. Use of dual-energy x-ray absorptiometry in body-composition studies: not yet a “gold standard”. Am J Clin Nutr. 1993;58:589–91. doi: 10.1093/ajcn/58.5.589. [DOI] [PubMed] [Google Scholar]
- 37.Mazess RB, Barden HS, Bisek JP, Hanson J. Dual-energy x-ray absorptiometry for total-body and regional bone-mineral and soft-tissue composition. Am J Clin Nutr. 1990;51:1106–12. doi: 10.1093/ajcn/51.6.1106. [DOI] [PubMed] [Google Scholar]
- 38.Lampit M, Nave T, Hochberg Z. Water and sodium retention during short-term administration of growth hormone to short normal children. Horm Res. 1998;50:83–8. doi: 10.1159/000023239. [DOI] [PubMed] [Google Scholar]
- 39.Moller J, Nielsen S, Hansen TK. Growth hormone and fluid retention. Horm Res. 1999;51:116–20. doi: 10.1159/000053173. [DOI] [PubMed] [Google Scholar]
- 40.Moller J, Jorgensen JO, Marqversen J, Frandsen E. Insulin-like growth factor I administration induces fluid and sodium retention in healthy adults: possible involvement of renin and atrial natriuretic factor. Clin Endocrinol (Oxf) 2000;52:181–6. doi: 10.1046/j.1365-2265.2000.00931.x. [DOI] [PubMed] [Google Scholar]
- 41.Pirlich M, Biering H, Gerl H, et al. Loss of body cell mass in Cushing’s syndrome: effect of treatment. J Clin Endocrinol Metab. 2002;87:1078–84. doi: 10.1210/jcem.87.3.8321. [DOI] [PubMed] [Google Scholar]
- 42.Lindholm B. Body cell mass during long-term cortisone treatment in asthmatic subjects. Acta Endocrinol (Copenh) 1967;55:202–21. doi: 10.1530/acta.0.0550202. [DOI] [PubMed] [Google Scholar]
- 43.Plauth M, Schutz T, Buckendahl DP, et al. Weight gain after transjugular intrahepatic portosystemic shunt is associated with improvement in body composition in malnourished patients with cirrhosis and hypermetabolism. J Hepatol. 2004;40:228–33. doi: 10.1016/j.jhep.2003.10.011. [DOI] [PubMed] [Google Scholar]
- 44.Walsmith J, Abad L, Kehayias J, Roubenoff R. Tumor necrosis factor-alpha production is associated with less body cell mass in women with rheumatoid arthritis. J Rheumatol. 2004;31:23–9. [PubMed] [Google Scholar]
- 45.Hengge UR, Stocks K, Faulkner S, et al. Oxymetholone for the treatment of HIV-wasting: a double-blind, randomized, placebo-controlled phase III trial in eugonadal men and women. HIV Clin Trials. 2003;4:150–63. doi: 10.1310/hct.2003.4.3.002. [DOI] [PubMed] [Google Scholar]


