

Abstract
Despite the widespread use of the nociceptive flexion reflex (NFR) paradigm in clinical and experimental pain research, there is currently no consensus on how best to define NFR threshold. Accordingly, the present studies were designed to assess the accuracy and reliability of different NFR threshold scoring criteria. Study 1 compared 13 scoring criteria in their accuracy for identifying the presence of the NFR, then generated empirically derived cut-points for the best criteria, and examined the test-retest reliability of NFR thresholds derived from these cut-points. Study 2 evaluated the replicability of these findings in an independent sample. Results from the two studies suggested that standardized peak (NFR Interval Peak z score) and mean (NFR Interval z score) biceps femoris electromyogram (EMG) activity were accurate and reliable criteria for defining NFR threshold. Acknowledging that cut-points may need to be adjusted for different research designs, graphs depicting sensitivity and specificity across a range of cut-points have been provided to facilitate researcher’s decision-making. It is hoped that the results of these studies will promote a standard NFR threshold assessment methodology, and further encourage the application of the NFR paradigm in the investigation of mechanisms and characteristics of both painful and non-painful diseases.
Keywords: Nociceptive flexion reflex, RIII, threshold, measurement, Receiver operating characteristics
1. Introduction
The nociceptive flexion reflex (NFR) paradigm is widely used in pain research to investigate pharmacological modulation of nociception, spinal and supraspinal influences on nociception, and individual differences in nociceptive processing in participants with and without pain disorders (Skljarevski and Ramadan, 2002; Sandrini et al., 2005). The NFR is a polysynaptic spinal withdrawal reflex that is elicited following activation of nociceptive A-delta afferents. To assess the NFR, biceps femoris muscle activity is monitored using electromyogram (EMG) during the application of varying intensities of electrocutaneous stimulation to the ipsilateral sural nerve. Based on the observed EMG response, intensity of stimulation required to elicit the NFR is used as an objective index of nociceptive threshold (Skljarevski and Ramadan, 2002; Sandrini et al., 2005). Prior research has demonstrated that NFR threshold is often highly correlated with subjective pain threshold (Willer, 1977; Willer et al., 1979; Chan and Dallaire, 1989; Guieu et al., 1992) and the magnitude of the reflex response is related to intensity of perceived pain (Willer et al., 1979; Chan and Dallaire, 1989; Rhudy et al., 2005).
Despite the popularity of the NFR paradigm in clinical and experimental pain research, there is no consensus on how best to define NFR threshold. Following a procedure first proposed by Willer (1977), recent reviewers have noted the NFR threshold is defined as the intensity of stimulation required to elicit a stable response at a rate of 60–90% in a series of approximately 20 stimuli (Skljarevski and Ramadan, 2002; Sandrini et al., 2005). Although this definition provides some direction, it does not provide the detail required to ensure accurate replication. As a result, various researchers have developed unique definitions that vary in terms of minimum EMG criteria, required duration of EMG activation, and post-stimulation response window (e.g., Boureau et al., 1991; Andersen et al., 2000; Desmeules et al., 2003; Banic et al., 2004; Terkelsen et al., 2004). Other researchers (e.g., Edwards et al., 2001; France et al., 2002a; France et al., 2002b; France et al., 2005; Rhudy et al., 2005) have used standardized criteria that stipulate specific within-subject EMG change in order to address the array of factors that can influence absolute EMG activity such as electrode design, quality of electrode application and surface preparation, and participant muscle mass and subcutaneous adipose tissue. Whereas most investigators have been careful to outline their unique NFR threshold definitions, it is often not possible to directly compare NFR threshold findings across studies due to varying definitions.
Because the lack of standardized scoring procedures may limit the adoption of NFR assessment methodology in clinical and research settings, we compared the accuracy and reliability of different scoring criteria in an effort to develop a potential NFR threshold standard. Specifically, existing nociceptive flexion reflex data gathered from healthy young adults were analyzed using diverse criteria to define reflex threshold (study 1). The best performing indices were then re-examined in a second set of data to establish consistency of performance across samples (study 2).
Study 1: Comparing the Accuracy and Reliability of Scoring Criteria for the NFR
2. Methods
2.1. Participants
Participants included 40 healthy young adults (20 men and 20 women) who had their nociceptive flexion reflex thresholds measured repeatedly as part of an investigation of consistency and individual differences in nociceptive responding (French et al., 2005). All participants were undergraduate students and all received course credit in return for their participation.
2.2. Laboratory testing procedure
Participants were scheduled for two laboratory sessions, approximately 24 hours apart (± 1 hour). They were instructed to refrain from caffeine, nicotine, alcohol, and strenuous exercise for at least four hours and from analgesic medication for 24 hours prior to testing. At each testing session, participants completed two assessments of their nociceptive flexion reflex (NFR) threshold.
To begin the session, the electrocutaneous stimulation and electromyogram (EMG) recording sites were prepared and the required electrodes were attached. All electrode sites were cleaned and abraded with Omni Prep electrode paste and an impedance of less than 10KOhm, verified using a UFI Checktrode (model MKII), was achieved before proceeding. To record NFR activity, a differential electromyographic (EMG) electrode was secured over the biceps femoris muscle of the left leg, 10 cm superior to the popliteal fossa, and a reference (common ground) electrode attached over the lateral epicondyle of the femur. EMG activity was amplified using a DelSys, Bagnoli-2 differential amplifier and the signal was recorded and processed using a CED Micro1401 analog-to-digital converter and Spike2 software. To elicit the NFR, electrocutaneous stimulation generated by a Digitimer, DS7A constant-current stimulator was applied over the retromalleolar pathway of the sural nerve of the left leg using a Nicolet bar electrode (a bipolar stimulating electrode with a fixed 30 mm interelectrode distance) that was applied with anode inferior.
Participants were then seated in a Hi-Seat rehabilitation chair (model 2000) with the left leg rest adjusted to maintain knee flexion at 60 ± 5 degrees Ffrom horizontal. Once the leg rest was adjusted, participants received a series of four electrocutaneous stimulations of increasing intensity (0, 2, 4, and 6 mA) to acclimatize them to the stimulation. NFR threshold was then determined twice, with a 10-minute rest period between each assessment. As in previous studies conducted in our laboratory (Page and France, 1997; France and Suchowiecki, 2001; France et al., 2002a; France et al., 2002b), NFR occurrence was defined as a mean EMG response in the 90 to 150 ms post-stimulation interval that exceeded mean EMG activity during the 60 ms pre-stimulation baseline (− 65 to − 5 ms) interval by at least 1.5 standard deviations (i.e., NFR Interval z score = 1.5, see 2.4.2. below). Although a range of intervals (from 80–180 ms post-stimulation) have been used in prior investigations to identify the RIII reflex, a more narrow 90–150 ms window avoids possible contamination of the RIII reflex by the low-threshold cutaneous flexor reflex (RII) which can precede 90 ms and by startle reactions and voluntary movements that can begin as early as 150 ms post-stimulation (Dowman, 1991; 1992).
To elicit NFR activity, repeated electrocutaneous stimulation was applied over the sural nerve according to a variable interval schedule of 6 s (range 4–8 s) to decrease the likelihood of stimulus predictability. Each stimulation trial consisted of a volley of five 1 ms rectangular pulses with a 3 ms interpulse interval (total duration = 17 ms; 250 Hz). Using an up-down staircase method, stimulation intensity was increased in 4 mA increments until an NFR was detected (or a maximum intensity of 40 mA was reached) and then was decreased in 2 mA increments until a reflex was no longer detected. Continuing from this intensity, the procedure was then repeated using 1 mA increments until the reflex appeared and disappeared two more times. During the NFR threshold assessments, participants rated the perceived intensity of each stimulation using a Verbal Rating Scale (VRS) with anchors of 1 (sensory threshold), 25 (uncomfortable), 50 (painful), 75 (very painful), and 100 (maximum tolerable). In the event that a participant provided a rating of 100, the threshold assessment was discontinued. Additional details concerning assessments of height, weight, resting blood pressure, and various psychological measures can be found in a prior report (French et al., 2005).
2.3 Data files
The NFR testing procedure generated a physiological data file for every electrocutaneous stimulation trial. Each file included rectified biceps femoris EMG and a monitor signal for electric stimuli, sampled at 2000 Hz and recorded 400 ms prior to and 1600 ms after each stimulation. Thus, a block of files was created for each up-down staircase that assessed NFR threshold. Every person had 4 blocks of files (2 per day) for a total of 2756 files available for analysis.
2.4 Procedures used to define NFR threshold
A program was developed by the first author using LabVIEW (National Instruments, Austin, TX) to score each physiological data file. The program provided a graphic display of the rectified biceps femoris waveform and the electrocutaneous stimulation pulses (see Figure 1). The scale of the y-axis was set to −0.5 to 30 μV; however, in the event a trial contained voltages >30 μV the scaling could be adjusted to −0.5 to 70 μV. Separate boxes were used to identify the pre-stimulation baseline interval (−65 to −5 ms) as well as the NFR interval (90–150 ms). Using this display, the operator was asked indicate whether a NFR was present or absent for each waveform.
Figure 1.
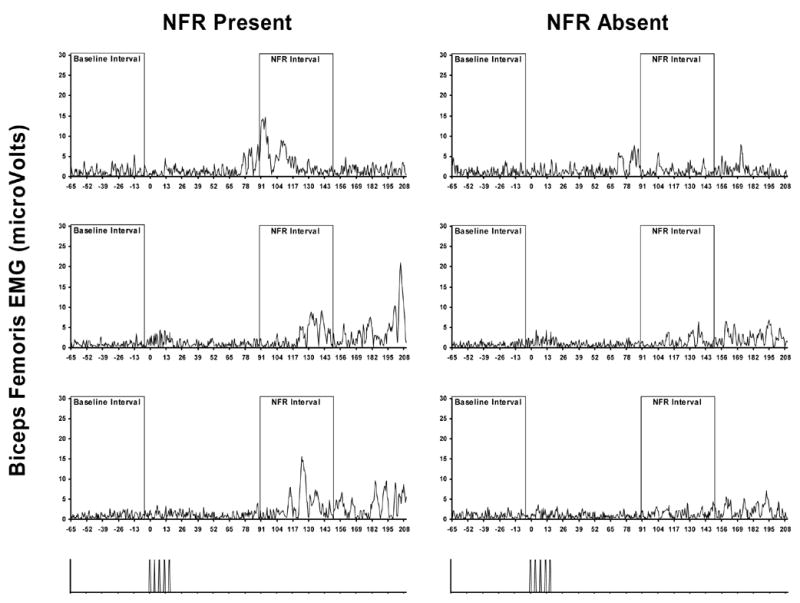
Example trials in which raters agreed an NFR was present or absent. Panels on the left-hand side are biceps femoris electromyogram (EMG) from single trials of 3 different subjects in which both raters agreed a NFR was present. Panels on the right are trials from the same 3 subjects that were one stimulus intensity lower and raters agreed a NFR was absent. The bottom panels illustrate stimulation onset/offset.
2.4.1. Subjective ratings
Because our goal was to determine the best criterion to identify the presence of a NFR in individual biceps femoris EMG waveforms, a definition was generated that could be used by expert judges to classify individual waveforms as either exhibiting or not exhibiting a reflex response (i.e., a “gold standard” against which to compare subsequent automated indices). After a review of the literature and independent discussions by laboratory teams at Ohio University and The University of Tulsa, the following definition was agreed upon: “A NFR exists if (1) at least one sizable difference peak occurs in the 90–150 ms post-stimulation window, relative to baseline, but not if (2) activity in the 90–150 ms post-stimulation window mimics baseline.” Using this definition, two experts (one from each university) familiar with NFR methodology and recording, independently scored each waveform.
Of the 2756 files, the raters agreed on 2602 (94%) regarding the presence (694 files, 25%) and absence (1908 files, 69%) of a NFR (Interrater reliability: Kappa = .86, p < .001). Figure 1 depicts examples of three waveforms where raters agreed a NFR was present and three where raters agreed that a NFR was absent. For ROC analyses, waveforms were said to contain a NFR only if both raters agreed on the presence of a NFR, otherwise the waveform was said to not contain an NFR. A total of 125 waveforms (4.5%) were identified by at least one rater as having significant noise during the pre-stimulation baseline. For all subsequent analyses, these waveforms were excluded. Thus, subsequent analyses were based on a final set of 2631 (95.5% of original) waveforms, 647 (24.6%) of those files were said to have a NFR present.
2.4.2. Automated scoring
In addition to collecting expert ratings, the scoring program calculated several biceps femoris EMG criterion variables that were to be evaluated for scoring NFR threshold (Table 1). These criteria included six measures of absolute levels of EMG activity in the 90–150 ms post-stimulus NFR interval (i.e., NFR Interval Peak, NFR Interval Mean, NFR Interval AUC, Number of Samples above 10 μV, Number of Samples above 20 μV, Number of Samples above 50 μV). The NFR Interval peak was defined as the highest point (in μV) within the EMG curve between 90–150 ms post-stimulation, NFR interval mean was computed as the average level of EMG activity (in μV) within the same 90–150 ms window. NFR Interval AUC, or area under the curve, was computed as the sum of EMG activity (in μV) between 90–150 ms post-stimulation. Additional criteria included increases in EMG activity in the NFR interval relative to the pre-stimulation baseline interval (Baseline Adjusted NFR Interval Peak, NFR Interval Peak z score, Baseline Adjusted NFR Interval Mean, NFR Interval z score, Baseline Adjusted NFR Interval AUC, NFR Interval Cohen’s d), and shape of the response waveform during the NFR interval (NFR Interval Kurtosis). The NFR Interval Kurtosis criterion was calculated to quantify the shape of the waveform during the 90–150 ms post-stimulus interval. Kurtosis is a statistical moment used to characterize the shape of a frequency distribution, with higher kurtosis values representing more peakedness (leptokurtotic) and lower values representing flatter distributions (platykurtotic). To calculate the kurtosis of the NFR interval (not the frequency distribution of the voltage values during the 90–150 ms interval), the voltage (V) waveform was first converted to a probability density function p(t) by letting
Table 1.
Criterion variable definitions.
| Criterion Variable | Definition |
|---|---|
| NFR Interval Peak | Peak voltage in NFR interval |
| Baseline Adjusted NFR Interval Peak | (NFR interval peak - baseline mean) |
| NFR Interval Peak z scorea | (NFR interval peak - baseline mean)/baseline SD |
| NFR Interval Mean | NFR interval mean voltage |
| Baseline Adjusted NFR Interval Mean | (NFR interval mean - baseline mean) |
| NFR Interval z scorea | (NFR interval mean - baseline mean)/baseline SD |
| NFR Interval AUC | NFR interval total area under the curve |
| Baseline Adjusted NFR Interval AUC | (NFR interval total area under the curve - baseline total area under the curve) |
| NFR Interval Cohen’s da | (NFR interval mean - baseline mean)/pooled SD of NFR interval and baseline SD |
| NFR Interval Kurtosis | Statistical moment used to characterize the shape of NFR interval waveform |
| Number of Samples above 10 μV | Number of NFR interval samples > 10μV |
| Number of Samples above 20 μV | Number of NFR interval samples > 20μV |
| Number of Samples above 50 μV | Number of NFR interval samples > 50μV |
Note: NFR = nociceptive flexion reflex, AUC = area under the curve.
Refers to standardized criteria. z scores are standardized because the standard deviation of baseline activity is used in the denominator, thus placing the variable in standard deviation units. The d score is standardized because the standard deviation of baseline activity and NFR activity is used in the denominator.
| (1) |
and defining
| (2) |
Kurtosis (k) was then defined as:
| (3) |
where μ is the mean, σ is the standard deviation, and t is time.
3. Results
3.1. ROC analyses
To determine the criterion that best identified a NFR in Study 1, 4 receiver operating characteristic (ROC) analyses were conducted, one for each block of trials. However, given the high consistency across the 4 analyses, all blocks were combined and analyzed using ROC.1 Table 2 presents data from the ROC analyses of criterion variables on the combined data. Criteria were compared using area under the ROC curve and the associated 95% confidence intervals. A criterion was judged to be “good” if the area under the ROC curve was high (closer to 1.0) and significant at p < .05. A criterion was judged to be better than another if the area under the ROC curve was larger (greater accuracy) and the 95% confidence intervals for the areas were non-overlapping. In the event of a tie between criteria, a standardized criterion was always judged to be better than a non-standardized criterion due to the greater generalizability of a standardized criterion across NFR methodologies (e.g., electrode application, gain setting). As can be seen in Table 2, peak variables (Baseline Adjusted NFR Interval Peak, NFR Interval Peak, and NFR Interval Peak z score) performed best, with ≥ 97% of the area under the ROC curves. Six criteria performed just lower than the peak variables: NFR Interval Mean, Baseline Adjusted NFR Interval Mean, NFR Interval AUC, Baseline Adjusted NFR Interval AUC, NFR interval z score, and Number of Samples above 10 μV. These criteria had 90–95% area under the ROC curve. Cohen’s d and NFR Interval Kurtosis were in the next lower tier of criteria, with 85% area under the ROC curve. Number of Samples above 20 μV had 61% area under the ROC curve. Number of Samples above 50 μV was the only criterion that was non-significant, with 51% area under the ROC curve. In sum, according to ROC results, it was concluded that NFR Interval Peak z score was the best criterion because it had high accuracy (large area under the ROC curve) and was standardized. However, 11 of the 13 criteria had ≥85% of the area under the ROC curve and were significant, suggesting they were adequate for detecting the presence of a NFR in the present data.
Table 2.
Receiver operating characteristics (ROC) curve analyses on all trials (across days and blocks) in Study 1.
| Criterion Variable | Area Under the ROC Curve | 95% CI | Diff |
|---|---|---|---|
| Baseline Adjusted NFR Interval Peak | 0.99 | (0.98–0.99) | a |
| NFR Interval Peak | 0.99 | (0.98–0.99) | a |
| NFR Interval Peak z score | 0.97 | (0.97–0.98) | a |
| NFR Interval Mean | 0.95 | (0.94–0.96) | b |
| Baseline Adjusted NFR Interval Mean | 0.95 | (0.94–0.96) | b |
| NFR Interval AUC | 0.95 | (0.94–0.96) | b |
| Baseline Adjusted NFR Interval AUC | 0.95 | (0.94–0.96) | b |
| NFR Interval z score | 0.93 | (0.92–0.94) | b,c |
| Number of Samples above 10 μV | 0.90 | (0.88–0.92) | c |
| NFR Interval Cohen’s d | 0.85 | (0.84–0.87) | d |
| NFR Interval Kurtosis | 0.85 | (0.83–0.87) | d |
| Number of Samples above 20 μV | 0.61 | (0.58–0.64) | e |
| Number of Samples above 50 μV | 0.51 | (0.48–0.54) | f |
Note: NFR = nociceptive flexion reflex. AUC = area under the curve. CI = confidence interval. All area under the ROC curve estimates are significant (ps < .001) except for Number of Samples above 50 μV (p = .44). The “Diff” column indicates which criteria are significantly different from one another – criteria sharing a letter are not significantly different (95% CIs are overlapping).
3.2. Cut-point determination
Coordinate points from the ROC curves for a subset of the above criteria were examined to determine the cut-point that optimized overall accuracy (balanced sensitivity and specificity levels) in defining a reflex for that criterion across all blocks of trials. It was decided to focus on the standardized criteria (NFR Interval Peak z score, NFR interval z score) because of their generalizability across testing situations, as well as their nonstandardized counterparts (Baseline Adjusted NFR Interval Peak, Baseline Adjusted NFR Interval Mean). Other measures (AUC, number of samples above 10μV, 20μV, 50μV) are not conducive to generating cut-points that can be used across laboratories because their level is likely to vary as a function of EMG electrode design, quality of electrode application and surface preparation, participant muscle mass and subcutaneous adipose tissue, and sample rate. Cohen’s d and kurtosis were not chosen due to lower performance relative to other measures. Table 3 presents the cut-points by block to examine the stability over time, while Figure 2 illustrates the cut-point determinant curves for NFR Interval Peak z score and NFR Interval z score thresholds. The best cut-point was calculated from the average across all 4 blocks: Baseline Adjusted NFR Interval Peak = 7.76, NFR Interval Peak z score = 10.32, Baseline Adjusted NFR Interval Mean = 1.01, and NFR interval z score = 1.38. As shown, the cut-points for all 4 criteria were stable, with little variability across blocks; however, it is noteworthy that NFR interval z score had the least variability across blocks (even relative to its magnitude). When applied to data from all 4 blocks, these cut-points had overall accuracies of 96% (Baseline Adjusted NFR Interval Peak), 91% (NFR Interval Peak z score), 88% (Baseline Adjusted NFR Interval Mean), and 85% (NFR interval z score).
Table 3.
Cut-points for criteria that optimize overall accuracy by block of trials in Study 1.
| Block 1 | Block 2 | Block 3 | Block 4 | Cut-point Across Blocks | ||||||
|---|---|---|---|---|---|---|---|---|---|---|
| Criterion Variable | Cut-Point | SE & SP | Cut-Point | SE & SP | Cut-Point | SE & SP | Cut-Point | SE & SP | Mean | SD |
| Baseline Adjusted NFR Interval Peak | 7.77 | 0.95 | 8.07 | 0.95 | 7.62 | 0.96 | 7.58 | 0.96 | 7.76 | 0.22 |
| NFR Interval Peak z score | 10.22 | 0.90 | 10.01 | 0.90 | 10.43 | 0.92 | 10.60 | 0.91 | 10.32 | 0.26 |
| Baseline Adjusted NFR Interval Mean | 1.04 | 0.88 | 1.07 | 0.87 | 1.02 | 0.89 | 0.92 | 0.86 | 1.01 | 0.06 |
| NFR Interval z score | 1.35 | 0.86 | 1.40 | 0.84 | 1.39 | 0.85 | 1.36 | 0.83 | 1.38 | 0.02 |
Note: SE = sensitivity, SP= specificity, NFR = nociceptive flexion reflex. The cut-point is the value of the criterion that maximizes both sensitivity and specificity. The sensitivity/specificity value listed in the SE & SP column corresponds to the cut-point. The last 2 columns display the mean and the standard deviation (SD) of the cut-points across blocks.
Figure 2.
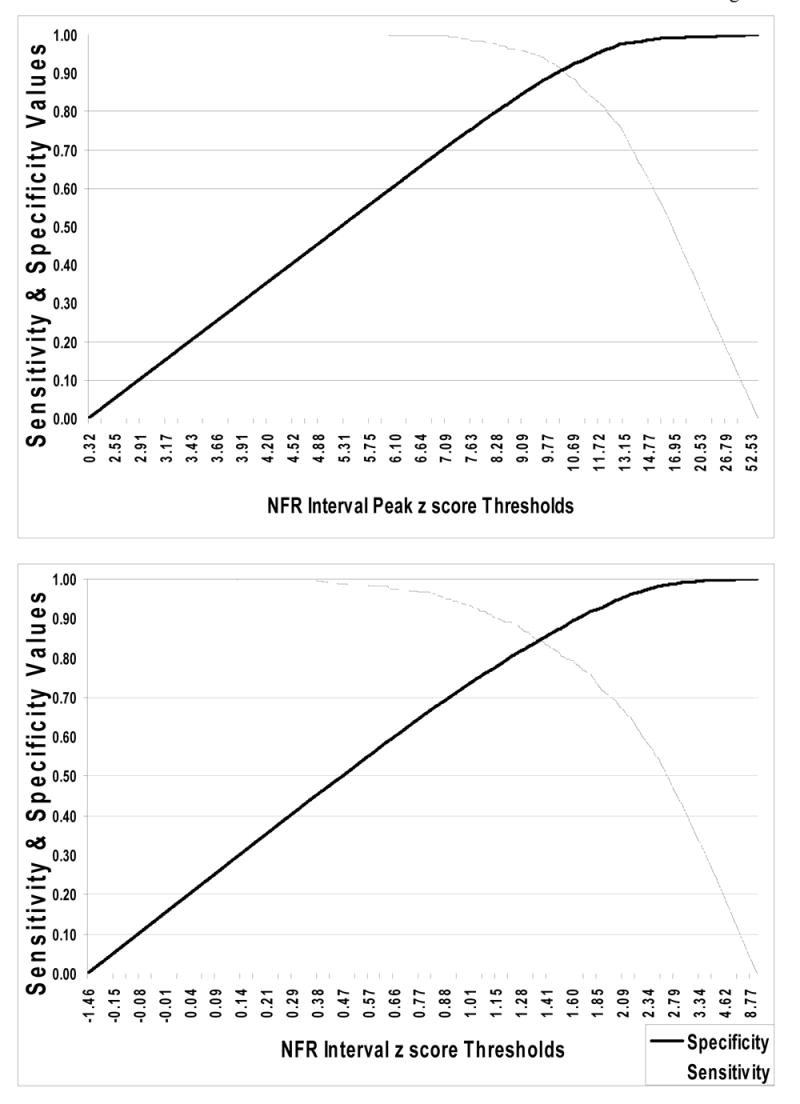
Plots of sensitivity and specificity values (y-axis) by threshold values (x-axis) for the NFR Interval Peak z score (top panel) and NFR Interval z score (bottom panel) criteria. These graphs are based on data from Study 1 and can be used to adjust the threshold values for each criterion to alter accuracy rates to improve sensitivity or specificity.
3.3. Test-retest reliability of NFR thresholds from empirically-derived cut-points
The next analyses determined whether criteria deemed “good” resulted in reliable NFR thresholds across time (blocks). Using the average cut-points for each criterion determined in the previous analyses, new NFR thresholds were empirically defined for each participant as the lowest stimulus intensity in a block of trials that met or exceeded that cut-point. This generated 4 NFR thresholds (one for each criterion variable) per block, per person. For example, the lowest stimulus intensity in Day 1 Block 1 for participant 1 that elicited a Baseline Adjusted NFR Interval Peak that met or exceeded 7.76 was considered NFR threshold for that participant in that block. Test-retest reliabilities across blocks of trials were then calculated for each criterion using Pearson’s r (see Table 4). As can be seen, cut-points from all 4 criteria generally resulted in adequate test-retest reliabilities (although it is likely that reliabilities would be higher if these cut-points were used in the up-down staircase procedure to determine NFR thresholds). NFR threshold calculated from Baseline Adjusted NFR Interval Peak had reliabilities that ranged from .60 to .80, with an average reliability of .73. NFR threshold calculated from NFR Interval Peak z score had reliabilities that ranged from .66 to .81, with an average reliability of .75. NFR threshold calculated from Baseline Adjusted NFR Interval Mean had reliabilities that ranged from .64 to .80, with an average reliability of .73. And finally, NFR threshold calculated from NFR interval z score had reliabilities that ranged from .55 to .79, with an average reliability of .67. Together, these data suggest that cut-points derived from NFR Interval Peak z score and Baseline Adjusted NFR Interval Mean led to the highest average test-retest reliabilities and the smallest range of reliability coefficients across blocks.
Table 4.
Test-retest reliabilities of NFR thresholds calculated from empirically-derived criterion cut-points in Study 1.
| Day 1
|
Day 2
|
|||
|---|---|---|---|---|
| Criterion Variable | Block 1 | Block 2 | Block 3 | Block 4 |
| Baseline Adjusted NFR Interval Peak | ||||
| Day 1, Block 1 | - | |||
| Day 1, Block 2 | 0.71 | - | ||
| Day 2, Block 3 | 0.60 | 0.78 | - | |
| Day 2, Block 4 | 0.80 | 0.76 | 0.74 | - |
| NFR Interval Peak z score | ||||
| Day 1, Block 1 | - | |||
| Day 1, Block 2 | 0.79 | - | ||
| Day 2, Block 3 | 0.66 | 0.69 | - | |
| Day 2, Block 4 | 0.77 | 0.81 | 0.77 | - |
| Baseline Adjusted NFR Interval Mean | ||||
| Day 1, Block 1 | - | |||
| Day 1, Block 2 | 0.79 | - | ||
| Day 2, Block 3 | 0.76 | 0.80 | - | |
| Day 2, Block 4 | 0.68 | 0.64 | 0.71 | - |
| NFR Interval z score | ||||
| Day 1, Block 1 | - | |||
| Day 1, Block 2 | 0.79 | - | ||
| Day 2, Block 3 | 0.68 | 0.72 | - | |
| Day 2, Block 4 | 0.59 | 0.55 | 0.67 | - |
Note: NFR = nociceptive flexion reflex. The following cut-points were used: Baseline Adjusted NFR Interval Peak = 7.76, NFR Interval Peak z score = 10.32, Baseline Adjusted NFR Interval Mean = 1.01, NFR Interval z score = 1.38
Study 2: Examining the Consistency of Criteria in an Independent Sample
4. Methods
4.1 Participants
NFR data were obtained from a random subsample of 50 healthy young adults (25 men and 25 women) who participated in a larger study examining opiate blockade on nociceptive responding (France et al., 2005). Because participants in the larger study were tested on two separate days (i.e., after consuming either a placebo pill or 50 mg of naltrexone), for the purpose of the present study we only examined data collected on the placebo day. Participants received compensation of $20 per hour of testing.
4.2 Laboratory testing procedure
Participants were seated in a Hi-Seat rehabilitation chair (model 2000) with a leg rest adjusted to maintain knee flexion at approximately 60 degrees from horizontal. Using the same equipment and testing procedures described in Study 1 above, NFR threshold was assessed three times with each assessment lasting approximately 5 min and followed by a 5 min rest period. Upon completion of the NFR threshold assessments, electrocutaneous pain threshold and tolerance levels were then measured. Specifically, sural nerve stimulation trials were delivered as a volley of five 1 ms rectangular pulses with a 3 ms interpulse interval (total duration = 17 ms). Stimulation intensity began at 0 mA and increased in 2 mA steps until a maximum stimulation intensity of 40 mA was reached or the participant reported that they had reached their tolerance threshold. EMG data recorded during this last series of increasingly intense stimulations was then used in Study 2 to identify NFR threshold as described below. A total of 795 files were collected from all 50 participants.
4.3 Procedures used to define NFR threshold
The procedures and raters used to define NFR threshold were the same as Study 1. Of the 795 files, the two raters agreed on 768 (96%) regarding the presence (249 files, 31%) and absence (519 files, 65%) of a NFR (Inter-rater reliability: Kappa = .92, p < .001). As in Study 1, waveforms were said to contain a NFR only if both raters agreed on the presence of a NFR, otherwise the waveform was said to not contain a NFR. A total of 40 waveforms (5.0%) were identified by at least one rater as having significant noise during the pre-stimulation baseline. For all subsequent analyses, these waveforms were excluded. Thus, subsequent analyses were based on a final set of 755 (95% of original) waveforms, with 233 (30.9%) of those files said to have a NFR present.
5. Results
5.1 ROC analysis
To establish that the criterion variables perform consistently in a second independent sample, ROC analysis was conducted on data from Study 2. Like before, criteria were compared using area under the ROC curve and the associated 95% confidence intervals, with standardized criteria judged better than non-standardized criteria in the event of ties. As can be seen in Table 5, results were similar to those from Study 1. Eight criteria performed similarly, with 99% to 100% area under the ROC curve. Peak variables (Baseline Adjusted NFR Interval Peak, NFR Interval Peak, and NFR Interval Peak z score) performed best, with ≥ 99% of the area under the ROC curves and 95% CI that spanned .99 to 1.00. Five criteria performed lower than the peak variables: NFR Interval Mean, Baseline Adjusted NFR Interval Mean, NFR interval z score, NFR Interval AUC, and Baseline Adjusted NFR Interval AUC. These criteria had 99% area under the ROC curve, but 95% CIs slightly lower ranging from .98 to .99. Number of Samples above 10 μV and NFR Interval Cohen’s d were in the next lower tier of criteria, with 95–96% area under the ROC curve. NFR Interval Kurtosis and Number of Samples above 20 μV were next with 70–76% area under the ROC curve. Number of Samples above 50 μV was non-significant, with 53% area under the ROC curve. In this sample, 10 of the criteria had ≥ 95% of the area under the ROC curve and were significant, suggesting they were excellent for detecting the presence of a NFR in these data. But, it was concluded that NFR Interval Peak z score and NFR interval z score were the best criteria because they maintained excellent accuracy (large area under the ROC curve) and they were standardized.
Table 5.
Receiver operating characteristics (ROC) curve analysis in Study 2.
| Criterion Variable | Area Under the ROC Curve | 95% CI | Diff |
|---|---|---|---|
| Baseline Adjusted NFR Interval Peak | 1.00 | (0.99–1.00) | a |
| NFR Interval Peak | 0.99 | (0.99–1.00) | a |
| NFR Interval Peak z score | 0.99 | (0.99–1.00) | a |
| NFR Interval Mean | 0.99 | (0.98–0.99) | a,b |
| Baseline Adjusted NFR Interval Mean | 0.99 | (0.98–0.99) | a,b |
| NFR Interval z score | 0.99 | (0.98–0.99) | a,b |
| NFR Interval AUC | 0.99 | (0.98–0.99) | a,b |
| Baseline Adjusted NFR Interval AUC | 0.99 | (0.98–0.99) | a,b |
| Number of Samples above 10 μV | 0.96 | (0.94–0.98) | b,c |
| NFR Interval Cohen’s d | 0.95 | (0.93–0.96) | c |
| NFR Interval Kurtosis | 0.76 | (0.71–0.80) | d |
| Number of Samples above 20 μV | 0.70 | (0.65–0.74) | d |
| Number of Samples above 50 μV | 0.53 | (0.49–0.58) | e |
Note: NFR = nociceptive flexion reflex. AUC = area under the curve. CI = confidence interval. All area under the ROC curve estimates are significant (ps < .001) except for Number of Samples above 50 μV (p = .44). The “Diff” column indicates which criteria are significantly different from one another – criteria sharing a letter are not significantly different (95% CIs are overlapping).
5.2 Evaluating cut-points empirically derived from Study 1
From the preceding ROC analysis, the coordinate points from the ROC curve were examined to determine the sensitivity and specificity values corresponding to the cut-points derived from Study 1. In Study 2, the cut-point for Baseline Adjusted NFR Interval Peak (7.76) resulted in sensitivity of .99, specificity of .97, and overall accuracy of 98%. Of the 16 errors, 14 were false positives and 2 were false negatives. The cut-point for NFR Interval Peak z score (10.32) resulted in sensitivity of 1.00, specificity of .91, and overall accuracy of 93%. Of the 50 errors, all were false positives. The cut-point for Baseline Adjusted NFR Interval Mean (1.01) resulted in sensitivity of .97, specificity of .89, and overall accuracy of 91%. Of the 67 errors, 60 were false positives and 7 were false negatives. The cut-point for NFR interval z score (1.38) resulted in sensitivity of .98, specificity of .87, and overall accuracy of 90%. Of the 75 errors, 71 were false positives and 4 were false negatives. Thus, all of the empirically derived cut-points from Study 1 performed well in the current sample and would be adequate for use in determining NFR threshold. In general, errors were false positives reflecting the relatively better sensitivity.
6. Discussion
In order to compare empirical criteria that could be used to make reliable determinations about NFR occurrence, we modeled the accuracy of different mathematical equations relative to the inter-rater agreement of expert human judgments regarding reflex occurrence or non-occurrence. In many previous studies the “gold standard” for defining an NFR reflex has been a knowledgeable observer identifying a reflex occurrence at a specific frequency or proportion of trials. Thus, the NFR threshold is often determined by an expert observer who recognizes the presence/absence of the reflex based upon his/her familiarity with measurement of reflex responses using EMG recordings. In other studies, including our own, objective (i.e., mathematical) criteria have been used to define a NFR, but no data have been presented to support the relative advantage of the particular criterion chosen. Thus, the present study provides a significant contribution to the existing literature by comparing the accuracy and reliability of different criteria that have been used to date.
In study 1, data were collected on two days, twice per day, allowing us to determine the accuracy and reliability of the scoring criteria both within and between days. Results indicated that eight of the tested criteria were able to detect the presence/absence of the NFR; however, NFR Interval Peak z score and NFR Interval z score performed well and were standardized, and thus should generalize well across different NFR methods (e.g., electrode design, quality of surface preparation) and participant characteristics (e.g., muscle mass, subcutaneous adipose tissue). Moreover, the empirically-derived cut-points for these criteria showed very little variability within or across days. Study 2 replicated these results in an independent sample. Importantly, the stimulus intensities used in the second sample eliminated any concern that results were confounded by a restricted range of the biceps femoris activity (i.e., ceiling effect) because more supra-threshold stimuli were delivered. Supporting Study 1, NFR Interval Peak z score and NFR Interval z score performed well and their empirically-derived cut-points resulted in overall accuracies of 90% or better for detecting a reflex. Together, these studies suggested a cut-point of 10.32 should be used for the NFR Interval Peak z score and 1.38 for NFR Interval z score. To our knowledge, these data provide the first empirical evaluation of criteria to score NFR threshold. Given the particularly strong performance of the NFR Interval Peak and NFR Interval z-score criteria, it is hoped that the present findings will encourage a more widespread adoption of standardized criteria in an effort to enhance reliability and generalizability of future NFR findings.
It should be noted that the cut-points derived from the Study 1 optimized overall accuracy (balanced sensitivity and specificity). However, this assumes that false positives (indicating NFR is present when it is actually absent) and false negatives (indicating NFR is absent when it is actually present) should be weighted equally. In some cases, it may be beneficial to adjust the cut-point to reduce one type of error over the other. Indeed, some may want to choose a cut-point that maximizes specificity (eliminates false positives) at the expense of missing some true NFRs. Alternatively, because a cut-point that provides greater specificity is likely, on average, to require higher intensities of stimulation, there may be times when cut-points may need to be adjusted for practical reasons (e.g., to reduce participant distress and/or attrition). For these reasons we have included graphs derived from Study 1 data to help guide researcher’s decision-making in this endeavour (see Figure 2). These graphs plot criteria thresholds on the x-axis and sensitivity/specificity values on the y-axis. Therefore, as cut-points are shifted up or down the resulting impact on sensitivity and specificity can be determined.
Ideally one would prefer to have a neurophysiological “gold standard” that could signal activation of the reflex arc based upon direct recordings of A-delta nociceptors, spinal interneurons, and motoneurons subserving biceps femoris activation. Although this is an appealing notion, unfortunately it has its own limitations that go beyond the obvious constraint of invasive recording in human participants. First, because a variety of afferent inputs undergo temporal and spatial integration within the spinal cord, isolated peripheral recordings of A-delta fiber activation would not be sufficient to define the reflex. Next, assuming one could directly and safely record activation of spinal cord interneurons mediating NFR in human participants, this would still not be sufficient because the reflex is mediated by a complex pool of interneurons that receives both peripheral afferent inputs and descending inputs from the brain. Thus, both within- and between-subject differences in spinal modulation contribute to the determination of whether incoming afferent signals are sufficient to release a flexion reflex. Finally, with regard to the efferent limb of the reflex, there is the challenge of determining what level of activation of the flexor motoneuron pool is sufficient to represent a reflex. Thus, even with direct recording we must ultimately make a judgment concerning the level of activation that is necessary to be identified as a reflex response. Given these constraints, we believe that our decision to define the presence/absence of a NFR based upon the inter-rater agreement of expert observers is both reasonable and ultimately necessary.
Whereas the present findings are of obvious and direct relevance to studies that are interested in evaluating nociceptive threshold levels, it should be noted that they are also applicable to NFR paradigms that examine nociceptive modulation by examining changes in EMG activity in response to a constant suprathreshold stimulus. Because such studies begin by establishing an individual threshold, and then typically apply repeated stimulations at 120% of this threshold level, the current findings may also be used to help standardize such NFR modulation paradigms. However, regardless of whether the investigator is interested in determining a threshold level or examining modulation, it must be noted that a constant limitation of the NFR paradigm is that it relies on electrical stimulation and therefore findings are not attributable to selective activation of specific nociceptive afferents.
Summary
The present studies evaluated different scoring criteria for NFR threshold, and determined that standardized peak (NFR Interval Peak z score) and mean (NFR Interval z score) activity performed best as indicated by excellent accuracies across the two studies. Using these empirically-derived cut-points, we also demonstrated that the resulting NFR threshold showed good test-retest reliabilities both within-session and across days. However, we recognize that there are times when other cut-points are needed to reduce false positive or false negative rates. For this reason, graphs depicting sensitivity and specificity across a range of cut-points have been provided to facilitate decision-making. We hope that the results of the present studies will promote a standardization of NFR threshold assessment methodology, and thereby further encourage the growing use of NFR paradigms to investigate mechanisms and characteristics of both painful and non-painful disease (Skljarevski & Ramadan, 2002; Sandrini et al., 2005).
Acknowledgments
This work was supported by a grant from the National Institutes of Health awarded to Christopher France (NHLBI R01 HL64794). The authors would like to thank Richard A. Redner, Ph.D., for his help in calculating NFR waveform kurtosis, Amy E. Williams and Dustin Hammers for their help with data reduction, and Klanci M. McCabe, Jennifer L. Russell, and Zina Trost for their input in discussions to generate the NFR definition.
Footnotes
The results from the separate blocks of trials are available from the authors upon request.
Publisher's Disclaimer: This is a PDF file of an unedited manuscript that has been accepted for publication. As a service to our customers we are providing this early version of the manuscript. The manuscript will undergo copyediting, typesetting, and review of the resulting proof before it is published in its final citable form. Please note that during the production process errors may be discovered which could affect the content, and all legal disclaimers that apply to the journal pertain.
Contributor Information
Jamie L. Rhudy, Department of Psychology, University of Tulsa, USA
Christopher R. France, Department of Psychology, Ohio University, USA
References
- Andersen OK, Graven-Nielsen T, Matre D, Arendt-Nielsen L, Schomburg ED. Interaction between cutaneous and muscle afferent activity in polysynaptic reflex pathways: a human experimental study. Pain. 2000;84:29–36. doi: 10.1016/S0304-3959(99)00174-8. [DOI] [PubMed] [Google Scholar]
- Banic B, Petersen-Felix S, Andersen OK, Radanov BP, Villiger PM, Arendt-Nielsen L, Curatolo M. Evidence for spinal cord hypersensitivity in chronic pain after whiplash injury and in fibromyalgia. Pain. 2004;107:7–15. doi: 10.1016/j.pain.2003.05.001. [DOI] [PubMed] [Google Scholar]
- Boureau F, Luu M, Doubrere JF. Study of experimental pain measures and nociceptive reflex in chronic pain patients and normal subjects. Pain. 1991;44:131–138. doi: 10.1016/0304-3959(91)90126-I. [DOI] [PubMed] [Google Scholar]
- Chan CW, Dallaire M. Subjective pain sensation is linearly correlated with the flexion reflex in man. Brain Res. 1989;479:145–150. doi: 10.1016/0006-8993(89)91344-9. [DOI] [PubMed] [Google Scholar]
- Desmeules JA, Cedraschi C, Rapiti E, Baumgartner E, Finckh A, Cohen P, Dayer P, Vischer TL. Neurophysiologic evidence for a central sensitization in patients with fibromyalgia. Arthritis Rheum. 2003;48:1420. doi: 10.1002/art.10893. [DOI] [PubMed] [Google Scholar]
- Dowman R. Spinal and supraspinal correlates of nociception in man. Pain. 1991;45:269–281. doi: 10.1016/0304-3959(91)90051-X. [DOI] [PubMed] [Google Scholar]
- Dowman R. Possible startle response contamination of the spinal nociceptive withdrawal reflex. Pain. 1992;49:187–197. doi: 10.1016/0304-3959(92)90142-X. [DOI] [PubMed] [Google Scholar]
- Edwards L, McIntyre D, Carroll D, Ring C, Martin U. The human nociceptive flexion reflex threshold is higher during systole than diastole. Psychophysiology. 2002;39:678–681. doi: 10.1017.S0048577202011770. [DOI] [PubMed] [Google Scholar]
- Edwards L, Ring C, McIntyre D, Carroll D. Modulation of the human nociceptive flexion reflex across the cardiac cycle. Psychophysiology. 2001;38:712–718. [PubMed] [Google Scholar]
- France CR, al'Absi M, Ring C, France JL, Brose J, Spaeth D, Harju A, Nordehn G, Wittmers LE. Assessment of opiate modulation of pain and nociceptive responding in young adults with a parental history of hypertension. Biol Psychol. 2005;70:168–174. doi: 10.1016/j.biopsycho.2005.01.012. [DOI] [PubMed] [Google Scholar]
- France CR, France JL, al'Absi M, Ring C, McIntyre D. Catastrophizing is related to pain ratings, but not nociceptive flexion reflex threshold. Pain. 2002a;99:459–463. doi: 10.1016/s0304-3959(02)00235-x. [DOI] [PMC free article] [PubMed] [Google Scholar]
- France CR, Froese SA, Stewart JC. Altered central nervous system processing of noxious stimuli contributes to decreased nociceptive responding in individuals at risk for hypertension. Pain. 2002b;98:101–108. doi: 10.1016/s0304-3959(01)00477-8. [DOI] [PubMed] [Google Scholar]
- France CR, Suchowiecki S. Assessing supraspinal modulation of pain perception in individuals at risk for hypertension. Psychophysiol. 2001;38:107–113. [PubMed] [Google Scholar]
- French DJ, France CR, France JL, Arnott LF. The influence of acute anxiety on assessment of nociceptive flexion reflex thresholds in healthy young adults. Pain. 2005;114:358–363. doi: 10.1016/j.pain.2004.12.034. [DOI] [PubMed] [Google Scholar]
- Guieu R, Blin P, Pouget J, Serratrice G. High level sportsmen and nociceptive flexion reflex of the lower limb. Canadian Journal of Neuroscience. 1992;19:69–71. [Google Scholar]
- Page GD, France CR. Objective evidence of decreased pain perception in normotensives at risk for hypertension. Pain. 1997;73:173–180. doi: 10.1016/S0304-3959(97)00111-5. [DOI] [PubMed] [Google Scholar]
- Rhudy JL, Williams AE, McCabe K, Nguyen MA, Rambo P. Affective modulation of nociception at spinal and supraspinal levels. Psychophysiol. 2005;42:579–587. doi: 10.1111/j.1469-8986.2005.00313.x. [DOI] [PubMed] [Google Scholar]
- Sandrini G, Serrao M, Rossi P, Romaniello A, Cruccu G, Willer JC. The lower limb flexion reflex in humans. Progress in neurobiology. 2005;77:353–395. doi: 10.1016/j.pneurobio.2005.11.003. [DOI] [PubMed] [Google Scholar]
- Skljarevski V, Ramadan NM. The nociceptive flexion reflex in humans - review article. Pain. 2002;96:3–8. doi: 10.1016/s0304-3959(02)00018-0. [DOI] [PubMed] [Google Scholar]
- Terkelsen AJ, Andersen OK, MÃlgaard H, Hansen J, Jensen TS. Mental stress inhibits pain perception and heart rate variability but not a nociceptive withdrawal reflex. Acta Physiol Scand. 2004;180:405–414. doi: 10.1111/j.1365-201X.2004.01263.x. [DOI] [PubMed] [Google Scholar]
- Willer JC. Comparative study of perceived pain and nociceptive flexion reflex in man. Pain. 1977;3:69–80. doi: 10.1016/0304-3959(77)90036-7. [DOI] [PubMed] [Google Scholar]
- Willer JC, Boureau F, Albe-Fessard D. Supraspinal influences on nociceptive flexion reflex and pain sensation in man. Brain Res. 1979;179:61–68. doi: 10.1016/0006-8993(79)90489-x. [DOI] [PubMed] [Google Scholar]