

Abstract
The in vivo neuronal contribution to human cerebral metabolic rate of glucose (CMRglc), measured by 18FDG-PET, is unknown. Examining the effect of 1H MRSI-derived N-acetyl aspartate (NAA) concentration on positron emission tomography (PET) measures of metabolic activity might indicate the relationship of CMRglc to neuron density. In a population of 19 demented, cognitively impaired, and control subjects, the Müller-Gärtner algorithm was applied to whole-brain PET data to isolate the PET signal originating in cortical gray matter alone (GMPET). An analogous procedure applied to multislice proton MRSI data yielded the N-acetyl aspartate concentration in cortical gray matter (GMNAA). In 18 of 19 subjects, a significant linear regression (P < 0.05) resulted when GMPET was plotted against GMNAA, whereby GMPET was higher for higher GMNAA. This suggests that CMRglc rises linearly with increasing neuron density in gray matter. This method may be used to investigate the relationship of CMRglc to neurons in various conditions.
Keywords: NAA, CMRglc, FDG-PET, proton MRSI
[18F]Fluorodeoxyglucose positron emission tomography (PET) is widely used to measure the cerebral metabolic rate of glucose consumption (CMRglc) in the study of normal and diseased brain (1–3). Because glucose is the sole substrate for normal brain metabolism, values of CM-Rglc likely reflect overall levels of brain metabolic activity. But whether CMRglc directly represents the metabolic activity of neurons, and not of other cells, has yet to be established. It is difficult to address this question, particularly in vivo in humans, with PET alone. PET data are acquired as averages over macroscopic volumes of tissue. Thus, the CMRglc values acquired by PET would be influenced by both neuronal metabolic rate and neuronal density in the tissue volume. Further, realistic tissue volumes contain not only neurons, but also other cells, in particular neuroglia, that consume glucose. There is growing evidence that glia actually consume glucose at a higher rate than neurons do (4). The issue is important because both aging and disease may reduce neuron populations and so affect the measurement of metabolic rates. Atrophy correction is only a partial solution because atrophy correction expresses cellular depletion in terms of gross tissue loss without regard to the type or density of cells present in the lost or in the remaining tissue. A method of indexing neuron density in vivo might permit more accurate assessment of these structural contributions to metabolic measurements, and therefore would improve the calculation of functional effects. The extent to which disease affects true metabolism could then be better understood.
Proton magnetic resonance spectroscopic imaging of the brain (1H MRSI) detects the amino acid N-acetyl aspartate (NAA), which is found in high concentrations only in neurons and is virtually undetectable in other cells, including glia (5,6). NAA resonance intensity in the 1H MRSI spectrum is therefore related to neuron density and/or to NAA content per neuron. Thus, how CMRglc varies as a function of NAA concentration ([NAA]) should reflect the way in which brain glucose metabolism is affected by neuron density and/or by NAA content per neuron. The CMRglc-to-[NAA] relationship could be derived for an individual subject by plotting local CMRglc against local [NAA] across that subject’s brain. The CMGglc-to-[NAA] relationship might be expected to vary from subject to subject depending on factors such as subject cognitive status. However, there are limitations to this approach. First, although cortical gray matter is the tissue of primary interest in evaluating brain metabolic activity, PET and 1H MRSI data are often expressed in terms of whole, unsegmented brain tissue, rather than as values for cortical gray matter alone. Second, even if regional data are compared, the spatial resolution of MRSI is lower than that of PET, a source of possible signal infidelity. Therefore, the aims in this study were 1) to establish a method for the assessment of CMRglc and [NAA] in cortical gray matter, accounting for differences between PET and 1H MRSI image resolution; 2) to look for the quantitative relationship between gray matter CMRglc and [NAA] in individual cognitively normal, cognitively impaired, and demented subjects; and 3) to explore whether this CMRglc-to-[NAA] relation varies with cognitive status across subjects.
MATERIALS AND METHODS
Table 1 lists demographic data for 19 subjects including 3 cognitively normal, 7 with cognitive impairments not meeting criteria for dementia, and 9 demented patients. All subjects underwent neurological and neuropsychological assessment at the Alzheimer’s Disease Center of the University of California at Davis and were assigned to one of three cognitive status groups (cognitively normal, cognitively impaired, demented) according to their score on the Clinical Dementia Rating (CDR) scale. Each group was also subdivided into those subjects with and those subjects without vascular pathology (chiefly subcortical infarcts = lacunes) on structural MR images, as read by a neuroradiologist. Patient selection methods are detailed further in Kwan et al. (7). The study was approved by the Committee for Human Research at all participating institutions, and informed consent was obtained prior to participation.
Table 1.
Subject Population and Demographics
| Subject category | n | Sex | Mean age (yr) |
|---|---|---|---|
| Demented + Lacune (D + L) | 7 | 1♀ | 78.4 ± 4.5 |
| Demented (D) | 2 | 2♀ | 73.5 ± 0.7 |
| Cognitively Impaired + Lacune (CI + L) | 3 | 0♀ | 70.0 ± 2.6 |
| Cognitively Impaired (CI) | 4 | 3♀ | 77.2 ± 5.4 |
| Cognitively Normal + Lacune (CN + L) | 2 | 1♀ | 73.0 ± 1.4 |
| Cognitively Normal (CN) | 1 | 0♀ | 79.0 ± 0.0 |
Means are ± 1 SD. Subjects classified by overall cognitive status determined by Clinical Dementia Rating (CDR). A CDR of 1 corresponds to demented (D), CDR = 0.5 is cognitively impaired (CI), and CDR = 0 is cognitively normal (CN). “Plus lacune” (+L) was added for subjects manifesting one or more subcortical lacunar infarctions measuring ≥ 3 mm diameter on T1-weighted MR images. D patients have probable AD; CN subjects are healthy controls.
MR images were acquired on a 1.5-T Vision system (Siemens, Iselin, NJ). The scanning protocol comprised an axial-oblique double spin-echo (DSE) sequence (TR/TE1/TE2 = 2550/20/80, in-plane resolution = 1.4 × 1 mm2, slice thickness = 3 mm) oriented parallel to the optic nerve, followed by a volumetric magnetization-prepared rapid gradient echo (MPRAGE) acquisition (TR/TI/TE = 10/250/4, flip angle = 15°, in-plane resolution = 1.0 × 1.0 mm2, partition thickness = 1.4 mm) angulated perpendicular to the DSE image plane (8,9). The DSE sequence yielded proton density- and T2-weighted images, whereas the MPRAGE acquisition produced T1-weighted images. All three image-types were used for clinical reading and for MR image tissue segmentation (8,10). Multi-slice 1H MRSI was acquired (TR/TE = 1800/135 msec) from two 15-mm-thick slices aligned parallel to the DSE images with the lower slice immediately below the superior extent of the corpus callosum and the other slightly above (11). This covered large areas of the frontal and parietal lobes. A slice-selective inversion pulse (TI = 170 msec) was used to reduce lipid contamination and CHESS suppression was applied to reduce the dominant water signal. Phase encoding steps (36 × 36) were sampled over a circular k-space region yielding a nominal voxel size of 8 × 8 × 15 mm3.
MRSI spectra were zero-filled to 64 × 64 pixels, subjected to k-space extrapolation for further reduction of lipid contamination (12), and fitted with an automated routine (13). The NAA peak areas of each subject were corrected for instrumental parameters and normalized to the CSF signal intensity taken from the proton density-weighted MRI to account for instrumental variability. Voxels with a spectral line width < 2 or > 10 Hz were excluded from further analysis.
In order to calculate separate values for the [NAA] of gray matter in each MRSI voxel (GMNAA), 1H MRSI data were co-analyzed with tissue-segmented MRI. Tissue segmentation of MRI whole-brain data was performed as described previously (8,10). The segmented MRI volume from each subject was then coregistered to the corresponding 1H MRSI image set and reduced to MRSI resolution, taking into account the MRSI point spread function, chemical shift displacement, and slice profile (14). This operation yielded the tissue composition of each MRSI voxel. A variant of the Müller-Gärtner algorithm (15), originally developed for PET, was applied to calculate GMNAA for each MRSI voxel in the four lobe regions as follows:
| [1] |
Here [NAA] represents total NAA concentration in the voxel. (φ tiss⊗f) and (φ WM⊗f) are the volume fractions of tissue and of white matter, respectively, in the voxel, where ⊗f indicates that the volume fraction obtained from MRI has been convolved with the point-spread function of 1H MRSI, f, derived analytically. [NAA]WM is the concentration of NAA in “pure” white matter. Basically, the equation subtracts the white matter contribution from the total [NAA] of the voxel and takes the remaining difference to be equal to GMNAA, since CSF is assumed to have an [NAA] near zero. Both sides of the equation are then divided by ( φ tiss⊗f) to put them on a per tissue volume basis (CSF correction). The value applied for [NAA]WM varied from voxel to voxel according to the cerebral lobe (left frontal, right frontal, left parietal, or right parietal) in which the voxel was located. Voxels were assigned to lobes based on position relative to the interhemispheric and the Rolandic fissures as seen on the T1-weighted MRI using spectroscopic imaging display software. A value of [NAA]WM was then estimated separately for each of the four lobes by performing a two-way regression for [NAA] as a function of volume fraction gray matter and volume fraction white matter and extrapolating to 100% white matter volume fraction.
PET was conducted as described previously (7). All subjects performed a continuous verbal recognition memory task during the tracer uptake phase of the PET scan. The task began 10–20 sec prior to the injection of approximately 10 mCi of 18FDG and lasted at least 20 min. Each subject was then positioned in the CTI/Siemens ECAT EXACT HR PET scanner and scanned in 2D mode at a count rate of approximately 60,000 events/sec and a dead time of 1%. For 10 of the 19 subjects, blood was drawn through a radial artery catheter to collect an input function (16) and CMRglc was calculated (17).
For each of the 19 subjects, a “gray matter PET” (GM-PET) volume estimating the PET radioactivity generated by gray matter alone was isolated from the corresponding whole-brain PET radioactivity volume using the Müller-Gärtner algorithm (15,18) for each PET voxel as follows:
| [2] |
Here TOTPET represents total PET radioactivity (or count rate) in the voxel and PET WM is the PET radioactivity of “pure” white matter. The latter was sampled from a region of high white matter content and assumed to be constant across the brain. ⊗h indicates that the volume fraction white matter obtained from MRI has been convolved with the point-spread function of PET, h, which was derived empirically (19). The procedure assumes that the PET radioactivity due to CSF is equal to zero. The individual voxel GMPET radioactivity values were normalized for each subject by dividing by that subject’s mean whole-brain GMPET radioactivity. For subjects in whom arterial input functions were available, the operational equation of Phelps et al. (17) was used to calculate CMRglc on a voxel-by-voxel basis and CMRglc volumes were created. These volumes were then processed in a manner similar to that described for the radioactivity volumes above to create gray matter CMRglc (GMCMRglc) volumes, with the exception that these data were not normalized to whole-brain metabolism.
Each GMPET (or GMCMRglc) volume was then coregistered onto its corresponding MRI (20) and thence onto the subject’s MRSI, and reduced to MRSI resolution, as described above for segmented MRI. This procedure yielded a single value of normalized GMPET radioactivity (or of GMCMRglc) for each MRSI voxel. These values were then CSF-corrected by dividing by φ tiss⊗f.
The relationship between CSF-corrected normalized GMPET (or GMCMRglc) and CSF-corrected GMNAA across all four cerebral lobes was then quantified for each subject using linear least squares fits yielding slope and intercept with corresponding r and P values for the regression line. In addition to the previously mentioned voxels with line width < 2 or > 10 Hz, voxels with less than 60% tissue volume, less than 60% tissue fraction cortical gray matter, or greater than 10% tissue fraction subcortical gray matter plus lesions were then excluded from this regression. To explore the effect of cognitive status on the GM-CMRglc-to-GMNAA relationship, a one-way analysis of variance (ANOVA) was carried out across the sample population examining the effect of CDR score (three levels: 0 = cognitively normal, 0.5 = cognitively impaired, 1 = demented) on the slope of the regression line. P < 0.05 was the criterion for statistical significance for all tests.
RESULTS
Figure 1 displays 18FDG-PET as well as coregistered T1-weighted MRI, 1H MRSI NAA metabolite, and tissue-segmented MR images from a representative study subject. A sample regression plot of CSF-corrected GMPET against CSF-corrected GMNAA is shown in Fig. 2. Linear least squares fit yielded a line with slope 0.7 IU−1 and intercept 1.2 (r = 0.556, P < 10−6, df = 210). Results of the GMPET-against-GMNAA regression analysis are presented in Table 2. Linear plots with significant r-values resulted for 18 of 19 subjects. The one subject with a nonsignificant regression had a slope of 0 IU−1 and an intercept of 1.8. For the remaining 18 subjects, the slope ranged 0.2–1.3 IU−1 and the intercept ranged 1.0–1.8.
FIG. 1.
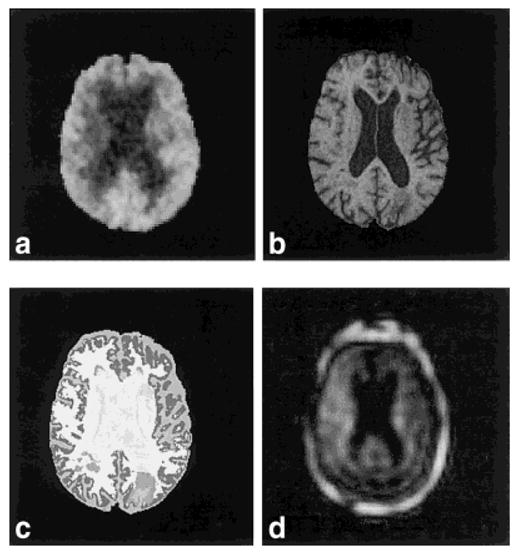
Axial-oblique section (oriented parallel to optic nerve in saggital plane) in multiple image modalities of a typical study subject (AD330, a 79-year-old male demented + lacune patient). a: 18FDG-PET. b: T1-weighted MRI. c: Tissue-segmented MRI (image color-coded for the following tissue types: white matter, lesion, cortical gray matter, subcortical gray matter, sulcal CSF, ventricular CSF). d: 1H MRSI NAA metabolite image (including lipid perimeter).
FIG. 2.
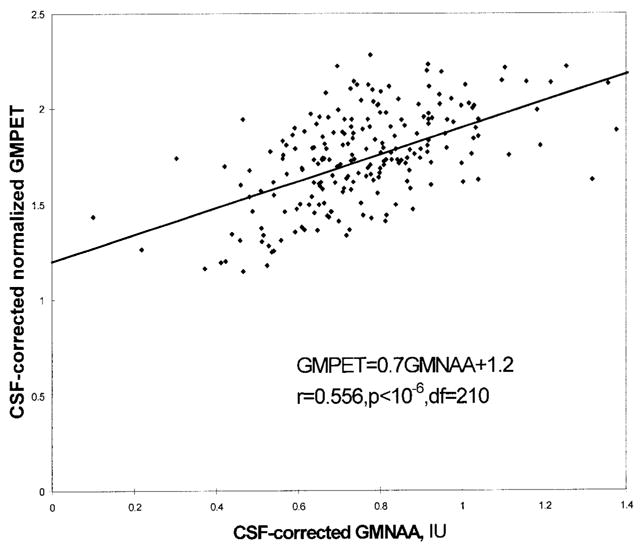
Voxelwise plot of MRSI-derived gray matter 18FDG-PET radioactivity (GMPET) normalized to whole-brain radioactivity vs. gray matter [NAA] (GMNAA) for a representative subject (AD355, a cognitively impaired patient) including linear regression fit line. GMNAA is in institutional units, IU. Both measures have been corrected for the volume occupied by CSF in each voxel. The plot is over all MRSI voxels scanned that have met the following inclusion criteria: tissue volume fraction ≥ 0.60, gray matter tissue fraction ≥ 0.60, and tissue fraction subcortical gray matter plus lesions < 0.10. This yielded a total of 212 voxels for this patient.
Table 2.
Results of Normalized Gray Matter PET Activity/Gray Matter [NAA] Regression Analysis
| Subject | Group | CDR | Slope | Intercept | r | df |
|---|---|---|---|---|---|---|
| AD330 | D+L | 1.0 | 0.5 ± 0.1 | 1.6 ± 0.1 | 0.332** | 198 |
| AD365 | D+L | 1.0 | 0.5 ± 0.2 | 1.4 ± 0.1 | 0.228* | 63 |
| AD398 | D+L | 1.0 | 0.4 ± 0.1 | 1.6 ± 0.0 | 0.304** | 189 |
| AD403 | D+L | 1.0 | 0.3 ± 0.2 | 1.6 ± 0.1 | 0.170* | 150 |
| AD418 | D+L | 1.0 | 0.6 ± 0.1 | 1.5 ± 0.0 | 0.337*** | 319 |
| AD443 | D+L | 1.0 | 0.5 ± 0.1 | 1.4 ± 0.0 | 0.467*** | 234 |
| AD483 | D+L | 1.0 | 0.0 ± 0.1 | 1.8 ± 0.1 | 0.048† | 124 |
| AD366 | CI+L | 0.5 | 0.5 ± 0.1 | 1.4 ± 0.1 | 0.314*** | 284 |
| AD383 | CI+L | 0.5 | 1.3 ± 0.2 | 1.0 ± 0.1 | 0.598*** | 96 |
| AD389 | CI+L | 0.5 | 0.2 ± 0.1 | 1.8 ± 0.1 | 0.214* | 83 |
| AD468 | CI | 0.5 | 0.7 ± 0.1 | 1.2 ± 0.0 | 0.584*** | 270 |
| AD494 | CI+L | 0.5 | 0.2 ± 0.1 | 1.5 ± 0.1 | 0.203* | 118 |
| AD337 | CN+L | 0.0 | 0.6 ± 0.1 | 1.6 ± 0.1 | 0.381*** | 245 |
| AD504 | CN+L | 0.0 | 0.9 ± 0.1 | 1.1 ± 0.1 | 0.503*** | 275 |
| AD506 | CN+L | 0.0 | 0.8 ± 0.1 | 1.2 ± 0.1 | 0.517*** | 261 |
| AD351 | D | 1.0 | 1.1 ± 0.1 | 1.1 ± 0.1 | 0.627*** | 160 |
| AD462 | D | 1.0 | 0.4 ± 0.1 | 1.7 ± 0.1 | 0.312** | 138 |
| AD355 | CI | 0.5 | 0.7 ± 0.1 | 1.2 ± 0.1 | 0.556*** | 210 |
| AD410 | CI | 0.5 | 0.5 ± 0.1 | 1.3 ± 0.0 | 0.437*** | 242 |
Slope and intercept values are ± SEM. Slope [ = ] IU−1; intercept is unitless.
P = ns,
P < 0.05,
P < 0.001,
P < 10−6 (regression P). For abbreviations see Table 1.
An example of a regression plot of CSF-corrected GMC-MRglc vs. CSF-corrected GMNAA appears in Fig. 3. Linear least squares fit yielded a regression slope of 1.5 mg · glu/100 g · tissue/min/IU and an intercept of 2.8 mg · glu/100 g · tissue/min (r = 0.292, P < < 0.001, df = 319). Results of the GMCMRglc vs. GMNAA regression analysis are presented in Table 3. Linear plots with significant r-values resulted for 10 of 10 subjects. The slope ranged 0.7–2.7 mg · glu/100 g · tissue/min/IU. The intercept ranged 0.8–4.8 mg · glu/100 g · tissue/min.
FIG. 3.
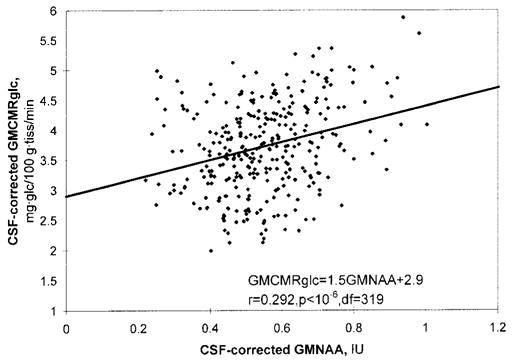
Voxelwise plot of 18FDG-PET-derived gray matter CMRglc (GMCMRglc) vs. MRSI-derived gray matter [NAA] (GMNAA) for a representative subject (AD418, a demented + lacune patient) including linear regression fit line. GMNAA is in institutional units, IU. Both measures have been corrected for the volume occupied by CSF in each voxel. The plot is over all MRSI voxels scanned which have met the following inclusion criteria: tissue volume fraction ≥ 0.60, gray matter tissue fraction ≥ 0.60, and tissue fraction subcortical gray matter plus lesions < 0.10. This yielded a total of 321 voxels for this patient.
Table 3.
Results of Gray Matter CMRglc/Gray Matter [NAA] Regression Analysis
| Subject | Group | CDR | Slope | Intercept | r | df |
|---|---|---|---|---|---|---|
| AD398 | D+L | 1.0 | 0.8 ± 0.2 | 2.8 ± 0.1 | 0.245** | 189 |
| AD365 | D+L | 1.0 | 1.2 ± 0.6 | 2.4 ± 0.3 | 0.272* | 61 |
| AD418 | D+L | 1.0 | 1.5 ± 0.3 | 2.9 ± 0.2 | 0.292*** | 319 |
| AD330 | D+L | 1.0 | 1.4 ± 0.6 | 3.6 ± 0.4 | 0.237* | 84 |
| AD403 | D+L | 1.0 | 0.7 ± 0.3 | 3.6 ± 0.2 | 0.169* | 154 |
| AD366 | CI+L | 0.5 | 1.3 ± 0.3 | 3.6 ± 0.2 | 0.288*** | 284 |
| AD462 | D | 1.0 | 1.0 ± 0.3 | 4.8 ± 0.2 | 0.279** | 138 |
| AD410 | CI | 0.5 | 1.7 ± 0.2 | 3.6 ± 0.1 | 0.459*** | 242 |
| AD383 | CI+L | 0.5 | 2.6 ± 0.4 | 0.8 ± 0.2 | 0.561*** | 96 |
| AD506 | CN+L | 0.0 | 2.7 ± 0.3 | 3.7 ± 0.2 | 0.507*** | 261 |
Slope and intercept values are ± SEM. Slope [ = ] mg · glu/100 g · tissue/min/IU; intercept [ = ]mg · glu/100 g · tissue/min.
P < 0.05,
P < 0.001,
P < 10−6 (regression P). For abbreviations see Table 1.
One-way ANOVA yielded a significant effect of subject CDR on the GMCMRglc-against-GMNAA regression slope (one-way ANOVA: F(2,7) = 6.97, P < 0.05) with the slope decreasing with increasing CDR. The GMPET-against-GM-NAA regression slope also decreased with increasing CDR, but not significantly so (one-way ANOVA: F(2,16) = 0.985, ns).
DISCUSSION
The major findings of this study were 1) a quantitative method was developed to correlate CMRglc and [NAA] in cortical gray matter in vivo, accounting for the differing spatial resolutions of 18FDG-PET and 1H MRSI; 2) relative and/or absolute PET measures of gray matter CMRglc were found to increase linearly with increasing gray matter [NAA] in 18 of 19 individual subjects; 3) the relationship of [NAA] to absolute CMRglc in gray matter was found to vary with cognitive status across subjects.
The first major finding was that a quantitative method was demonstrated to analyze 18FDG-PET and 1H MRSI-derived NAA data. Earlier studies have combined 18FDG-PET with NAA measures using single-voxel (21–23) or SI methodologies (24–27). However, none of these studies accounted rigorously for the different image resolutions of PET and MRS. Most studies relied on visual inspection of PET and MRS regions of interest to assess gross tissue content. Only one report (22) included a quantitative analysis of region-of-interest tissue composition and this was limited to percentages of normal vs. pathological tissue. The present method, however, yielded individual-voxel values of CMRglc and [NAA] accounting for the difference in PET and MRSI resolution. Furthermore, this analysis reported separate values for the contribution of gray matter to CMRglc and to [NAA], using information from tissue-segmented MRI. This is important because both [NAA] (28–30) and CMRglc (17,18) vary with tissue composition.
The second major finding was that gray matter CMRglc and NAA measures were significantly correlated in individual subjects. This was observed for 18 of 19 subjects for the relative measure of gray matter CMRglc (local voxel GMPET activity normalized to mean whole-brain GMPET activity). It was also observed for the absolute measure GMCMRglc in all 10 subjects for whom this measure was available. The values of CMRglc measured in the present study are in the same range as those reported in the literature (17,31–34). To the extent that [NAA] can be taken as a marker of neurons (5–6), this suggest that the metabolic activity measured by 18FDG-PET in a sample of gray matter increases with the density of neurons present in that gray matter sample and/or with the quantity of NAA within those neurons.
The third major finding was that the slope of the GMC-MRglc-against-GMNAA regression decreased with increasing CDR across subjects, suggesting that CMRglc per neuron is lower in cognitively impaired and demented subjects than in cognitively normal subjects. This explanation is consistent with the idea that diminished cortical metabolism is a physiologic substrate of dementia, regardless of etiology (7, for a review see Ref. 18). It also suggests that such hypometabolism may be due not simply to losses in neuron numbers in gray matter, but to an alternative or concomitant decrease in the metabolic activity per neuron of those neurons remaining.
Another interesting observation was that the regression lines of GMCMRglc-against-GMNAA as well as of GMPET-against-GMNAA extrapolated to zero value GM-NAA provided a substantial positive value for all subjects. If GMCMRglc represented exclusively neuronal metabolism, GMCMRglc would be expected to have a value much closer to zero at zero value GMNAA. The observation of a large positive value suggests that at least part of the GMCMRglc signal measured by 18FDG-PET might be produced by tissues with little or no NAA content, e.g., by glial cells. This is consistent with reports that glial cells are responsible for a substantial fraction of brain glucose consumption (4). Similarly, Luyten et al. (24) found both decreased [NAA] and greatly increased CMRglc in an oligoastrocytoma in a single patient, possibly suggesting proliferation or enhanced metabolic activity on the part of glial cells in the tumour. Other possibilities, however, which cannot be excluded, are that [NAA] may not be an accurate or an exclusive index of neuron numbers, but may also be sensitive to neuronal metabolism, or that NAA exists in appreciable quantities in other cell types besides neurons. In such cases, an extrapolated value of zero GM-NAA might not indicate absence of neurons.
A major limitation of this study is the assumption that [NAA] correlates with neuron density. Recent MRS studies showed NAA recovery after initial NAA loss under inflammation (35), suggesting that NAA may also reflect neuronal metabolism and not simply neuron density. However, it is unlikely that the population in this study suffered from inflammation that might have caused NAA losses. There are also other limitations. First, due to prohibitively long acquisition times, metabolite relaxation times T1 and T2 were not measured, hence, [NAA] was reported in institutional units (IU) instead of in millimoles. Therefore, intersubject differences in [NAA] could be masked or mimicked by differences in T1 and T2 relaxation properties between subjects. One MRS study, however, has found no effect of cognitive status on T1 and T2 values (36). Another limitation was that the study population was heterogeneous with respect to cognitive status and presence of vascular disease, in particular subcortical lacunar infarcts. The number of subjects was not balanced between the subgroups and was small in some subgroups. This population, however, offered a broader-than-normal range of metabolic activity and NAA levels over which to test the method, as both metabolic activity (37,38) and NAA levels (9,36,39) have been shown to differ in cognitively normal and demented subjects. We have no a priori reason to suspect that the validity of the method is compromised either by the presence of lacunes or by cognitive impairment. Finally, the GMPET/GMNAA and GMCMRglc/GMNAA regressions performed in the present study were biased to those MRSI voxels that were richest in cortical gray matter. These voxels tended to produce higher signal-to-noise PET and NAA data. Regressions performed over a wider range of voxel selections might yield different results. In studying patients suffering from neurodegenerative conditions one might consider, for example, that those voxels with the highest cortical gray matter content would tend to come from the areas of the cortex least affected by atrophy. Thus, potential effects of cortical pathology on CMRglc-to-[NAA] relations might be missed because one is sampling the ”healthiest“ part of the cortex. These limitations notwithstanding, this study demonstrates an association between CMRglc and NAA levels in cortical gray matter of human subjects. MRI and MRSI methodologies may provide useful in vivo evidence for discerning the various tissue, and perhaps even cellular, substrates of PET signal generation.
Acknowledgments
This work was supported by grants AG10129 (UC Davis Alzheimer’s Center), AG10897, and AG12535 from the National Institutes of Health.
References
- 1.Jagust WJ. Functional imaging in dementia: an overview. J Clin Psychiatry. 1994;55(suppl):511. [PubMed] [Google Scholar]
- 2.Jagust WJ. Functional imaging patterns in Alzheimer’s disease. Relationships to neurobiology. Ann NY Acad Sci. 1996;777:30–36. doi: 10.1111/j.1749-6632.1996.tb34398.x. [DOI] [PubMed] [Google Scholar]
- 3.Jagust WJ, Budinger TF. New neuroimaging techniques for investigating of brain-behavior relationships. Nida Res Monogr. 1992;124:95–115. [PubMed] [Google Scholar]
- 4.Magistretti JP, Pellerin L. Cellular mechanisms of brain energy metabolism. Relevance to functional brain imaging and to neurodegenerative disorders. Ann NY Acad Sci. 1996;777:380–87. doi: 10.1111/j.1749-6632.1996.tb34449.x. [DOI] [PubMed] [Google Scholar]
- 5.Urenjak J, Williams SR, Gadian DG, Noble M. Specific expression of N-acertylaspartate in neurons, oligodendrocyte-type-2 astrocyte progenitors, and immature oligodendrocytes in vitro. J Neurochem. 1992;59:55–61. doi: 10.1111/j.1471-4159.1992.tb08875.x. [DOI] [PubMed] [Google Scholar]
- 6.Urenjak J, Williams SR, Gadian DG, Noble M. Proton nuclear magnetic resonance spectroscopy unambiguously identifies different neural cell types. J Neurosci. 1993;13:981–989. doi: 10.1523/JNEUROSCI.13-03-00981.1993. [DOI] [PMC free article] [PubMed] [Google Scholar]
- 7.Kwan LT, Reed BF, Eberling JL, Jagust WJ, Schuff N, Tanabe J, Norman D, Weiner MW. Effects of subcortical cerebral infarction on cortical glucose metabolism and cognitive function. Arch Neurol. 1999;56:809–814. doi: 10.1001/archneur.56.7.809. [DOI] [PMC free article] [PubMed] [Google Scholar]
- 8.Tanabe J, Amend D, Schuff N, DiSclafani V, Ezekiel F, Norman D, Fein G, Weiner MW. Tissue segmentation of the brain in Alzheimer’s disease. Am J Neuroradiol. 1997;18:115–123. [PMC free article] [PubMed] [Google Scholar]
- 9.Schuff N, Amend D, Ezekiel F, Steinman SK, Tanabe J, Norman D, Jagust W, Kramer JF, Mastrianni JA, Fein G, Weiner MW. Changes of hippocampal N-acetyl aspartate and volume in Alzheimer’s disease: a proton MR spectroscopic imaging and MRI study. Neurology. 1997;49:1513–1521. doi: 10.1212/wnl.49.6.1513. [DOI] [PubMed] [Google Scholar]
- 10.MacKay S, Ezekiel F, Di Sclafani V, Meyerhoff DJ, Gerson J, Norman D, Fein G, Weiner MW. Alzheimer disease and subcortical ischemic vascular dementia: evaluation by combined MR image segmentation and 1H MR spectroscopic imaging. Radiology. 1996;198:537–545. doi: 10.1148/radiology.198.2.8596863. [DOI] [PMC free article] [PubMed] [Google Scholar]
- 11.Rooney WD, Miller RG, Gelinas D, Schuff N, Maudsley AA, Weiner MW. Decreased N-acetylaspartate in motor cortex and corticospinal tract in ALS. Neurology. 1998;50:1800–1805. doi: 10.1212/wnl.50.6.1800. [DOI] [PubMed] [Google Scholar]
- 12.Haupt CI, Schuff N, Weiner MW, Maudsley AA. Lipid removal in 1H spectroscopic imaging by data extrapolation. Magn Reson Med. 1996;35:678–687. doi: 10.1002/mrm.1910350509. [DOI] [PMC free article] [PubMed] [Google Scholar]
- 13.Soher BJ, Young K, Govindaraju V, Maudsley AA. Automated spectral analysis III: application to in vivo proton MR spectroscopy and spectroscopic imaging. Magn Reson Med. 1998;40:822–831. doi: 10.1002/mrm.1910400607. [DOI] [PubMed] [Google Scholar]
- 14.MacKay S, Meyerhoff DJ, Constans JM, Norman D, Fein G, Weiner MW. Regional gray and white matter metabolite differences in subjects with AD, with subcortical ischemic vascular dementia, and elderly controls with 1H magnetic resonance spectroscopic imaging. Arch Neurol. 1996;53:167–174. doi: 10.1001/archneur.1996.00550020079018. [DOI] [PMC free article] [PubMed] [Google Scholar]
- 15.Müller-Gärtner HW, Links JM, Prince JL, Bryan RN, McVeigh E, Leal JP, Davatzikos C, Frost JJ. Measurement of radiotracer concentration in brain gray matter using positron emission tomography: MRI-based correction for partial volume effects. J Cereb Blood Flow Metab. 1992;12:571–583. doi: 10.1038/jcbfm.1992.81. [DOI] [PubMed] [Google Scholar]
- 16.Jagust W, Eberling JL, Richardson BC, Reed BR, Baker MG, Nordahl TE, Budinger TF. The cortical topography of temporal lobe hypometabolism in early Alzheimer’s disease. Brain Res. 1993;629:189–198. doi: 10.1016/0006-8993(93)91320-r. [DOI] [PubMed] [Google Scholar]
- 17.Phelps ME, Huang SC, Hoffmann EJ, Kuhl DE. Validation of tomographic measurement of local cerebral glucose metabolic rate in human with (F-18)2-fluoro-2-deoxyglucose: validation of method. Ann Neurol. 1979;6:371–388. doi: 10.1002/ana.410060502. [DOI] [PubMed] [Google Scholar]
- 18.Labbé C, Froment JC, Kennedy A, Ashburner J, Cinotti L. Positron emission tomography metabolic data corrected for cortical atrophy using magnetic resonance imaging. Alzheimer Dis Assoc Disord. 1996;10:141–170. doi: 10.1097/00002093-199601030-00005. [DOI] [PubMed] [Google Scholar]
- 19.Wienhard K, Dahlbom M, Eriksson L, Michel C, Bruckbauer T, Pietrzyk U, Heiss W-D. The ECAT EXACT HR: Performance of a new high resolution positron scanner. J Comput Assist Tomogr. 1994;18:110–118. [PubMed] [Google Scholar]
- 20.Woods RP, Cherry SR, Mazziotta JC. Rapid automated algorithm for aligning and reslicing PET images. J Comput Assist Tomogr. 1992;16:620–633. doi: 10.1097/00004728-199207000-00024. [DOI] [PubMed] [Google Scholar]
- 21.Alger JR, Frank JA, Bizzi A, Fulham MJ, DeSouza BX, Duhaney MO, Inscoe SW, Black JL, van Zijl PCM, Moonen CTW, Di Chiro G. Metabolism of human gliomas: assessment with H-1 spectroscopy and F-18 fluorodeoxyglucose PET. Radiology. 1990;177:633–641. doi: 10.1148/radiology.177.3.2243962. [DOI] [PubMed] [Google Scholar]
- 22.Anderson JH, Strandberg JD, Wong DF, Conti PS, Barker PB, Blackband SJ, Hilton J, Natarajan TK, Dannals RF, Samphilipo MA, Magee CA, Burckhardt DD. Multimodality correlative study of canine brain tumors: proton magnetic resonance spectroscopy, positron emission tomography, and histology. Invest Radiol. 1994;29:597–605. doi: 10.1097/00004424-199406000-00001. [DOI] [PubMed] [Google Scholar]
- 23.Lu D, Margouleff C, Rubin E, Labar D, Schaul N, Ishikawa T, Kazumata K, Antonini A, Dhawan V, Hyman RA, Eidelberg D. Temporal lobe epilepsy: correlation of proton magnetic resonance spectroscopy and 18F-fluorodeoxyglucose positron emission tomography. Magn Reson Med. 1997;37:18–23. doi: 10.1002/mrm.1910370105. [DOI] [PubMed] [Google Scholar]
- 24.Luyten PR, Marien AJH, Heindel W, van Gerwen PHJ, Herholz K, den Hollander JA, Friedmann G, Heiss W-D. Metabolic imaging of patients with intracranial tumors: H-1 MR spectroscopic imaging and PET. Radiology. 1990;176:791–799. doi: 10.1148/radiology.176.3.2389038. [DOI] [PubMed] [Google Scholar]
- 25.Preul MC, LeBlanc R, Cendes F, Dubeau F, Reutens D, Spreafico R, Battaglia G, Avoli M, Langevin P, Arnold DL, Villemure JG. Function and organization in dysgenic cortex. Case report J Neurosurg. 1997;87:113–121. doi: 10.3171/jns.1997.87.1.0113. [DOI] [PubMed] [Google Scholar]
- 26.Duncan DB, Herholz K, Kugel H, Roth B, Ruitenbeek W, Heindel W, Wienhard K, Heiss W-D. Positron emission tomography and magnetic resonance spectroscopy of cerebral glycolysis in children with congenital lactic acidosis. Ann Neurol. 1995;37:351–358. doi: 10.1002/ana.410370311. [DOI] [PubMed] [Google Scholar]
- 27.Yoshino E, Ohmori Y, Imahori Y, Higuchi T, Furuya S, Naruse S, Mori T, Suzuki K, Yamaki T, Ueda S, Tsuzuki T, Takai S. Irradiation effects on the metabolism of metastatic brain tumors: analysis by positron emission tomography and 1H-magnetic resonance spectroscopy. Stereotact Funct Neurosurg. 1996;66(suppl 1):240–259. doi: 10.1159/000099816. [DOI] [PubMed] [Google Scholar]
- 28.Hetherington HP, Pan JW, Mason GF, Adams D, Vaughan MJ, Twieg DB, Pohost GM. Quantitative 1H spectroscopic imaging of human brain at 4.1 T using image segmentation. Magn Reson Med. 1996;36:21–29. doi: 10.1002/mrm.1910360106. [DOI] [PubMed] [Google Scholar]
- 29.Hetherington HP, Mason GF, Pan JW, Ponder SL, Vaughan JT, Twieg DB, Pohost GM. Evaluation of cerebral gray and white matter metabolite differences by spectroscopic imaging at 4.1 T. Magn Reson Med. 1994;32:565–571. doi: 10.1002/mrm.1910320504. [DOI] [PubMed] [Google Scholar]
- 30.Lim KO, Spielman DM. Estimating NAA in cortical gray matter with applications for measuring changes due to aging. Magn Reson Med. 1997;37:372–377. doi: 10.1002/mrm.1910370313. [DOI] [PubMed] [Google Scholar]
- 31.Duara R. Utilization of positron emission tomography for research and clinical applications. In: Duara R, editor. Positron emission tomography in dementia. New York: Wiley-Liss; 1990. pp. 1–12. [Google Scholar]
- 32.Duara R, Loewenstein DA, Barker WW. Utilization of behavioral activation paradigms for positron emission tomography studies in normal young and elderly subjects and in dementia. In: Duara R, editor. Positron emission tomography in dementia. New York: Wiley-Liss; 1990. pp. 1311–148. [Google Scholar]
- 33.Horwitz B. Quantification and analysis of positron emission tomography metabolic data. In: Duara R, editor. Positron emission tomography in dementia. New York: Wiley-Liss; 1990. pp. 13–70. [Google Scholar]
- 34.Chawluk JB, Fazekas F, Alavi A, Dann R, Bais S, Reivich M. Effect of cerebral atrophy in positron emission tomography studies of aging and dementia. In: Duara R, editor. Positron emission tomography in dementia. New York: Wiley-Liss; 1990. pp. 71–92. [Google Scholar]
- 35.Kalra S, Cashman NR, Genge A, Arnold DL. Recovery of N-acetylaspartate in corticomotor neurons of patients with ALS after riluzole therapy. Neuroreport. 1998;9:1757–1761. doi: 10.1097/00001756-199806010-00016. [DOI] [PubMed] [Google Scholar]
- 36.Moats RA, Ernst T, Shonk TK, Ross BD. Abnormal cerebral metabolite concentrations in patients with probable Alzheimer disease. Magn Reson Med. 1994;32:110–115. doi: 10.1002/mrm.1910320115. [DOI] [PubMed] [Google Scholar]
- 37.Sultzer DL, Mahler ME, Cummings JL, Van Gorp WG, Hinkin CH, Brown C. Cortical abnormalities associated with subcortical lesions in vascular dementia. Arch Neurol. 1995;52:773–780. doi: 10.1001/archneur.1995.00540320049012. [DOI] [PubMed] [Google Scholar]
- 38.Jagust WJ, Haan MN, Eberling JL, Wolfe N, Reed BR. Functional imaging predicts cognitive decline in Alzheimer’s disease. J Neuroimaging. 1996;6:156–160. doi: 10.1111/jon199663156. [DOI] [PubMed] [Google Scholar]
- 39.Schuff N, Amend DL, Meyerhoff DJ, Tanabe JL, Norman D, Fein G, Weiner MW. Alzheimer disease: quantitative H-1 MR spectroscopic imaging of frontoparietal brain. Radiology. 1998;207:91–102. doi: 10.1148/radiology.207.1.9530304. [DOI] [PMC free article] [PubMed] [Google Scholar]