

Abstract
Mixed reconstituted systems containing CYP2B4, CYP1A2 and NADPH-cytochrome P450 reductase were previously shown to exhibit a dramatic inhibition of 7-pentoxyresorufin-O-dealkylation (PROD) when compared to simple reconstituted systems containing reductase and a single P450 enzyme, results consistent with the formation of CYP1A2-CYP2B4 complexes where the reductase binds with high affinity to the CYP1A2 moiety of the complex. In this report, we provide evidence for an interaction between CYP1A2 and CYP2E1. Synergism of 7-ethoxyresorufin-O-deethylation (EROD) and PROD was observed when these P450s were combined in mixed reconstituted systems at subsaturating reductase concentrations. Higher ionic strength attenuated the synergistic stimulation of both PROD and EROD in mixed reconstituted systems, consistent with disruption of heteromeric CYP2E1-CYP1A2 complexes. The effect of ionic strength was further examined as a function of reductase concentration. At lower ionic strength, there was a significant synergistic stimulation of EROD. This synergistic stimulation diminished with increasing reductase concentration, resulting in an additive response as reductase became saturating. Interestingly, at high ionic strength, the synergism of EROD in the mixed reconstituted system was not observed. In contrast, mixed reconstituted systems containing CYP2E1 and CYP2B4 did not provide evidence for the formation of these heteromeric P450-P450 complexes. The synergistic stimulation observed with the reductase-CYP1A2-CYP2E1 mixed reconstituted system is consistent with the formation of a CYP1A2-CYP2E1 complex. Taken together with the lack of a kinetically detectable interaction between CYP2B4 and CYP2E1, and the previously reported CYP1A2-CYP2B4 interaction, these results suggest that CYP1A2 may facilitate the formation of complexes with other P450 enzymes.
The cytochrome P450 (P450) superfamily of proteins is functionally diverse, and well distributed in nature. In addition to their roles in the metabolism of numerous endogenous compounds, P450s are important contributors to drug metabolism, primarily by catalyzing the insertion of an oxygen atom into a substrate molecule. NADPH cytochrome P450 reductase (reductase) is the major electron transfer partner, and is required for the majority of NADPH-dependent oxidation reactions. Multiple forms of cytochrome P450 exist in the endoplasmic reticulum in a large excess over reductase (1), with the ratio of P450 to reductase dependent on the induction status and the tissue examined (2). Since reductase and P450 form a 1:1 molar complex (3, 4), those P450s not in an electron transfer complex with reductase are metabolically silent.In some cases cytochrome b5 can transfer the second electron to particular P450s (5). Interactions between reductase and P450, reductase and cytochrome b5, and also P450 and cytochrome b5, have been described as being predominately electrostatic in nature (6-17). The potential of reductase interacting with discrete populations of P450 clusters and or mobilizing P450 into smaller functional oligomers (18-20) suggests the possibility of multiple homomeric and heteromeric P450 binding sites, in addition to the residues that align P450 with redox partners. Despite the interest in their molecular organization, many of the protein-membrane, and protein-protein interactions among multiple P450 enzymes, and the limiting amounts of some of the necessary electron transfer proteins remains unclear.
The presence of multiple P450 enzymes, capable of forming homomeric and heteromeric complexes, suggests the possibility for multiple protein-protein interactions. The presence of one P450 has been shown to influence the catalytic characteristics of a second enzyme through the formation of heteromeric P450 complexes (21). Such a complex has been reported using mixed reconstituted systems containing NADPH-cytochrome P450 reductase, CYP2B4 and CYP1A2, where a dramatic inhibition of PROD was observed when compared to simple reconstituted systems containing reductase and a single P450 enzyme (21, 22). The interaction has also been reported in microsomal preparations (23). Interestingly, the inhibition of PROD reported in these mixed reconstituted systems was relieved at high ionic strength, consistent with disruption of a charge-paired CYP2B4-CYP1A2 complex (24).
The goal of the present study was to evaluate possible functional interactions between CYP1A2 with CYP2E1, and CYP2E1 with CYP2B4. The present report demonstrates that, when together in a mixed reconstituted system, complexes between CYP2E1 and CYP1A2 behave differently than when present in simple binary systems containing reductase and a single P450. These results support the view that a ternary complex among reductase, CYP1A2 and CYP2E1 is formed in mixed reconstituted systems. The interaction between CYP2E1 and CYP1A2 was sensitive to alterations in ionic strength, consistent with complex formation being controlled by charge-pair interactions and, consistent with a previous report with CYP2B4 and CYP1A2 (24). In similar experiments with different P450s, functional interactions between CYP2E1 and CYP2B4 were not observed suggesting that some P450s may more readily form P450-P450 complexes – implicating CYP1A2 in that role.
EXPERIMENTAL PROCEDURES
Chemicals
β-naphthoflavone (βNF), 7-pentoxyresorufin (7-PR), 7-ethoxyresorufin (7-ER), resorufin, nitrosodimethylamine (NDMA), formaldehyde, aniline, p-amino phenol, NADP+ glucose-6-phosphate, glucose 6 phosphate dehydrogenase, magnesium chloride, potassium phosphate, potassium acetate, magnesium chloride, HEPES, EDTA, a protease inhibitor cocktail (containing: AEBSF, EDTA, Bestatin, Pepstatin A, and E-64) and glycerol were obtained from Sigma (St. Louis, MO). C41 cells were purchased through Avidis SA (Biopole Clermont-Limagne, France). Plasmid Mini, Midi, and Maxi kits were purchased from Qiagen Inc. (Valencia, CA). All restriction enzymes were purchased through New England Biolabs (Beverly, Ma). Protein extraction reagent BPER® and Alkaline Phosphatase immunoblot developing kit were obtained from Pierce Chemical Company (Rockford, IL).
Protein isolation
Recombinant rabbit NADPH cytochrome P450 reductase [plasmid: pSC-CPR, provided by Dr. Lucy Waskell (Department of Anesthesiology, U. Michigan)] was expressed in C41 Escherichia coli (E.coli), solubilized and purified according to a modification of previously described methods (25, 26). Minor modifications were made for the expression and purification protocol of recombinant rabbit CYP2B4 previously described (27). CYP1A2 was isolated from βNF treated rabbit liver microsomes as previously described (28). CYP2E1 was expressed and purified according to Cheng et al. (29).
P450 levels were determined by measuring the carbon monoxy-ferrous complex using an extinction coefficient of 91 mM-1 cm-1 (30). The Lowry protein assay was used to determine total protein concentration from purified protein preparations using a BSA standard curve (31). NADPH-cytochrome P450 reductase content was determined from the absolute spectrum at 456 nm, using an extinction coefficient of 21.4 mM-1 cm-1 (32). The purity of reductase, CYP2B4, CYP2E1 and CYP1A2 was assessed by SDS gel electrophoresis with Coomassie Blue staining and immune blotting.
Reconstituted Systems
Catalytic activities of CYP1A2, CYP2E1 and CYP2B4 were determined using binary reconstituted systems containing (1) reductase and CYP2E1, (2) reductase and CYP1A2, or (3) reductase and CYP2B4, and mixed reconstituted systems containing (1) reductase, CYP2E1 and CYP1A2, or (2) reductase, CYP2E1 and CYP2B4 which were combined in DLPC. DLPC was prepared to a concentration of 8 mM in 50 mM potassium phosphate buffer, pH 7.25, containing 20% glycerol, 0.1 M NaCl, and 5 mM EDTA and sonicated for approximately 30 min using a bath sonicator, leading to significant clarification of the suspension. All experiments used a DLPC:P450 molar ratio of 160:1. The optimal ratios of phospholipid to P450 were based on previous studies (33). After mixing the proteins into the liposomes, the reconstituted systems were preincubated at room temperature for 2 h before the addition of the other assay components. These preincubation conditions permit the formation of stable interactions among the liposomal proteins (33). The reductase and P450 concentrations were approximately 4μM and 8μM, respectively during the preincubation step. After preincubation, the reconstituted systems were diluted with buffer and other assay components, and enzyme activities measured at 37 C within 30 seconds. The immediate mixing of the concentrated reconstituted systems is routinely done to minimize the potential diffusion of any protein lipid complexes that are formed during the preincubation step; however, in separate experiments, these complexes have been shown to be stable for at least 20 min after dilution with the other assay components.
Alkoxyresorufin Activity
Unless otherwise stated, the final assay conditions for 7-pentoxyresorufin-O-dealkylation (PROD), and 7-ethoxyresorufin-O-dealkylation (EROD) were: the reconstituted system (containing 0.05 μM P450, 0.025 μM reductase and 8 μM DLPC, or 0.05 μM for each P450, 0.05 μM reductase and 8 μM DLPC for the mixed reconstituted systems), and substrate (2.5 μM for 7-PR and 7-ER), in either HEPES (pH 7.5) or HEPES/acetate buffer (pH 7.5) containing 50 mM HEPES and potassium acetate as indicated in the Results section. HEPES and HEPES/Acetate buffer systems were used to vary ionic strength because they better supported NADPH-cytochrome P450 reductase dependent activities than did addition of salts such as MgCl2 (24). The buffer and salt concentrations used are described in the Figure legends. Reactions were initiated by the addition of NADPH to a final concentration of 0.5 mM. An Aminico Bowman Series 2 spectrofluorometer (Spectrum Unicam, Rochester, NY) was used to measure resorufin fluorescence using excitation and emission wavelengths of 559 and 585 for 7-PR; or 530 and 585 for 7-ER. Resorufin was used for generating standard curves.
N-nitrosodimethylamine Demethylation and Aniline Hydroxylation
NDMA demethylation was measured using a modification of the colorimetric method of (34), based on formaldehyde production as measured by the Nash reaction (35). Aniline hydroxylation was measured according to the method of (36). The final concentrations of assay components were the reconstituted systems (0.3 μM P450, 0.15 μM reductase and 48 μM DLPC for systems containing a single P450, or 0.3 for each P450, 0.3 μM reductase and 48 μM DLPC for the mixed reconstituted systems), substrate (2.0 mM NDMA or 5.0 mM aniline), and an NADPH regenerating system containing 0.5 mM NADP+, 5mM glucose-6-phosphate, 2.0 units/ml of glucose 6 phosphate dehydrogenase and 10 mM magnesium chloride in 100 mM potassium phosphate buffer, pH 7.25 in a final volume of 1 ml.
Molecular Modeling
Experimental data were fit to two models using the DynaFit modeling program (37, 38). The data were fit to a model where CYP1A2 and CYP2E1 could bind to reductase, but did not form kinetically observable CYP1A2-CYP2E1 complexes. This is referred to in the text as the simple competitive model. In the other model that was tested, CYP1A2 and CYP2E1 were able to form a CYP1A2-CYP2E1 complex. This complex had an altered ability to bind reductase. According to this model, reductase binding to the P450-P450 complex leads to an observed catalytic activity at subsaturating reducase that exceeds that of the reductase-CYP1A2 and reductase-CYP2E1 complexes alone. This model has been described in detail in previous reports (21, 24), and the script files are included in the supplementary information.
RESULTS
When combined with CYP2B4, CYP1A2 was previously reported to cause a significant inhibition of CYP2B4 selective 7-PR dealkylation at subsaturating reductase. These results are consistent with the formation of a heteromeric complex between these P450s (21). Recently, we demonstrated that the interaction between these P450s could be disrupted by high ionic strength, results supporting an electrostatic interaction between these P450s (24). The goal of the current study was to determine if similar interactions were observed with CYP2E1. Therefore, we examined the functional characteristics of CYP1A2-CYP2E1 and CYP2B4-CYP2E1 reconstituted systems. The metabolic behavior of simple reconstituted systems containing (1) reductase and CYP1A2, and (2) reductase and CYP2E1 were compared to the mixed reconstituted system containing both P450s. The results are shown in Fig 1. The molar ratio of reductase to P450 in these studies was 0.5:1, conditions expected to facilitate the selective association of reductase with a particular P450 and more closely mimic the subsaturating reductase levels observed in microsomes. If the proteins in the mixed reconstituted system were organized in the same manner as in the simple reconstituted systems, then the activity in the mixed system should be roughly equal to the sum of the rates of the binary systems. A significant synergism or inhibition would point to altered interactions among the proteins. N-nitrosodimethylamine (NDMA) is a substrate that is selective for CYP2E1 (Fig 1). In the mixed reconstituted system, the reaction rate was not significantly different from the sum of the rates of the binary systems, in 100 mM KPO4 (pH. 7.4). However, a quite different response was observed with 7-ethoxyresorufin (7-ER). 7ER is considered to be a CYP1A2 selective substrate, although there was a significant amount of metabolism by CYP2E1 observed in 50 mM HEPES (Fig 1). Metabolism of 7ER was synergistically stimulated in the mixed reconstituted system. These results are consistent with altered interactions among reductase, CYP2E1 and CYP1A2 when in a mixed reconstituted system, with the effect being dependent on the substrate present. Such a functional interaction between these P450 enzymes has not previously been reported.
Figure 1. CYP2E1 and CYP1A2 mediated N-nitrosodimethylamine (NDMA) demethylation and 7-ethoxyresorufin dealkylation (EROD) in simple and mixed reconstituted systems.
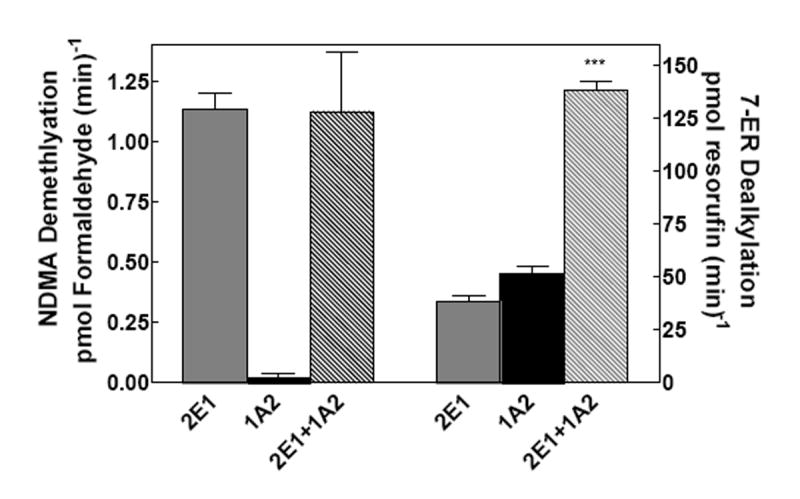
As an initial screening procedure to detect potential interactions between CYP1A2 and CYP2E1, dealkylation of NDMA and 7-ER was measured in simple reconstituted systems containing reductase and a single P450 (either CYP2E1 or CYP1A2), and mixed reconstituted systems containing reductase and both CYP2E1 and CYP1A2. Each binary reconstituted system contained 0.05 μM P450 (CYP1A2 or CYP2E1 alone), 0.025 μM reductase (CPR), and 8.0 μM DLPC. The mixed reconstituted system contained 0.05 μM CYP1A2, 0.05 μM CYP2E1, and 0.05 μM CPR. In the event that the proteins in the mixed reconstituted system are organized in much the same manner as in the binary systems, an additive effect would be expected. Interactions among the proteins would produce either a synergistic or inhibitory effect. Groups in the NDMA study represent the mean ± SEM for three determinations. Groups in the EROD study represent the mean ± SEM for four determinations. Significant differences in activities between the sum of the two binary systems compared to the mixed reconstituted system are indicated (*** p < 0.001).
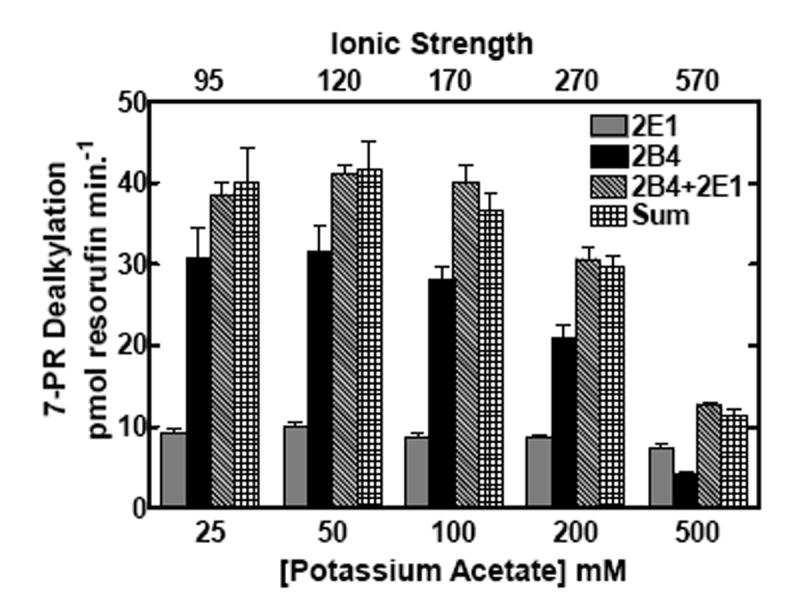
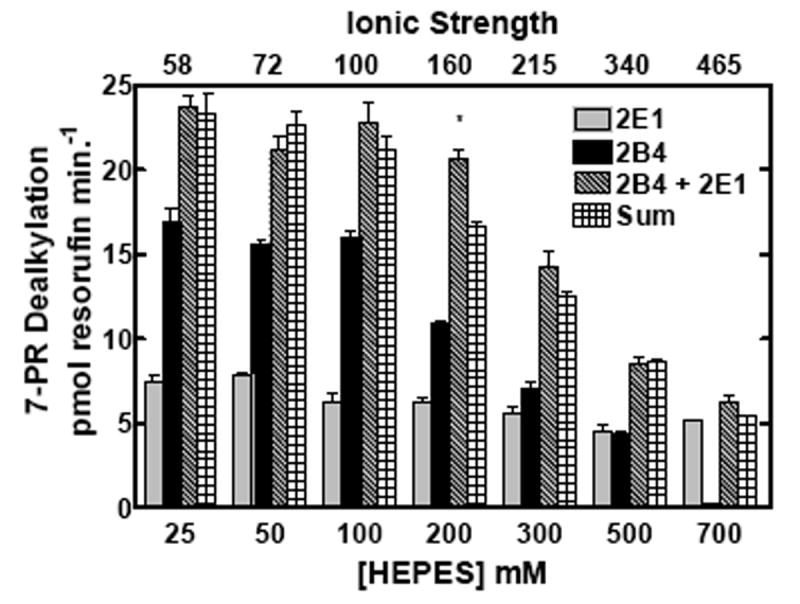
The behavior of these proteins in mixed reconstituted systems is analogous to that previously reported for CYP1A2 and CYP2B4 (21, 22), a response that was shown to be sensitive to changes in ionic strength (24). If the functional complexes between these P450s during 7-ER turnover are governed by electrostatic charge, then disruption by high ionic strength would be expected to attenuate EROD synergism in the mixed reconstituted systems. The effects of ionic strength on EROD and PROD in simple (CYP1A2 with reductase, or CYP2E1 with reductase) and mixed reconstituted systems (CYP1A2 + CYP2E1 with reductase) are shown in Fig 2. When looking at the binary systems at low ionic strength, both CYP2E1 and CYP1A2 had roughly equivalent EROD activities. However, these P450 enzymes exhibited quite different sensitivities to alteration in buffer concentration. With CYP2E1, maximal EROD was observed at the lowest buffer concentration measured, 25 mM HEPES and decreased in a linear manner as the buffer concentration was increased (Fig 2a). In contrast, maximal EROD activity of the CYP1A2 system increased to a maximum at 200 mM HEPES and declined with further increases in buffer concentration. Declining activities with increasing buffer concentrations were expected and have been attributed to the disruption of electrostatic interactions between reductase and P450, consistent with previous studies (6-14, 16, 17, 24, 39). When comparing EROD in the mixed reconstituted system to the sum of the rates of the binary systems (which can be seen by comparing the third and fourth bars from each group), a significant synergistic stimulation of EROD was observed at lower ionic strength; higher concentrations of HEPES relieved this synergism. A similar result was observed with the substrate 7-pentoxyresorufin (7PR), which was examined as a function of HEPES/acetate buffer concentration. The sensitivities of the binary systems were roughly similar to those observed in HEPES. In the mixed reconstituted systems, a synergistic stimulation of PROD was observed when compared to the sum of the binary systems. Again, the synergism reverted to a simple additive effect at high buffer concentrations. These results are consistent with recent results using the CYP1A2-CYP2B4 system (24), and demonstrate that reductase, CYP1A2 and CYP2E1 do interact in mixed reconstituted systems, and that these interactions can be disrupted by increasing ionic strength.
Figure 2. Effect of ionic strength on the interactions among reductase, CYP2E1, and CYP1A2.
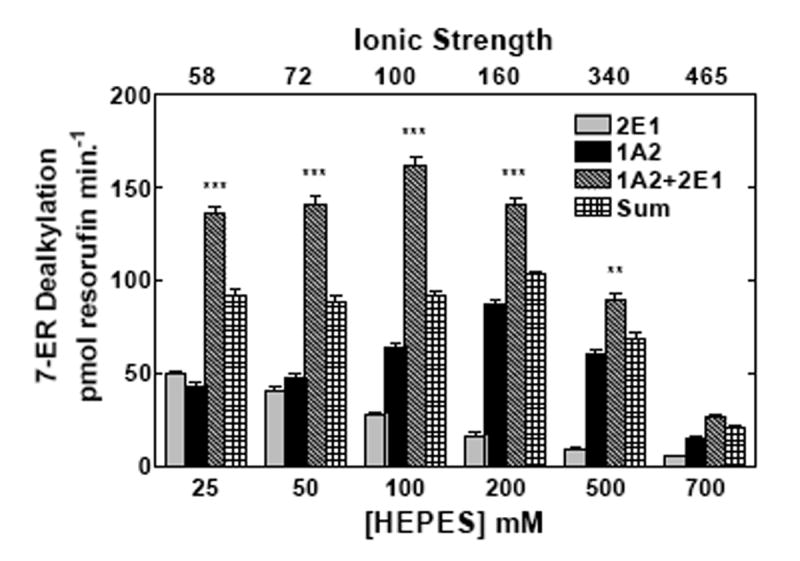
CYP2E1, CYP1A2 and reductase were reconstituted in binary (reductase and one P450) and ternary (reductase and both P450s) reconstituted systems. The first and second bars in each group represent binary CYP2E1 and CYP1A2 reconstituted activities, respectively. The third bar represents the results from the mixed reconstituted system, and the fourth bar represents the sum of the rates of the binary systems. EROD and PROD activity were measured under subsaturating conditions (0.5:1.0 reductase:P450). Each reconstituted system contained 0.05 μM P450 (CYP1A2 or CYP2E1 alone), 0.025 μM reductase (CPR), and 8.0 μM DLPC. The mixed reconstituted system contained 0.05 μM of both CYP1A2 and CYP2E1, and 0.05 μM CPR. Calculated ionic strength values for each buffer system are indicated as the top x-axis. Groups represent the mean ± SEM for three determinations. Significant differences in activities between the sum of the two binary systems compared to the mixed reconstituted system are indicated (* p < 0.05; ** p < 0.01; *** p < 0.001). (a) Effect of varying HEPES on EROD activity in simple and mixed reconstituted systems. (b) Effect of varying potassium acetate on PROD activity in simple and mixed reconstituted systems. Each buffer contained 50 mM HEPES and the potassium acetate concentration indicated.
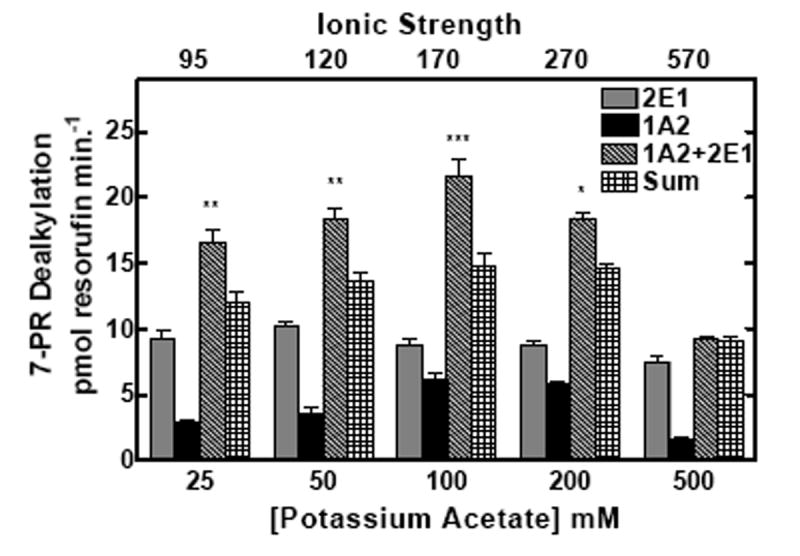
Since CYP1A2 appears to interact with both CYP2B4 (21, 23, 24) and CYP2E1 in a substrate dependent fashion, the activities of CYP2B4 and CYP2E1 in mixed reconstituted systems at sub-saturating reductase were also evaluated (Fig 3). Simple binary and ternary reconstituted systems containing these P450s were examined for 7-PR and 7-ER dealkylation and aniline hydroxylation. Aniline and 7-ER are CYP2E1 selective substrates, being metabolized more rapidly by CYP2E1 than CYP2B4, whereas 7PR is a CYP2B4 selective substrate. In each case, additive reaction rates were observed in the mixed reconstituted systems when compared to the sum of the binary reaction rates (Fig 3), unlike the responses seen with the CYP1A2/CYP2E1 system.
Figure 3. CYP2E1 and CYP2B4 mediated 7-pentoxyresorufin dealkylation (PROD) and aniline hydroxylation in simple and mixed reconstituted systems.
PROD and aniline hydroxylation was measured in simple reconstituted systems containing reductase and a single P450 (either CYP2E1 or CYP2B4), and mixed reconstituted systems containing reductase and both CYP2E1 and CYP2B4 in order to detect potential interactions between these P450 enzymes. Reconstitution and assay conditions are described in Methods and in the legend to Figure 1. Groups represent the mean ± SEM for three determinations. For both substrates, no significant difference between the sum of the activities of the binary systems (first two bars) and that of the mixed system (third bar).
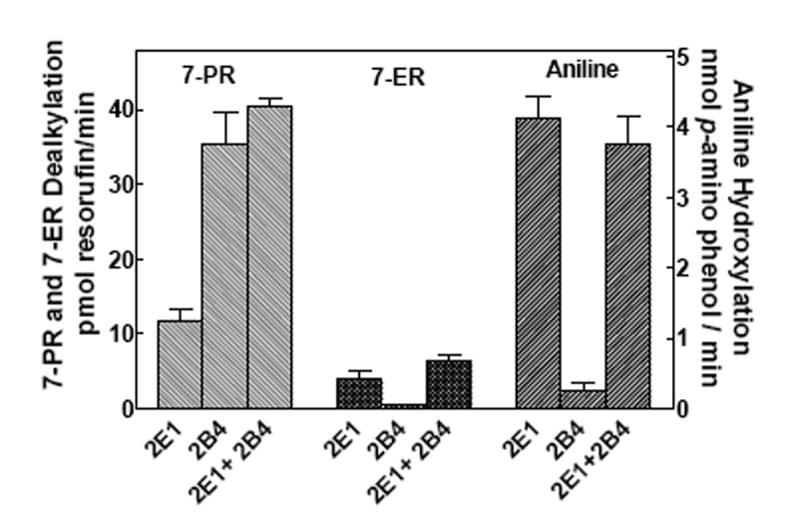
To test whether ionic strength had an effect on PROD in the mixed system containing both CYP2E1 and CYP2B4, activities were measured at varying concentrations of HEPES/acetate and HEPES buffer (Fig 4). In the binary systems, ionic strength caused a decrease in CYP2B4-mediated 7-PR activity as the concentration increased above 50-100 mM, whereas CYP2E1 was relatively unresponsive to changes in ionic strength (Fig 4). Interestingly, the reaction rates for the mixed reconstituted systems were the sum of the rates of the binary systems at each ionic strength measured. The only departure from additivity occurred at 200 mM HEPES, where the rates for the mixed system containing both CYP2B4 and CYP2E1 appeared to exhibit a significant synergistic response. Overall, ionic strength appeared to have little effect on additive responses between CYP2B4 and CYP2E1. These results suggest that complex formation between CYP2B4 and CYP2E1 is not a major mechanism that governs the activities of this enzyme pair. These and previous results show that combinations of P450s can produce drastically different outcomes (inhibition, synergism or additivity) depending on the P450 enzymes, and the substrates used (21-24).
Figure 4. Effect of ionic strength on the interactions among reductase, CYP2E1, and CYP2B4.
CYP2E1, CYP2B4 and reductase were reconstituted in binary (reductase and a single P450) and ternary (reductase and mixed P450s) systems. Significant differences in activities between the sum of the two binary systems compared to the mixed reconstituted system are indicated (*, p < 0.05). Calculated ionic strength values for each buffer system are indicated as the top x-axis. PROD activities were measured at varying concentrations of (a) HEPES/acetate and (b) HEPES buffer. Reaction conditions are the same as described in Fig 2. Bars represent the mean ± SEM for three determinations.
According to previous kinetic analyses, the mechanism for complex formation between CYP1A2 and CYP2B4 affect the association of reductase with the CYP1A2 moiety of the P450-P450 complex, leading to the inhibition of PROD (21). The same analysis was used to evaluate the effects of reductase concentration on binary and ternary systems containing (1) reductase, CYP2E1 and CYP2B4, and (2) reductase, CYP1A2 and CYP2E1, at both low and high ionic strength. Fig 5 shows the effects of varying reductase concentration on EROD by CYP2E1 and CYP2B4 when reconstituted with reductase alone and in the mixed system containing reductase and both P450 enzymes. At subsaturating reductase, EROD activity in the mixed reconstituted system exhibited little or no inhibition, which became additive at saturating reductase (Fig 5a). These results are consistent with both P450s competing for reductase, but without a functional interaction between the P450s. Simulations of this type of behavior have been reported previously and are consistent with a simple competition between CYP2B4 and CYP2E1 for the reductase (21, 24). Although overall reaction rates were moderated by increasing ionic strength, there were no differences in the shapes of the curves for either of the systems when comparing low (50 mM HEPES) and high (300 mM HEPES) buffer concentration (Fig 5).
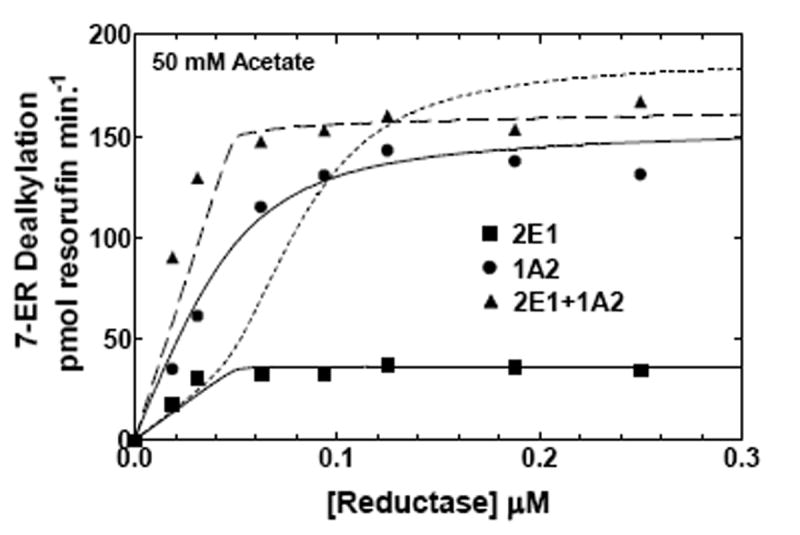
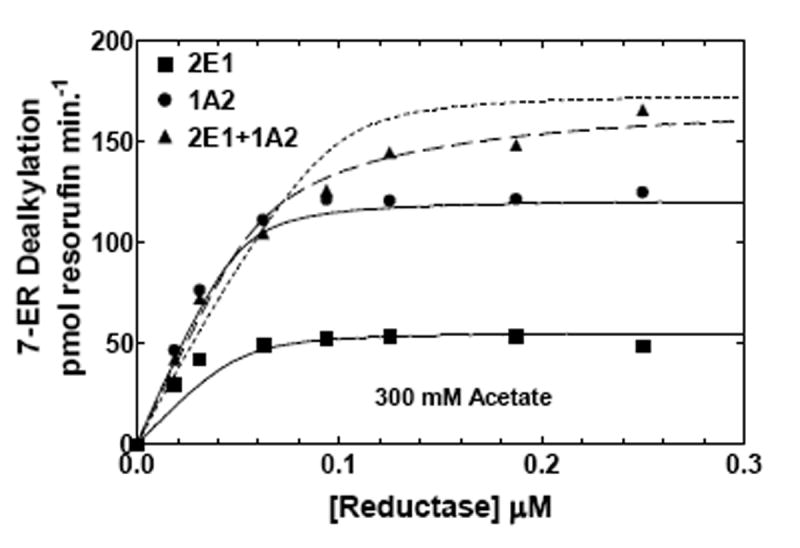
Figure 5. Effect of ionic strength on CYP2E1- and CYP2B4-mediated EROD as a function of reductase concentration.
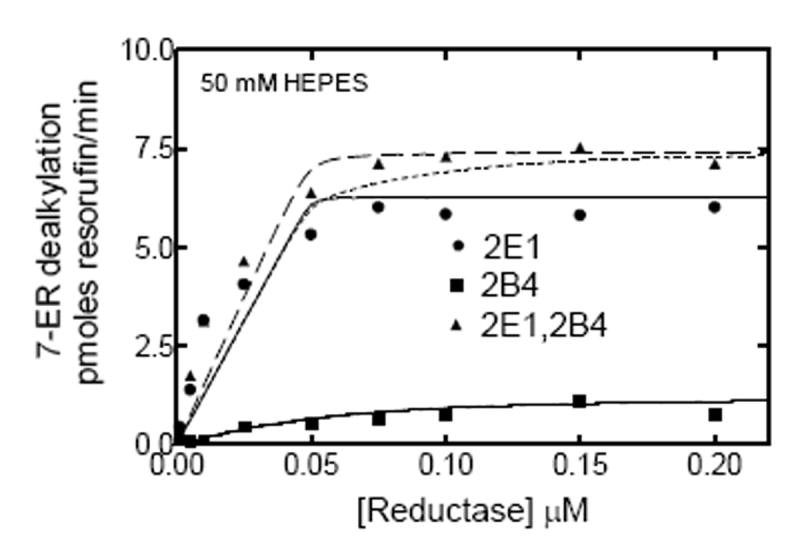
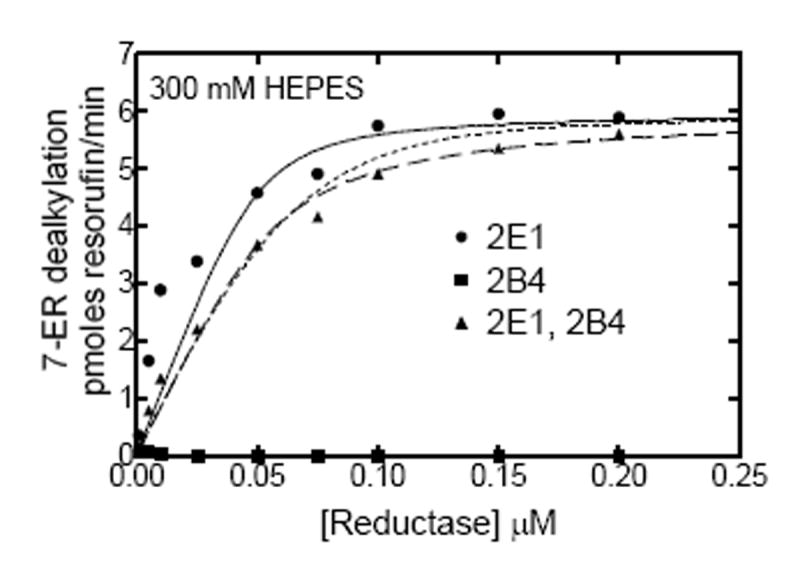
EROD was determined as a function of reductase concentration in both simple and mixed reconstituted systems. The binary reconstituted systems contained 0.05 μM CYP2B4, or 0.05 μM CYP2E1, whereas the mixed reconstituted system contained 0.05 μM of both CYP2B4 and CYP2E1. The DLPC concentration was 8 μM and the reductase was varied from 0-0.2 μM. The experimental data represent (■) reductase and CYP2B4, (●) reductase and CYP2E1, and (▲) reductase, CYP2B4 and CYP2E1. The curves for the binary systems were fit to the experimental data using a model where CYP2B4 and CYP2E1 compete for the available reductase (solid lines). The experimental data for the mixed reconstituted systems were fit to (1) a mathematical model only allowing the formation of reductase-CYP2E1 and reductase-CYP2B4 complexes (- - - - -), and (2) a model that permits the formation of CYP2E1-CYP2B4 complexes ((— — —). (A) Effect of mixed reconstitution of CYP2B4 and CYP2E1 on the reductase dependence of EROD at 50 mM HEPES. (B) Effect of mixed reconstitution of CYP2B4 and CYP2E1 on the reductase dependence of PROD (300 mM HEPES). The experimental data for this enzyme pair could be effectively fit using a simple model allowing the formation of binary complexes at both low and high ionic strength.
The data from the mixed reconstituted systems were analyzed using two models. In the first model, the different P450 enzymes cannot form heteromeric complexes, and are treated as monomers that can compete for the available reductase (Scheme 1). Simulation of the expected data is shown as the dotted line in Fig 5a. According to the second model (Scheme 2), CYP2E1 and CYP2B4 could form heteromeric complexes. This is shown as a dashed line in Fig 5a, and represents only a marginal improvement in the fit when compared to the simple competition model (Table 1).These data show that 7-ER dealkylation with the reductase/CYP2E1/CYP2B4 system can be reasonably fit to a simple model where the different P450 enzymes simply compete for reductase. Qualitatively similar results were obtained with simulations of the experimental data at 300 mM HEPES. The data were readily fit to the simple model described in Scheme 1. Invoking the more complex model (Scheme 2) did not significantly improve the reliability of the fits.
Scheme 1.
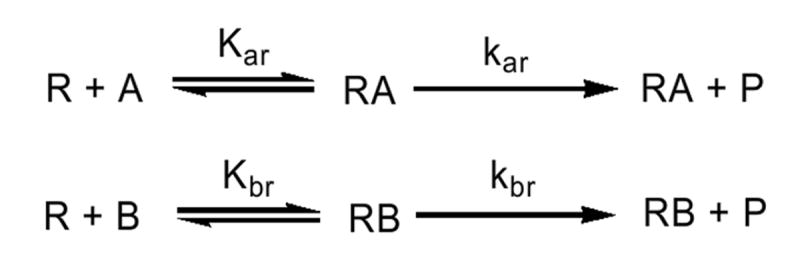
Model describing the interactions among reductase (R), and two different P450 enzymes (A and B) when only binary reductase-P450 complexes are formed.
Scheme 2.
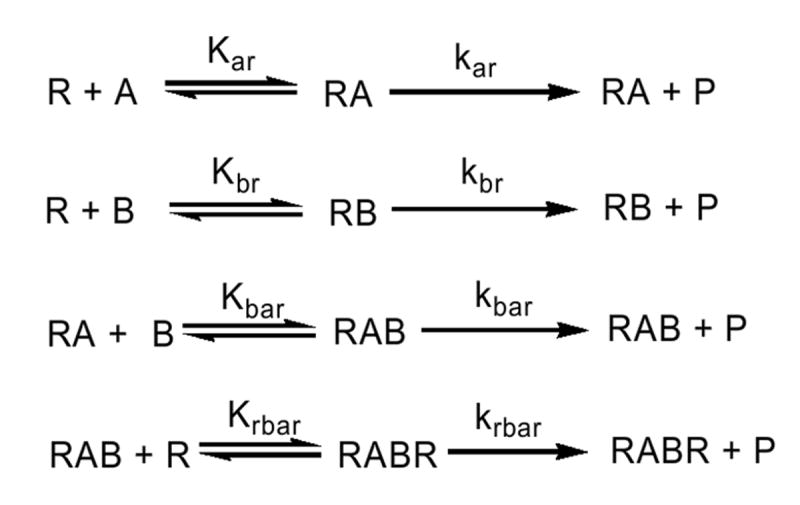
Simplified model describing the interactions among two different P450 enzymes (A and B) and reductase (R) in mixed reconstituted systems where heteromeric complexes are possible.
Table 1. Kinetic constants of the simulated curves for reductase-CYP2B4-CYP2E1 reconstituted systems.
The experimental data for the reductase titrations of the mixed reconstituted systems (Fig 5) were simulated using (a) a model allowing only the formation of binary complexes, and (b) a model allowing the formation of CYP2E1-CYP2B4 complexes (see Supporting Information). The equilibrium and rate constants below are based on the model described in Scheme 1, which has been detailed in a previous report (21). Data fitting for the simpler model where both CYP2E1 and CYP2B4 compete for reductase (without P450-P450) complex formation utilize only the first 4 constants (Kar, Kbr, kar, and kbr). ‘A’ and ‘B’ represent CYP2E1 and CYP2B4, respectively
| 50 mM HEPES | 300 mM HEPES | |
|---|---|---|
| Kar | 0.000026 | 0.0036 |
| Kar | 17 | 15.9 |
| Kbr | 0.016 | 0.0129 |
| Kbr | 2.7 | 0.00002 |
| Kbar | 0.047 | 0.0224 |
| Kbar | 24 | 10.9 |
| Krbar** | 0.005 | 0.005 |
| Krbar* | 19.5 | 16 |
In these simulations, the rate constant for the RBAR complex was set as the sum of the AR and BR complexes. This was done to constrain the simulations under the assumption that the quaternary complex would have a rate constant similar to the sum of the binary complexes.
Under the conditions of this experiment, the value for Krbar could not be determined. Although the data were fit using these parameters, this value was not unique, and could have a range over 4 orders of magnitude without significantly affecting the values of the other rate constants.
To further examine the effect of ionic strength on CYP1A2 and CYP2E1 in binary and ternary reconstituted systems, EROD was measured as a function of reductase concentration at low and high ionic strength (Fig 6). At low ionic strength (50 mM HEPES/50 mM potassium acetate), dealkylation of 7-ER was predominately a CYP1A2 substrate, showing a higher metabolic rate, when compared to the reductase-CYP2E1 binary system. Although, the activity appeared to be hyperbolic for CYP1A2, CYP2E1 exhibited some deviation from strict hyperbolic behavior at low reductase concentrations. The mixed reconstituted system exhibited a pronounced synergism (~40%) at subsaturating reductase concentrations. As the reductase concentration was increased, the overall rate approximated additivity. This type of behavior was similar to that observed with the CYP1A2-CYP2B4 reconstituted system in the metabolism of 7-ER (21), and is consistent with the formation of a heteromeric complex that allows for selective reductase binding to the CYP1A2 moiety of the complex. The experimental data was simulated using a model that permits the formation of heteromeric P450 complexes (Fig 6A dashed line – described by Scheme 2), but could not be fit to a simpler model where CYP1A2 and CYP2E1 monomers compete for the reductase (dotted line – described by Scheme 1). These results are similar to those reported for the CYP1A2/CYP2B4 containing reconstituted systems (21, 24). Interestingly, when examined in HEPES containing 300 mM potassium acetate, the degree of synergism at subsaturating reductase (0.05 μM) was attenuated in the mixed reconstituted system (Fig 6b). The significant stimulation of the response in the mixed reconstituted system shown at low ionic strength (Fig 6a), was no longer observed (Fig 6b), results consistent with the simple competition of CYP2E1 and CYP1A2 for reductase. The kinetic constants used for these simulations are shown in Table 2. The data in Fig 6B and Table 2 both show that the increase in ionic strength causes an increase in the Km for the reductase-CYP2E1 interaction. These results clearly demonstrate that ionic strength can attenuate the synergism of EROD in the mixed reconstituted system, and are consistent with the ability of ionic strength to disrupt complex formation between CYP1A2 and CYP2E1.
Figure 6. Effects of ionic strength on CYP2E1- and CYP1A2-mediated EROD as a function of reductase concentration.
EROD was measured in both simple and mixed reconstituted systems containing CYP2E1 and CYP1A2 using analogous procedures as described in Fig 5 and in Methods. The data sets are: (●) reductase and CYP1A2, (■) reductase and CYP2E1, and (▲) reductase, CYP1A2 and CYP2E1. The curves for the binary systems were fit to the experimental data using a simple Michaelis Menten interaction between reductase and P450 (solid lines). The curves for the mixed systems are fits of the experimental data representing (1) a mathematical model only allowing the formation of reductase-CYP2E1 and reductase-CYPA2 complexes (dotted line), and (2) a model that permits the formation of CYP2E1-CYP1A2 complexes (dashed line). (A) Effect of binary and mixed reconstitution of CYP2E1 and CYP1A2 on the reductase dependence of EROD at 50 mM HEPES containing 50 mM potassium acetate. (B) Effect of binary and ternary reconstitution of CYP2E1 and CYP1A2 on the reductase dependence of EROD at higher ionic strength (50 mM HEPES containing 300 mM potassium acetate). At higher ionic strength, the experimental data takes on characteristics much more similar to the simple model allowing the formation of only reductase-CYP1A2 and reductase-CYP2E1 complexes (- - - - -). Although the data can still be better fit to the more complex model allowing the formation of heteromeric P450 complexes (— — —), invoking the more complex model only produces a modest improvement in the reliability of the fit.
Table 2. Kinetic constants of the simulated curves for reductase-CYP1A2-CYP2E1 reconstituted systems.
The experimental data for the reductase titrations of the mixed reconstituted systems (Fig 6) were simulated using (a) a model allowing only the formation of binary complexes, and (b) a model allowing the formation of CYP1A2-CYP2E1 complexes (see Supporting Information). The equilibrium and rate constants are based on the model described in Scheme 1, which has been detailed in a previous report (21). Data fitting for the simpler model where both CYP1A2 and CYP2E1 compete for reductase (without P450-P450) complex formation utilize only the first 4 constants (Kar, Kbr, kar, and kbr). ‘A’ and ‘B’ represent CYP1A2 and CYP2E1, respectively
| 50 mM HEPES/
50 mM potassium acetate |
50 mM HEPES/
300 mM potassium acetate |
|
|---|---|---|
| Kar | 0.011 | 0.0030 |
| Kar | 414 | 325 |
| Kbr | 0.00013 | 0.012 |
| Kbr | 97 | 150 |
| Kbar | 0.000011 | 0.00033 |
| Kbar | 414 | 284 |
| Krbar** | 0.005 | 0.005 |
| krbar* | 511 | 465 |
In these simulations, the rate constant for the RBAR complex was set as the sum of the AR and BR complexes. This was done to constrain the simulations under the assumption that the quaternary complex would have a rate constant similar to the sum of the binary complexes.
Under the conditions of this experiment, the value for Krbar could not be determined. Although the data were fit using these parameters, this value was not unique, and could have a range over 4 orders of magnitude without significantly affecting the values of the other rate constants.
DISCUSSION
This report demonstrates another functional interaction between two different P450 proteins. Alkoxyresorufin activities were synergistically stimulated at subsaturating reductase when CYP1A2 and CYP2E1 were present together in mixed reconstituted systems. The synergism between these P450s was sensitive to increasing ionic strength. These results are consistent with previous studies (24), where the combination of CYP2B4 and CYP1A2 was shown to significantly inhibit PROD activity at low buffer concentrations, an effect that was relieved at high ionic strength (Fig 2). No significant synergism was observed when examining the CYP2B4/CYP2E1 mixed reconstituted system, which is consistent with a simple competition between both P450 enzymes for limiting reductase. Unlike the CYP1A2/CYP2E1 system, the activity as a function of reductase concentration in the CYP2B4/CYP2E1 system was unresponsive to changes in ionic strength (Fig 4). The observation of interactions in mixed reconstituted systems containing CYP1A2 (i.e. CYP1A2/CYP2B4 and CYP1A2/CYP2E1) taken together with the lack of detectable interactions with the CYP2B4/CYP2E1 system strongly suggests that some feature of CYP1A2 may facilitate the formation of functional interactions with other P450 enzymes.
CYP1A proteins have previously been shown to interact with CYP3A subfamily P450s (13, 21, 24, 40). Alston et al. (40) provided evidence for a physical interaction between CYP3A2 and CYP1A1 by treating liver microsomes with a bifunctional crosslinking agent to covalently link closely associated proteins. Microsomal CYP1A1 was immunopurified using a monoclonal antibody to CYP3A2. Any proteins that were crosslinked to CYP1A1 were then detected by immune blotting with an antibody specific for CYP1A1. Their results showed the formation of specific crosslinks with CYP3A2. The authors suggested that complex formation between multiple P450s may exist to enhance the transfer of drugs and their metabolites (40).
Evidence for interactions among these proteins that can affect metabolism has also been presented (21, 41). Yamazaki et al. (41) reported enhanced CYP3A4-mediated testosterone 6β-hydroxylation in the presence of CYP1A1 and CYP1A2 at saturating reductase. These results are consistent with complex formation between these P450s that affects the rate of catalysis, possibly through a conformational change mediated by the P450-P450 complex. Backes et al. (21, 24) provided support for the formation of functional complexes at subsaturating reductase on both 7-PR and 7-ER metabolism. These studies showed that the interaction between CYP2B4 and CYP1A2 largely affects the affinity of the CYP2B4-CYP1A2 complex, although a smaller effect on kcat is also observed. The results of the present manuscript demonstrate that CYP1A2 also forms functional complexes with CYP2E1, and that these interactions appear to be sensitive to alterations in ionic strength.
A particularly attractive feature of these results is the quantitative evidence supporting the conversion of the mechanism of interaction of reductase, CYP2E1 and CYP1A2 from one where heteromeric P450 complexes are present (low ionic strength) to one where monomeric CYP2E1 and CYP1A2 simply compete for the reductase (high ionic strength). In contrast, evidence for such interaction was not found with the CYP2B4/CYP2E1 reconstituted systems. With this enzyme pair, the data at both low and high ionic strength were consistent with a simple competition model that does not require the formation of heteromeric P450-P450 complexes.
Yun et al. (14) showed that the conformational structure of CYP1A2 was sensitive to ionic strength. The authors used spectroscopic analysis to show that increases in activity at higher salt concentrations were accompanied by increases in α-helical content and decreases in β-sheet, along with a greater percentage of high spin CYP1A2. The presence of DLPC also increased the fluorescence intensity of CYP1A2, for which the authors suggest a correlation between changes in secondary structure and improved CYP1A2 enzymatic activity in reconstituted systems (14). In the present study, CYP2E1 may act as a positive modifier of CYP1A2 activity by forming ternary heteromeric CYP2E1-CYP1A2 complexes with reductase, resulting in changes in the quaternary structure of the constituent proteins in a manner that improves coupling between reductase and P450 – and therefore catalysis. This interpretation is consistent with the mathematical model (see curves in Fig 6) showing an increased affinity of reductase for the CYP1A2-CYP2E1 complex. Similar suggestions have been made regarding the effector role of cytochrome b5 in selective P450 reactions (5, 39).
A logical extension to the existence of heteromeric P450 complexes is the potential for the formation of homomeric complexes. It is well known that solubilized P450s aggregate in solution; however, their oligomeric state is less clear in the presence of lipid. CYP2E1 was shown to exist as a 10-mer in solution that could not be dissociated by high concentrations of detergent (42). Szczesna-Skorupa et al. (43) showed that CYP2E1 does not self-associate as measured by fluorescence resonance energy transfer (FRET) in cell culture, although CYP2E1 was shown to complex with reductase. In contrast, homomeric complex formation was reported for CYP2C2 using this technique (43). Again, complex formation between CYP2C2 and reductase was observed. It is interesting to note that CYP2E1 appears to deviate from a simple hyperbolic function (Figs 5 and 6). Despite the apparent lack of an interaction based on FRET analysis, these deviations suggest that even the simplest reconstituted systems may, in fact, involve more complex interactions between these proteins. These results suggest that the ability to form complexes between different P450 proteins is not only dependent on the P450 enzyme (or enzymes) present, but also that these interactions can be affected by the presence of substrate.
CYP1A2 has also been shown to aggregate in solution, and that these aggregates can be disrupted by addition of detergent. Activity is lost at detergent concentrations required to make CYP1A2 monomeric, even when using an alternate electron source, such as cumene hydroperoxide (44, 45) which does not require an electrostatic complex with reductase to support monooxygenase function. Sevrukova et al. (46) showed similar results, in which solubilized CYP1A2 existed in populations of tetramers and 40-mers. Conditions that disaggregated CYP1A2 led to decreases in activity. In another study, various detergents had little effect on the aggregation state of CYP1A2 with a cleaved hydrophobic N-terminus, a region thought to contribute to strong P450 self-association (47). Interestingly, when the rate of CYP1A2-dependent PROD was measured as a function of reductase concentration, a classical hyperbolic response was not obtained (21, 24). The non-Michealis-Menten results could be the result of homomeric CYP1A2-CYP1A2 complex formation. This possibility is currently under investigation. Hetero-oligomers of P450 and reductase have also been shown to form, even in the presence of various lipids (48). Although the level of homomeric and heteromeric association among P450 and reductase in their native membrane environment is unclear, complex formation between CYP1A2 and another P450 enzyme (even another CYP1A2) may be necessary for optimal reductase supported activity.
Rotational diffusion experiments in reconstituted systems and in microsomes support the existence of P450s in clusters of varying size (19). The larger immobile clusters were sensitive to protein concentration, lipid/protein ratio, lipid composition and temperature (19, 20). Interestingly, the presence of reductase and cytochrome b5 was shown to mobilize P450 aggregates, improving the ability of CYP1A2 to interact with reductase. CYP1A2 has distinct physicochemical properties characterized as being hydrophobic, with low solubility, and a tendency to form large aggregates (46, 49-51). Wagner et al. (45) showed that aggregation has no appreciable effect on CYP1A2 activity. Yun et al. (14) reported decreases in aggregation at lower CYP1A2 concentration, and also at higher ionic strength. In the present study, high ionic strength attenuated the synergism between CYP1A2 and CYP2E1. Comparison of the reductase dependence showed a conversion of the mechanism of interaction from one where CYP1A2 and CYP2E1 formed P450-P450 complexes (low ionic strength) to one where the proteins behaved as monomeric proteins that could compete for the reductase (high ionic strength). Electrostatic interactions between CYP2E1, CYP1A2 and reductase may act to alter the quaternary structure of this ternary complex in a manner that improves CYP1A2 solubility, so that smaller clusters are able to more efficiently couple with electron providers, which are attenuated at high ionic strength.
The reductase titrations shown in both Figs 5 and 6 are consistent with high affinity binding between CYP2E1 and reductase, even in simple reconstituted systems, but appear to deviate from the hyperbolic response expected with classical Michaelis Menten kinetics. This can be seen by the deviations when comparing the fitted and experimental data, particularly at low reductase. The apparent non-Michaelis Menten behavior with the simple binary systems has also been found with CYP1A2 (21, 24), and suggests the potential for more complex interactions among these proteins. Characterization of the response of these enzymes as a function of reductase concentration will require additional study.
Supplementary Material
Acknowledgments
We would like to thank Mr. George Cawley for his technical assistance.
The abbreviations used are
- CYP; P450
cytochrome P450
- PROD
7-pentoxyresorufin-O-dealkylation
- 7-PR
7-pentoxyresorufin
- EROD
7-ethoxyresorufin-O-dealkylation
- 7-ER
7-ethoxyresorufin
- 7-EFC
7-ethoxy-4-trifluromethylcoumarin
- 7-HFC
7-hydroxy-4-trifluoromethylcoumarin
- NDMA
Nitrosodimethylamine
- BSA
bovine serum albumin
- ER
endoplasmic reticulum
- NADPH
reduced nicotinamide adenine dinucleotide phosphate
- reductase
reduced NADPH – cytochrome P450 reductase
- DLPC
L-α-dilauroyl-sn-glycero-3-phosphocholine
Footnotes
SUPPORTING INFORMATION AVAILABLE The supporting information includes the script files for the simulation and curve fitting routines to be used with the Dynafit program http://www.biokin.com/dynafit/. These script files simulate two different conditions. The “simple competition” mathematical model assumes that CYP2E1 and CYP1A2 (or CYP2B4 and CYP2E1) exist as functional monomers that compete for NADPH-cytochrome P450 reductase, whereas the “complete interaction” model assumes that CYP2E1 and CYP1A2 (or CYP2B4 and CYP2E1) can form heteromeric complexes with their own characteristics with regard to reductase association and catalytic function. This information is available free of charge via the internet at http://pubs.acs.org.
These studies were supported by a US Public Health Service Research Grant from the National Institute of Enviromental Health Sciences ES004344 (WLB), and a predoctoral fellowship from the Stanley Scott Cancer Center (RWK).
References
- 1.Estabrook RW, Franklin MR, Cohen B, Shigamatzu A, Hildebrandt AG. Biochemical and genetic factors influencing drug metabolism. Influence of hepatic microsomal mixed function oxidation reactions on cellular metabolic control. Metabolism. 1971;20:187–199. doi: 10.1016/0026-0495(71)90091-6. [DOI] [PubMed] [Google Scholar]
- 2.Backes WL, Sequeira DJ, Cawley GF, Eyer CS. Relationship between hydrocarbon structure and induction of P450: effects on protein levels and enzyme activities. Xenobiotica. 1993;23:1353–1366. doi: 10.3109/00498259309059445. [DOI] [PubMed] [Google Scholar]
- 3.Miwa GT, West SB, Huang MT, Lu AYH. Studies on the association of cytochrome P-450 and NADPH- cytochrome c reductase during catalysis in a reconstituted hydroxylating system. J Biol Chem. 1979;254:5695–5700. [PubMed] [Google Scholar]
- 4.Miwa GT, Lu AYH. The association of cytochrome P-450 and NADPH-cytochrome P-450 reductase in phospholipid membranes. Arch Biochem Biophys. 1984;234:161–166. doi: 10.1016/0003-9861(84)90337-0. [DOI] [PubMed] [Google Scholar]
- 5.Schenkman JB, Jansson I. The many roles of cytochrome b5. Pharmacol Ther. 2003;97:139–152. doi: 10.1016/s0163-7258(02)00327-3. [DOI] [PubMed] [Google Scholar]
- 6.Bernhardt R, Makower A, Janig GR, Ruckpaul K. Selective chemical modification of a functionally linked lysine in cytochrome P-450 LM2. Biochim Biophys Acta. 1984;785:186–190. doi: 10.1016/0167-4838(84)90143-2. [DOI] [PubMed] [Google Scholar]
- 7.Nadler SG, Strobel HW. Role of electrostatic interactions in the reaction of NADPH- cytochrome P-450 reductase with cytochromes P-450. Arch Biochem Biophys. 1988;261:418–429. doi: 10.1016/0003-9861(88)90358-x. [DOI] [PubMed] [Google Scholar]
- 8.Tamura M, Yoshida S, Tamura T, Saitoh T, Takeshita M. Effect of divalent cations on NADH-dependent and NADPH-dependent cytochrome b5 reduction by hepatic microsomes. Arch Biochem Biophys. 1990;280:313–319. doi: 10.1016/0003-9861(90)90335-v. [DOI] [PubMed] [Google Scholar]
- 9.Shimizu T, Tateishi T, Hatano M, Fujii-Kuriyama Y. Probing the role of lysines and arginines in the catalytic function of cytochrome P450d by site-directed mutagenesis. Interaction with NADPH-cytochrome P450 reductase. J Biol Chem. 1991;266:3372–3375. [PubMed] [Google Scholar]
- 10.Nisimoto Y, Edmondson DE. Effect of KCl on the interactions between NADPH:cytochrome P-450 reductase and either cytochrome c, cytochrome b5 or cytochrome P-450 in octyl glucoside micelles. Eur J Biochem. 1992;204:1075–1082. doi: 10.1111/j.1432-1033.1992.tb16731.x. [DOI] [PubMed] [Google Scholar]
- 11.Voznesensky AI, Schenkman JB. The cytochrome P450 2B4-NADPH cytochrome P450 reductase electron transfer complex is not formed by charge-pairing. J Biol Chem. 1992;267:14669–14676. [PubMed] [Google Scholar]
- 12.Voznesensky AI, Schenkman JB. Quantitative analyses of electrostatic interactions between NADPH-cytochrome P450 reductase and cytochrome P450 enzymes. J Biol Chem. 1994;269:15724–15731. [PubMed] [Google Scholar]
- 13.Yamazaki H, Ueng YF, Shimada T, Guengerich FP. Roles of divalent metal ions in oxidations catalyzed by recombinant cytochrome P450 3A4 and replacement of NADPH-- cytochrome P450 reductase with other flavoproteins, ferredoxin, and oxygen surrogates. Biochem. 1995;34:8380–8389. doi: 10.1021/bi00026a020. [DOI] [PubMed] [Google Scholar]
- 14.Yun CH, Song M, Ahn T, Kim H. Conformational change of cytochrome p450 1A2 induced by sodium chloride. J Biol Chem. 1996;271:31312–31316. doi: 10.1074/jbc.271.49.31312. [DOI] [PubMed] [Google Scholar]
- 15.Bridges A, Gruenke L, Chang YT, Vakser IA, Loew G, Waskell L. Identification of the binding site on cytochrome P450 2B4 for cytochrome b5 and cytochrome P450 reductase. J Biol Chem. 1998;273:17036–17049. doi: 10.1074/jbc.273.27.17036. [DOI] [PubMed] [Google Scholar]
- 16.Yun CH, Ahn T, Guengerich FP. Conformational change and activation of cytochrome P450 2B1 induced by salt and phospholipid. Arch Biochem Biophys. 1998;356:229–238. doi: 10.1006/abbi.1998.0759. [DOI] [PubMed] [Google Scholar]
- 17.Davydov DR, Kariakin AA, Petushkova NA, Peterson JA. Association of cytochromes P450 with their reductases: opposite sign of the electrostatic interactions in P450BM-3 as compared with the microsomal 2B4 system. Biochem. 2000;39:6489–6497. doi: 10.1021/bi992936u. [DOI] [PubMed] [Google Scholar]
- 18.Peterson JA, Ebel RE, O’Keeffe DH, Matsubara T, Estabrook RW. Temperature dependence of cytochrome P-450 reduction. A model for NADPH-cytochrome P-450 reductase:cytochrome P-450 interaction. J Biol Chem. 1976;251:4010–4016. [PubMed] [Google Scholar]
- 19.Kawato S, Gut J, Cherry RJ, Winterhalter KH, Richter C. Rotation of cytochrome P-450. I. Investigations of protein-protein interactions of cytochrome P-450 in phospholipid vesicles and liver microsomes. J Biol Chem. 1982;257:7023–7029. [PubMed] [Google Scholar]
- 20.Gut J, Richter C, Cherry RJ, Winterhalter KH, Kawato S. Rotation of cytochrome P-450. II. Specific interactions of cytochrome P-450 with NADPH-cytochrome P-450 reductase in phospholipid vesicles. J Biol Chem. 1982;257:7030–7036. [PubMed] [Google Scholar]
- 21.Backes WL, Batie CJ, Cawley GF. Interactions among P450 enzymes when combined in reconstituted systems: formation of a 2B4-1A2 complex with a high affinity for NADPH-cytochrome P450 reductase. Biochem. 1998;37:12852–12859. doi: 10.1021/bi980674a. [DOI] [PubMed] [Google Scholar]
- 22.Cawley GF, Batie CJ, Backes WL. Substrate-dependent competition of different P450 isozymes for limiting NADPH-cytochrome P450 reductase. Biochem. 1995;34:1244–1247. doi: 10.1021/bi00004a018. [DOI] [PubMed] [Google Scholar]
- 23.Cawley GF, Zhang S, Kelley RW, Backes WL. Evidence supporting the interaction of CYP2B4 and CYP1A2 in microsomal preparations. Drug Metab Dispos. 2001;29:1529–1534. [PubMed] [Google Scholar]
- 24.Kelley RW, Reed JR, Backes WL. Effects of ionic strength on the functional interactions between CYP2B4 and CYP1A2. Biochem. 2005;44:2632–2641. doi: 10.1021/bi0477900. [DOI] [PMC free article] [PubMed] [Google Scholar]
- 25.Yasukochi Y, Masters BS. Some properties of a detergent-solubilized NADPH-cytochrome c(cytochrome P-450) reductase purified by biospecific affinity chromatography. J Biol Chem. 1976;251:5337–5344. [PubMed] [Google Scholar]
- 26.Shen AL, Porter TD, Wilson TE, Kasper CB. Structural analysis of the FMN binding domain of NADPH-cytochrome P-450 oxidoreductase by site-directed mutagenesis. J Biol Chem. 1989;264:7584–7589. [PubMed] [Google Scholar]
- 27.Saribas AS, Gruenke L, Waskell L. Overexpression and Purification of the Membrane-Bound Cytochrome P450 2B4. Protein Expression and Purification. 2001;21:303–309. doi: 10.1006/prep.2000.1377. [DOI] [PubMed] [Google Scholar]
- 28.Coon MJ, Van Der Hoeven TA, Dahl SB, Haugen DA. Methods in Enzymology. Academic Press; 1984. Two Forms of Liver Microsomal Cytochrome P-450, P-450LM2 and P-450LM4 (Rabbit Liver) pp. 109–123. [DOI] [PubMed] [Google Scholar]
- 29.Cheng D, Kelley RW, Cawley GF, Backes WL. High-level expression of recombinant rabbit cytochrome P450 2E1 in Escherichia coli C41 and its purification*1. Protein Expression and Purification. 2004;33:66–71. doi: 10.1016/j.pep.2003.08.009. [DOI] [PubMed] [Google Scholar]
- 30.Omura T, Sato R. The carbon monoxide-binding pigment of liver microsomes: II. Solubilization, purification, and properties. J Biol Chem. 1964;239:2379–2385. [PubMed] [Google Scholar]
- 31.Lowry OH, Rosebrough NJ, Farr AL, Randall RJ. Protein Measurement with the Folin Phenol Reagent. J Biol Chem. 1951;193:265–275. [PubMed] [Google Scholar]
- 32.Vermilion JL, Coon MJ. Purified liver microsomal NADPH-cytochrome P-450 reductase. Spectral characterization of oxidation-reduction states. J Biol Chem. 1978;253:2694–2704. [PubMed] [Google Scholar]
- 33.Causey KM, Eyer CS, Backes WL. Dual role of phospholipid in the reconstitution of cytochrome P- 450 LM2-dependent activities. Mol Pharmacol. 1990;38:134–142. [PubMed] [Google Scholar]
- 34.Yang CS, Smith T, Ishizaki H, Hong JY. Enzyme mechanisms in the metabolism of nitrosamines. IARC Sci Publ. 1991:265–274. [PubMed] [Google Scholar]
- 35.Nash T. The colorimetric estimation of formaldehyde by means of the Hantzsch reaction. Biochem J. 1953;55:416–421. doi: 10.1042/bj0550416. [DOI] [PMC free article] [PubMed] [Google Scholar]
- 36.Kanaeva IP, Nikityuk OV, Davydov DR, Dedinskii IR, Koen YM, Kuznetsova GP, Skotselyas ED, Bachmanova GI, Archakov AI. Comparative study of monomeric reconstituted and membrane microsomal monooxygenase systems of the rabbit liver. II. Kinetic parameters of reductase and monooxygenase reactions. Arch Biochem Biophys. 1992;298:403–412. doi: 10.1016/0003-9861(92)90428-y. [DOI] [PubMed] [Google Scholar]
- 37.Kuzmic P. Program DYNAFIT for the analysis of enzyme kinetic data: application to HIV proteinase. Anal Biochem. 1996;237:260–273. doi: 10.1006/abio.1996.0238. [DOI] [PubMed] [Google Scholar]
- 38.Kuzmic P. A generalized numerical approach to rapid-equilibrium enzyme kinetics: application to 17beta-HSD. Mol Cell Endocrinol. 2006;248:172–181. doi: 10.1016/j.mce.2005.10.012. [DOI] [PubMed] [Google Scholar]
- 39.Tan YZ, Patten CJ, Smith P, Yang CS. Competitive interactions between cytochromes P450 2A6 and 2E1 for NADPH-cytochrome P450 oxidoreductase in the microsomal membranes produced by a baculovirus expression system. Arch Biochem Biophys. 1997;342:82–91. doi: 10.1006/abbi.1997.9995. [DOI] [PubMed] [Google Scholar]
- 40.Alston K, Robinson RC, Park SS, Gelboin HV, Friedman FK. Interactions among cytochromes P-450 in the endoplasmic reticulum. Detection of chemically cross-linked complexes with monoclonal antibodies. J Biol Chem. 1991;266:735–739. [PubMed] [Google Scholar]
- 41.Yamazaki H, Gillam EMJ, Dong MS, Johnson WW, Guengerich FP, Shimada T. Reconstitution of recombinant cytochrome P450 2C10(2C9) and comparison with cytochrome P450 3A4 and other forms: Effects of cytochrome P450-P450 and cytochrome P450-b5 interactions. Arch Biochem Biophys. 1997;342:329–337. doi: 10.1006/abbi.1997.0125. [DOI] [PubMed] [Google Scholar]
- 42.Pernecky SJ, Larson JR, Philpot RM, Coon MJ. Expression of truncated forms of liver microsomal P450 cytochromes 2B4 and 2E1 in Escherichia coli: influence of NH2-terminal region on localization in cytosol and membranes. Proc Natl Acad Sci U S A. 1993;90:2651–2655. doi: 10.1073/pnas.90.7.2651. [DOI] [PMC free article] [PubMed] [Google Scholar]
- 43.Szczesna-Skorupa E, Mallah B, Kemper B. Fluorescence Resonance Energy Transfer Analysis of Cytochromes P450 2C2 and 2E1 Molecular Interactions in Living Cells. J Biol Chem. 2003;278:31269–31276. doi: 10.1074/jbc.M301489200. [DOI] [PubMed] [Google Scholar]
- 44.Dean WL, Gray RD. Relationship between state of aggregation and catalytic activity for cytochrome P-450LM2 and NADPH-cytochrome P-450 reductase. J Biol Chem. 1982;257:14679–14685. [PubMed] [Google Scholar]
- 45.Wagner SL, Dean WL, Gray RD. Zwitterionic detergent mediated interaction of purified cytochrome P-450LM4 from 5,6-benzoflavone-treated rabbits with NADPH-cytochrome P-450 reductase. Biochem. 1987;26:2343–2348. doi: 10.1021/bi00382a040. [DOI] [PubMed] [Google Scholar]
- 46.Sevrukova IF, Kanaeva IP, Koen YM, Samenkova NF, Bachmanova GI, Archakov AI. Catalytic activity of cytochrome P4501A2 in reconstituted system with Emulgen 913. Arch Biochem Biophys. 1994;311:133–143. doi: 10.1006/abbi.1994.1218. [DOI] [PubMed] [Google Scholar]
- 47.Dong MS, Yamazaki H, Guo ZY, Guengerich FP. Recombinant human cytochrome P450 1A2 and an N-terminal- truncated form: Construction, purification, aggregation properties, and interactions with Flavodoxin,Ferredoxin, and NADPH-cytochrome P450 reductase. Arch Biochem Biophys. 1996;327:11–19. doi: 10.1006/abbi.1996.0086. [DOI] [PubMed] [Google Scholar]
- 48.French JS, Guengerich FP, Coon MJ. Interactions of cytochrome P-450, NADPH-cytochrome P-450 reductase, phospholipid, and substrate in the reconstituted liver microsomal enzyme system. J Biol Chem. 1980;255:4112–4119. [PubMed] [Google Scholar]
- 49.Dean WL, Gray RD. Hydrodynamic properties of monomeric cytochromes P-450LM2 and P-450LM4 in n-octylglucoside solution. Biochem Biophys Res Commun. 1982;107:265–271. doi: 10.1016/0006-291x(82)91699-0. [DOI] [PubMed] [Google Scholar]
- 50.Yamada M, Ohta Y, Bachmanova GI, Nishimoto Y, Archakov AI, Kawato S. Dynamic interactions of rabbit liver cytochromes P450IA2 and P450IIB4 with cytochrome b5 and NADPH-cytochrome P450 reductase in proteoliposomes. Biochem. 1995;34:10113–10119. doi: 10.1021/bi00032a003. [DOI] [PubMed] [Google Scholar]
- 51.Guengerich FP, Martin MV, Guo Z, Chun YJ. Purification of functional recombinant P450s from bacteria. Methods Enzymol. 1996;272:35–44. doi: 10.1016/s0076-6879(96)72006-2. [DOI] [PubMed] [Google Scholar]
Associated Data
This section collects any data citations, data availability statements, or supplementary materials included in this article.