Abstract
Proper regulation of cell cycle progression is pivotal for maintaining genome stability. In a search for DNA damage-inducible, CHK1-modulated genes, we have identified BTG3 (B-cell translocation gene 3) as a direct p53 target. The p53 transcription factor binds to a consensus sequence located in intron 2 of the gene both in vitro and in vivo, and depletion of p53 by small interfering RNA (siRNA) abolishes DNA damage-induced expression of the gene. Furthermore, ablation of BTG3 by siRNA in cancer cells results in accelerated exit from the DNA damage-induced G2/M block. In vitro, BTG3 binds to and inhibits E2F1 through an N-terminal domain including the conserved box A. Deletion of the interaction domain in BTG3 abrogates not only its growth suppression activity, but also its repression on E2F1-mediated transactivation. We also present evidence that by disrupting the DNA binding activity of E2F1, BTG3 participates in the regulation of E2F1 target gene expression. Therefore, our studies have revealed a previously unidentified pathway through which the activity of E2F1 may be guarded by activated p53.
Keywords: BTG, E2F1, p53
Introduction
Progression of the cell cycle is monitored closely by a network of proteins to ensure faithful replication of genetic codes and to maintain genome stability. The tumor suppressor protein p53 is one such that negatively regulates cell proliferation, and its gene is frequently mutated in cancers (Olivier et al, 2002). Upon stresses, such as replication blockage, hypoxia or DNA damage, p53 is stabilized and activated (Lavin and Gueven, 2006). As a transcription factor, p53 then binds to a consensus sequence 5′-PuPuPuCA/T A/TGPyPyPy-(0–13 bp)-PuPuPuCA/T A/TGPyPyPy-3′ in the promoter region or intron, leading to the induction of genes involved in cell cycle arrest, apoptosis, or genes encoding p53 modifiers that eventually form autoregulatory loops with p53 (Harris and Levine, 2005; Laptenko and Prives, 2006). Among the p53 targets, p21 and 14-3-3s are required for p53 to arrest cell cycle in the G1 and G2 phases, respectively, upon genotoxic stress. Moreover, bax, PUMA, AIP1 and many others participate in p53-dependent apoptosis under various assaults and cellular contexts (Oren, 2003).
Rigorous efforts have been made toward understanding how p53 is activated by stress. Evidence suggests post-translational modification may be involved. For example, the cell cycle checkpoint kinases ATM/ATR, CHK1 and CHK2 have been shown to phosphorylate p53 in the N- and C-terminal domains, leading to either stabilization or activation of the protein (Bode and Dong, 2004; Ou et al, 2005; Lavin and Gueven, 2006). Apart from p53, whether and how other transcription programs are regulated remains largely uncharacterized.
To understand further the DNA damage response circuits, we have undertaken an approach of combining small interfering RNA (siRNA) knockdown of CHK1 gene expression with microarray analysis. As a result, genes were isolated whose expression was either up- or downregulated by DNA damage in a CHK1-dependent manner. One of the genes we identified is BTG3/ANA/APRO4, a member of the antiproliferative BTG (B-cell translocation gene)/Tob (Transducer of ErbB2) gene family, which also includes BTG1, BTG2/TIS21/PC3, Tob, Tob2 and PC3b (Matsuda et al, 2001). These proteins are characterized by a BTG1/APRO homology domain in their N-terminal regions, within which reside two highly conserved motifs, box A and box B. The BTG1 gene was first identified at a translocation breakpoint in a case of B-cell leukemia (Rimokh et al, 1991; Rouault et al, 1992) and inhibits cell proliferation when overexpressed (Rouault et al, 1992; Rodier et al, 1999). The prototype of this family, BTG2, was first identified as an early response gene in PC12 cells after NGF treatment, and in NIH3T3 cells after growth factor stimulation (Altin et al, 1991; Bradbury et al, 1991; Fletcher et al, 1991), and later shown to be activated by p53 (Rouault et al, 1996). It controls G1/S entry by inhibiting the expression of Cyclin D and maintaining hypophosphorylated RB (Montagnoli et al, 1996; Guardavaccaro et al, 2000), and mediates p53-dependent senescence upon oncogenic stress (Boiko et al, 2006). The BTG3 gene was isolated in a low-stringency cDNA library screening using BTG1 and BTG2 as probes (Guehenneux et al, 1997). The protein also seemed to be antiproliferative, as its introduction into NIH3T3 cells reduced BrdU incorporation (Yoshida et al, 1998). More recently, BTG3 was found to associate with and inhibit Src tyrosine kinase through its C-terminal domain in PC12 cells (Rahmani, 2006).
In this report, we identify BTG3 as a novel p53 target. Our study provides evidence implicating the role of BTG3 in DNA damage response and clarifies the mechanism of its antiproliferative action through inhibition of E2F1. The transcription factor E2F1 controls the cell cycle by activating genes important for G1/S progression: these include the genes for Cyclin E, PCNA, DNA polymerase α, Cdc6, dihydrofolate reductase (DHFR) and others (Muller et al, 2001; Bracken et al, 2004). Additional knockout studies in mice also revealed its unexpected role in apoptosis and tumor suppression (Field et al, 1996; Yamasaki et al, 1996). In quiescent cells, E2F activity is repressed by binding of hypophosphorylated RB. Upon growth stimulation, RB is hyperphosphorylated by the Cdks and released from E2F1, resulting in the activation of E2F1 and expression of its targets (Dimova and Dyson, 2005). Here, we also present evidence that suggests BTG3 is a novel E2F1 inhibitor that regulates the expression of E2F1 targets through a mechanism distinct from that used by RB.
Results
BTG3 is a DNA damage-inducible gene
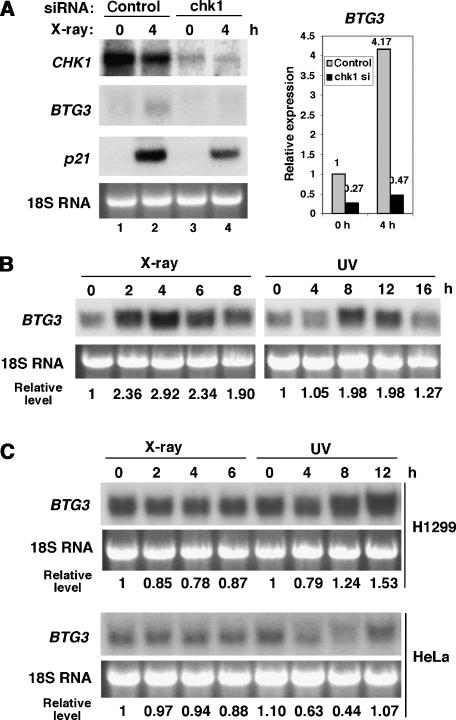
In an attempt to better understand the checkpoint-regulated gene expression, we conducted microarray analyses to compare gene expression profiles of cells with or without CHK1 knockdown before and after ionizing radiation (IR) using X-ray. LNCaP cells were first transfected with CHK1-targeting siRNA, then irradiated with X-ray 40 h after transfection. Using RNA prepared from these cells, we then conducted microarray analysis to identify differentially expressed genes. As a result, several genes were identified, whose expression was regulated by DNA damage in a CHK1-dependent manner. Expression of one such gene, BTG3, was upregulated in X-ray-irradiated LNCaP cells; this increase was abolished when CHK1 expression was downregulated by specific siRNA (Figure 1A). Induction of BTG3 was also observed after UV irradiation (Figure 1B). The levels of BTG3 mRNA were highest 4 h after IR and between 8–12 h after UV treatment in LNCaP cells (Figure 1B). Interestingly, such pattern of induction was not observed in p53-null H1299 cells, or in p53-compromised HeLa cells (Figure 1C). Thus, expression of BTG3 after DNA damage may be regulated by p53. Similar to BTG3, expression of p21, a known p53 target, was increased after IR and this increase was also diminished in CHK1-downregulated cells (Figure 1A). Thus, we have identified a DNA damage-inducible gene BTG3 whose optimal induction, like that of p21, requires the checkpoint kinase CHK1.
Figure 1.
Northern analysis of BTG3 RNA before and after DNA damage. (A) IR-induced BTG3 expression depends on CHK1. LNCaP cells were transfected with control or CHK1-targeting siRNA and incubated for about 40 h before irradiation with 8 Gy of X-ray. After 4 h of recovery, RNA was isolated and Northern analysis was conducted. Ethidium bromide-stained 18S ribosomal RNA is shown as a loading control. The bar graph on the right represents the result of quantification on levels of BTG3. (B) Time course of induction of the BTG3 transcript after IR (8 Gy) and UV (50 J/m2) treatments. Levels of BTG3 expression were quantified and shown below the panel. (C) BTG3 RNA is not induced by DNA damage in H1299 and HeLa cells. The time course of expression of BTG3 was analyzed essentially as in panel B.
p53 transactivates the BTG3 gene via a consensus binding sequence in intron 2
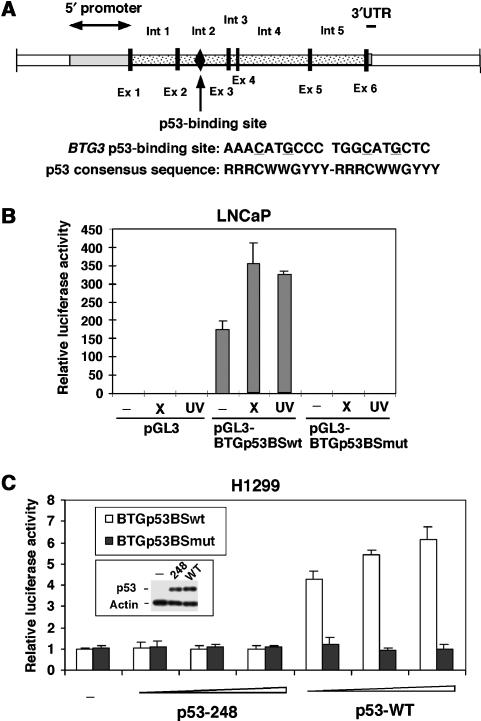
To delineate the mechanism underlying DNA damage-induced expression of BTG3, we scanned sequences of the gene for potential response elements. Specifically, we tested two fragments, one derived from the upstream promoter (BTG3P), the other from intron 2 (BTG3I), which also carries a consensus p53-binding site (Figure 2A). Although the 1 kb promoter fragment did not confer any DNA damage response after either IR or UV (Supplementary Figure S1A), the 0.9 kb intron 2 fragment was able to drive the expression of the reporter in a DNA damage-regulated manner (Supplementary Figure S1B). However, when the consensus p53 binding sequence (p53 BS) was mutated, the intron 2 fragment was no longer active (Supplementary Figure S1B, BTG3Imut), despite that the endogenous p53 was present at similar levels (Supplementary Figure S1C). In fact, the consensus p53 binding sequence (BTGp53BS) alone was sufficient in conferring the IR- or UV-induced expression in LNCaP cells; again, the activity was abolished when the site was mutated (Figure 2B).
Figure 2.
DNA damage-induced expression of BTG3 is mediated through a putative p53-binding site located in intron 2. (A) Schematic diagram of BTG3 including the 5′ promoter region, exons (Ex) and the neighboring introns (Int). The p53 consensus binding site is marked and indicated by an arrow. Also shown is the comparison of the BTG3 p53-binding site with the consensus sequence known for p53 binding. There is no spacing between the two half sites in the BTG3 p53 binding sequence. (B) The putative p53 binding sequence in intron 2 can mediate the DNA damage response independent of other intron sequences. Luciferase assays were performed with a reporter driven by the p53 binding sequence isolated from intron 2 (pGL3-BTGp53BS). A reporter with mutated sequence (pGL3-BTGp53BSmut) was also examined. (C) The WT but not the mutated p53 binding sequence is activated by exogenously expressed WT p53 but not by the 248 mutant. All luciferase activities were presented after normalization to the cotransfected β-galactosidase control. Error bars represent standard deviations of at least three independent experiments.
To determine if the intron 2 reporter could work with p53 in cells where BTG3 was not normally induced, we transfected the reporter together with p53 into p53-null H1299 cells. The activity of the wild-type (WT) reporter, but not the mutant, was greatly enhanced in the presence of the transfected p53 (Supplementary Figure S1D). Furthermore, the putative p53 binding sequence alone could be activated by WT p53 but not by the 248 mutant (Figure 2C).
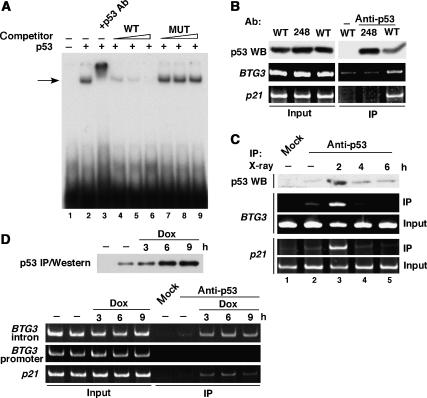
Whether this activation was mediated by direct binding of p53 to the consensus site was examined by electrophoresis mobility shift assay (EMSA). As shown in Figure 3A, a 32P-labeled oligonucleotide containing the putative p53 site from intron 2 was readily shifted by purified, recombinant p53. The binding complex could be competed away by the WT but not by the mutated oligonucleotide. The p53 antibody PAb122 super-shifted the complex (Figure 3A, lane 3), further demonstrating the specificity of the binding.
Figure 3.
p53 binds to the consensus site in BTG3 intron 2 in vitro and in vivo. (A) Recombinant p53 expressed and purified from bacteria binds directly to the consensus sequence (p53BS) derived from BTG3 intron 2, as revealed by EMSA The arrow points to the p53–DNA complex. (B) Exogenously expressed WT but not mutant (248) p53 binds to BTG3 intron 2. ChIP assay was performed using the p53 antibody PAb1801 and lysates prepared from H1299 cells producing either WT or mutant p53. Precipitated DNA was amplified by PCR, using primers derived from BTG3 intron 2 or p21 promoter. Western blotting (WB) with p53 antibody DO1 was also performed to determine the amount of p53 in the lysate (Input) and in the immunoprecipitate (IP). (C, D) Endogenous p53 induced by DNA damage binds to BTG3 intron 2. ChIP was conducted as described in panel B, using lysates prepared from LNCaP cells treated with X-ray (8 Gy) (C) or doxorubicin (Dox, 1 μM) (D). PCR using primers corresponding to the BTG3 proximal promoter was also performed in panel D.
To determine if p53 indeed binds to the site in vivo, chromatin immunoprecipitation (ChIP) assays were conducted in H1299 cells transfected with either WT or mutant p53. The results indicated that transfected WT but not the mutant p53 can bind to the putative site in intron 2 (Figure 3B). Whether endogenous p53 can also bind to the site, in particular after DNA damage, was further examined in LNCaP cells using ChIP assays. Binding was detected transiently at the site 2 h after IR (Figure 3C). Similarly, after treatment with doxorubicin, binding to the BTG3 intron but not the promoter region was first observed at 3 h and was still readily detectable at 9 h (Figure 3D). In all cases, binding to the p21 promoter appeared to be regulated concomitantly with the BTG3 intron (Figure 3B–D), suggesting the similarity in their kinetics of regulation.
Taken together, these results strongly indicate that BTG3 is a p53-inducible gene and that its induction is mediated through a consensus p53 binding sequence located in intron 2. These data however do not exclude the possibility that other factors may also be involved, especially in light of the slight increase in BTG3 mRNA after UV in H1299 cells (Figure 1C).
BTG3 protein is induced by DNA damage in a p53- and CHK1-dependent manner
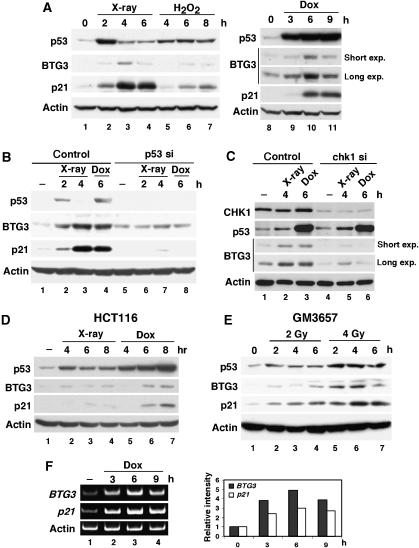
As p53 is activated by DNA damage, we wondered whether expression of the BTG3 protein is also induced by DNA damage. To address this, we generated an antibody against His-tagged, full-length (FL) recombinant BTG3. The antibody detected a 30 kDa endogenous protein of expected size, which was no longer detected when cells were transfected with BTG3-targeting siRNA (see Figures 5A, 7L; Supplementary Figures S2 and S5, below), and it also detected the transfected HA-tagged BTG3 in cell lysates (see Figure 5F, below). Using the antibody, we then analyzed the lysates prepared from LNCaP cells before and after DNA damage. Similar to p21, a known DNA damage-inducible protein, the level of BTG3 was increased after IR, H2O2 and doxorubicin treatments (Figure 4A). The increase from IR was abolished in cells transfected with p53-targeting siRNA, (Figure 4B) or CHK1 siRNA (Figure 4C), indicating that induction was dependent on p53 and CHK1. In addition, DNA damage-inducible expression was also observed in the colon cancer cell lines HCT116 (Figure 4D) and the lymphoblastoid cells GM3657 (Figure 4E), both carrying WT p53. These results are in agreement with those of promoter analysis, providing further support to the model that BTG3 is a DNA damage-inducible protein and that p53 and CHK1 are responsible for its increase after DNA damage. It should be noted that we were unable to detect DNA damage-induced expression of BTG3 in several human cell lines, including WI38, MCF7, RKO and A549, although basal levels were readily detected in these cells. The reason for this is unclear.
Figure 4.
BTG3 protein is induced by DNA damage in a p53-dependent manner. (A) BTG3 in LNCaP cells is induced by various DNA damage agents. Cells were treated with 8 Gy of X-ray (lanes 2–4), 0.5 mM of H2O2 (lanes 5–7) or 1 μM of doxorubicin (lanes 9–11), and then collected at the indicated time points. The amounts of p53, p21, BTG3 and actin were determined by Western blotting using appropriate antibodies. (B) p53 is required for the DNA damage-induced expression of BTG3. LNCaP cells were transfected with control or p53 siRNA, and lysates were then prepared and analyzed as described in panel A. (C) Induction of BTG3 by DNA damage is CHK1-dependent. CHK1 in LNCaP cells was first downregulated using specific siRNA, and the induction of BTG3 protein was analyzed as in panel B. (D, E) DNA damage-induced expression of BTG3 in HCT116 colorectal carcinoma cells (D) and GM3657 lymphoblastoid cells (E). Cells were treated and analyzed as in panel A, except that 0.5 μM doxorubicin (Dox) was used. (F) Expression of the BTG3 and the p21 transcripts after doxorubicin treatment as determined by semi-quantitative RT–PCR. The bar graphs on the right represent the results of quantification. Short and long exposure (exp.) on BTG3 expression were both presented in panels A and C.
Whether induction of the BTG3 protein correlated with its RNA expression was further examined by RT–PCR (Figure 4F). In agreement with the ChIP results (Figure 3D), both the BTG3 and the p21 transcripts were significantly increased at 3 h after doxorubicin treatment, and the induction reached the highest levels at 6 h. Since the increase in BTG3 and p21 proteins was not apparent until 6 h (Figure 4A), it is likely that additional regulation at the post-transcriptional level may be involved.
BTG3 is involved in the maintenance of the IR-induced G2/M checkpoint in HCT116 cells
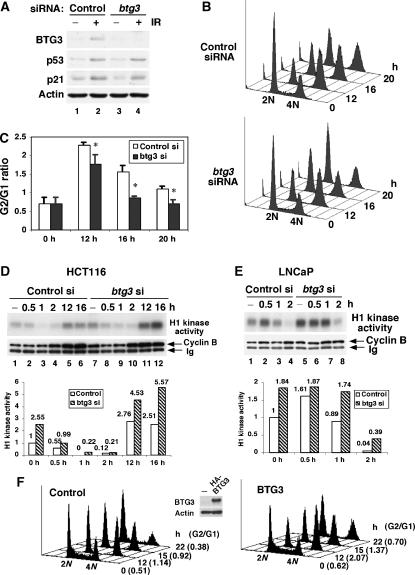
Although BTG3 belongs to the antiproliferative BTG/Tob family of genes, its role in cell growth regulation and in particular, DNA damage response, remains elusive. To address this issue, an siRNA knockdown approach was undertaken to delineate its role in the DNA damage response of the colon cancer cell line HCT116. BTG3 siRNA effectively blocked the induction of BTG3 protein after IR (Figure 5A). The ablation was specific for BTG3, as it did not affect the expression of other BTG family members such as BTG1, BTG2, Tob and Tob2 (Supplementary Figure S2A). Progression of the cell cycle after IR was then followed using flow cytometry. Interestingly, although there was a normal initiation of the checkpoint response, as evidenced by reduction of the S-phase cells and accumulation of G2/M cells, the maintenance of the checkpoint response was impaired (Figure 5B). The defect was most obvious at 16 h after IR, with the G2/G1 ratio rapidly lowered to 0.8 in BTG3-ablated cells compared with 1.7 in the control cells (Figure 5C). Similar results were observed using another siRNA-targeting BTG3 (btg3–2), further confirming the defect (Supplementary Figure S3A and B). The transient nature of the arrest was not because of defective p53 response, as the induction of p53 and p21 appeared to be normal in BTG3-ablated cells (Figure 5A). This indicates that BTG3 acts downstream of p53 in maintaining proper G2/M arrest after IR.
Figure 5.
BTG3 is required for the maintenance of G2 arrest after IR. (A) Immunoblots demonstrating BTG3 knockdown after siRNA transfection in HCT116 cells. (B) Flow cytometry analysis of control and BTG3-ablated HCT116 cells before and after IR. Early exit from the G2 block was observed in the BTG3 knockdown cells. (C) Quantification of results from three independent experiments shown in panel B. The G2 to G1 ratio was used to represent the degree of G2 arrest. *Indicates statistical significance (P<0.05) as determined by Student's t-test. (D, E) Disregulation of Cyclin B-associated H1 kinase activity in BTG3 knockdown cells after IR. HCT116 (D) or LNCaP (E) cells were first transfected with siRNA then irradiated with IR as in panel B. Cyclin B–Cdk1 kinase activity was determined by immunoprecipitation with anti-Cyclin B antibody, followed by an in vitro kinase assay using histone H1 as substrate. The H1 kinase activity was quantified and presented as bar graphs. (F) The G2/M checkpoint response is enhanced and extended in BTG3-overexpressing HCT116 cells. Cells were transfected with HA-BTG3 and irradiated with IR 24 h after the transfection. The G2/G1 ratios are shown in parentheses. Similar results were observed in two other independent experiments.
The Cdk-associated H1 kinase activity was further examined in these cells, and impaired regulation was evident upon ablation of BTG3 (Figure 5D and E). In control cells, the Cyclin B-associated Cdk activity was completely inhibited 1 h after IR, whereas in BTG3-ablated cells it was still measurable (Figure 5D, compare lane 3 to lane 9). Such ineffective downregulation was also observed in LNCaP cells (Figure 5E). In contrast, a more robust recovery was seen in BTG3 knockdown cells (Figure 5D, 12 and 16 h), indicating that, although checkpoint was eventually attained, it was barely maintained. The slower kinetics in inhibition of the Cdk activity were not because of defects in the sensing and activation of the ATM/CHK2 pathway, as the induction of ATM Ser1981 and CHK2 Thr68 phosphorylation was normal in BTG3 knockdown cells (Supplementary Figure S4). Taken together, these results suggest that BTG3 is required for proper damage response downstream from ATM/CHK2 and p53; it very likely plays a role in maintenance of the G2/M block. The latter was further confirmed by overexpression of BTG3 in HCT116 cells, which although did not arrest cells in G2 by itself, significantly increased the proportion and extent of the G2/M block after IR (Figure 5F).
BTG3 regulates cell proliferation via mechanism(s) distinct from that used by BTG2
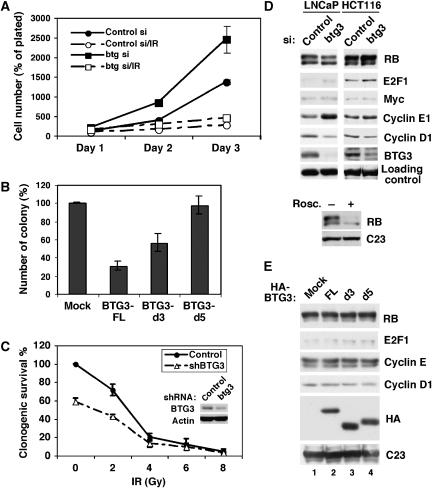
Although members of the BTG/Tob family such as BTG1 and BTG2 have antiproliferative activity, whether BTG3 possesses similar functions has yet to be determined. We therefore performed similar knockdown experiments as described above in HCT116 cells and compared the growth rate. Despite that same numbers of cells were plated after siRNA transfection, the BTG3 knockdown cells consistently outgrew the control cells (Figure 6A). Proliferation of both cells was significantly deterred following IR, consistent with the induction of p21 (Figure 5A) and the downregulation of Cdk activity (Figure 5D). Conversely, overexpression of BTG3 in the same cells markedly suppressed cell growth, as revealed by colony formation assay (Figure 6B). These results support the conclusion that, like BTG1 and BTG2, BTG3 can act as a negative regulator of cell proliferation.
Figure 6.
BTG3 regulates cell proliferation by an RB-independent pathway. (A) Increased growth rate after BTG3 depletion. siRNA-transfected HCT116 cells were replated in duplicate in six-well plates (2.5 × 10⁴ cells/well) with or without prior X-ray irradiation. Cell numbers were taken one, two and three days after plating and expressed as percentages of cells plated on day 0. Means of three independent experiments are shown. (B) Overexpression of BTG3 suppresses cell growth. Colony formation assay was performed with HCT116 cells transfected with empty vector (mock) or vectors expressing HA-tagged FL BTG3 protein (FL) or two truncation mutants (d3, d5; Figure 7). The relative expression of these constructs is shown in (E) by immunoblotting. Means of three independent experiments are shown. (C) Reduced cell survival as a result of BTG3 ablation. HCT116 cells were transfected with empty vector (control) or vector expressing BTG3-targeting shRNA (shBTG3). After 48 h, cells were irradiated with IR and replated. Colonies formed after 8–10 days of puromycin selection were counted. Shown are means of three independent experiments. The Western blot was performed at the second day after transfection. (D) The status of RB phosphorylation is not affected by BTG3 depletion. LNCaP or HCT116 cells were transfected with siRNA and analyzed for the levels of RB, E2F1, myc, Cyclin E, Cyclin D1 and BTG3 by immunoblotting. Actin (LNCaP) or C23/nucleolin (HCT116) was used as a loading control. Lower panel, control Western blot analysis of LNCaP lysates demonstrating the RB antibody was able to distinguish hyper- versus hypo-phosphorylated forms of RB. Cells were treated with 50 μM roscovatine (Rosc.) for 24 h before collection. (E) RB phosphorylation is not altered by BTG3 overexpression. Transiently transfected HCT116 cells were analyzed by immunoblotting as in panel D.
As mutation of many tumor suppressors affects long-term cell survival, especially after DNA damage, we also examined the survival rate of BTG3 knockdown HCT116 cells by clonogenic assay. In fact, compared with the control untreated cells, less than 60% of the BTG3-ablated cells survived the 10-day selection, and the rate decreased further after 2 Gy of IR (Figure 6C). Similar results were also observed in another cell line, LNCaP (Supplementary Figure S5). The response was indistinguishable from the control at higher doses, very likely due to the limitation of the assay. Therefore, despite the gain in their proliferation potential (Figure 6A), loss of BTG3 is unfavorable for long-term survival of the cells with or without damage.
BTG2 has been shown to suppress cell proliferation by inhibiting the expression of Cyclin D1, resulting in hypophosphorylation of RB and arrest of cell cycle at G1/S (Guardavaccaro et al, 2000). However, in the BTG3 knockdown cells, there was no apparent alteration in the levels or phosphorylation of RB; instead, there was an increase in Cyclin E and a decrease in Cyclin D1 (Figure 6D). This was also observed using another BTG3 siRNA btg3–2 (Supplementary Figure S3C). Overexpression of BTG3 did not affect either RB phosphorylation or Cyclin D1 level (Figure 6E). These results suggest that BTG3 may act through a different mechanism downstream from RB.
BTG3 binds and inhibits E2F1
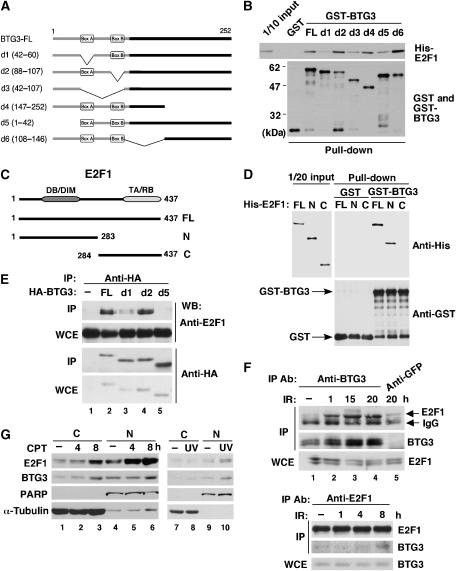
As RB regulates G1/S entry by binding and inactivating E2F1, E2F1 is the next probable BTG3 target, downstream from RB. Knockdown of BTG3 caused an increase in Cyclin E level and a decrease in Cyclin D1 (Figure 6D): the activation and repression targets, respectively, of E2F1 (Ohtani et al, 1995; Watanabe et al, 1998). This led us to suspect that E2F1 may be a target of BTG3. Indeed BTG3 bound directly to recombinant His-tagged E2F1 in vitro in a glutathione-S-transferase (GST) pull-down assay (Figure 7B). Binding required the N-terminal amino acids 1–42 of BTG3 and box A, as deletion of these two domains in constructs d5 and d1 (Figure 7A), respectively, significantly diminished binding. Surprisingly, although box B has been shown to mediate growth suppression by BTG2 (Guardavaccaro et al, 2000), it is completely dispensable for the binding of BTG3 to E2F1, because the d2 construct bound as well as the FL (Figure 7B) and acted as efficiently in the inhibition of E2F1 (shown below in Figure 7H). As E2F1 functions as a heterodimer with DP1, we also examined the possibility of BTG3 interacting with DP1. Indeed, DP1 also bound BTG3 in the GST pull-down assay and similar regions in BTG3 were required for the interaction (data not shown).
Figure 7ag.
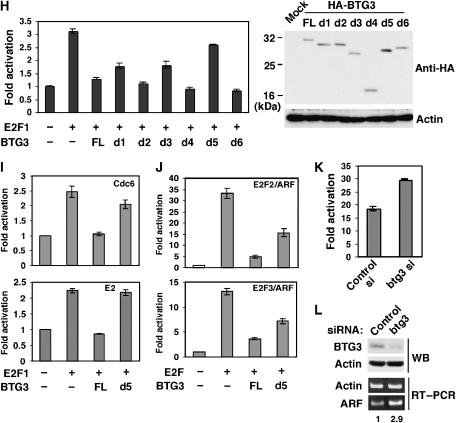
BTG3 interacts with and inhibits E2F1. (A) Schematic representations of BTG3 FL and truncation mutants d1, d2, d3, d4, d5 and d6 with the deleted amino acids indicated in parentheses. (B) BTG3 interacts directly with E2F1 in vitro through the N-terminal 60 amino acids including box A but not box B. GST pull-down assay was performed with GST or GST-BTG3 proteins and purified His-E2F1. The amounts of input and pulled down proteins are shown by Western blotting. (C) Schematic diagrams of E2F1 FL and two truncation mutants N and C. The truncation mutant E2F1-N contains the DNA-binding domain (DB) and a region responsible for DP1 interaction (DIM), whereas E2F1-C carries the transactivation (TA) and RB-binding (RB) domains. (D) The N-terminal domain of E2F1 interacts directly with BTG3 in vitro. GST pull-down assays were conducted as in panel B. Shown are Western blots of input and pulled down proteins. (E) BTG3 and E2F1 interact in vivo. HA-tagged BTG3 and E2F1 were coexpressed in HCT116 cells and the interaction was detected by immunoprecipitation with anti-HA followed by immunoblotting with E2F1 antibody. (F) DNA damage enhances the interaction between endogenous E2F1 and BTG3. HCT116 cells were irradiated with 8 Gy of IR and collected at the indicated times. The interaction was analyzed by immunoprecipitation with anti-BTG3 (upper panel) or by anti-E2F1 (lower panel). An unrelated antibody anti-GFP was used as a negative control. (G) Cellular distribution of BTG3 and E2F1 before and after DNA damage. HCT116 cells were treated with 20 nM CPT and collected at the indicated times, or with UV (30 J/m2) and harvested 2 h later. Cytosolic (C) and Nuclear (N) fractions were then separated and analyzed by Western blotting. PARP and α-tubulin were used as nuclear and cytosolic markers, respectively. (H) The transactivation activity of E2F1 is inhibited by FL BTG3, but not by BTG3 mutants that bind poorly to E2F1. HCT116 cells were transfected with E2F1 and a luciferase reporter driven by the ARF promoter, together with or without cotransfected HA-BTG3. Values are shown after normalization to the coexpressed β-galactosidase activity. Averages of three duplicated experiments are shown; error bars represent standard deviations. The levels of FL and truncated BTG3 used in these experiments are shown on the right by Western blotting. (I) BTG3 inhibits the activation of the Cdc6 and the E2x4 reporter by E2F1. (J) Activation of the ARF promoter by E2F2 and E2F3 is inhibited by BTG3. (K) Depletion of endogenous BTG3 by siRNA enhances E2F1-mediated transactivation. HCT116 cells were first transfected with control or BTG3 siRNA and then transfected the next day with the ARF reporter in the presence or absence of cotransfected E2F1. Assays were conducted as in panel H. A 50% increase was observed in E2F1-mediated transactivation when BTG3 expression was ablated. (L) The expression of endogenous ARF was increased in BTG3 knockdown IMR90 cells. RT–PCR was performed on RNA extracted from siRNA-transfected IMR90 cells, using specific primers corresponding to the coding region of p14/ARF. Numbers indicate relative expression after normalization to actin.
Figure 7hl.
Continued.
In E2F1, the interaction region was mapped to the N-terminal half of the protein encompassing the DNA-binding and dimerization motifs (Figure 7C), because the N-domain construct (1–183) bound GST-BTG3 as well as the FL and binding by the C-domain (284–437) was basically undetectable (Figure 7D). Concurrently, interaction between BTG3 and E2F1 was also observed in vivo when both proteins were coexpressed (Figure 7E), and again, the N-terminal 60 amino acids appeared to be essential for this. Most importantly, the interaction between endogenous BTG3 and E2F1 was enhanced upon DNA damage (Figure 7F, compare lanes 1 and 2), and was still vividly observable at 20 h after IR (Figure 7F, upper panel). Increase in interaction after IR was also detected in reciprocal immunoprecipitation using E2F1 antibody (Figure 7F, lower panel).
The interaction between endogenous E2F1 and BTG3 also raised the question regarding the cellular localization of BTG3 and E2F1, as BTG3 was shown to be cytoplasmic by immunofluorescence in PC12 cells (Rahmani, 2006). To address this, cytoplasmic and nuclear fractions were prepared from HCT116 cells treated with camptothecin (CPT) or UV, and analyzed by Western blotting. Both proteins were present in cytosol and nucleus, and their levels increased upon DNA damage (Figure 7G). By immunofluorescence, overexpressed BTG3 preferentially localized to cytoplasm, although nuclear distribution was also detected (Supplementary Figure S6). Partial colocalization was observed by confocal microscopy (Supplementary Figure S6).
The functional consequences of such interaction were investigated using an E2F1-driven reporter assay in HCT116 cells. In this assay, the FL BTG3 protein effectively blocked the activation of the ARF promoter by E2F1; loss of box A or the N-terminal 42 amino acid in constructs d1, d3 and d5 reproducibly diminished the inhibition (Figure 7H). The Cdc6 promoter and the adenovirus E2 enhancer, both activated by E2F1 (Komori et al, 2005), were also suppressed by FL BTG3, and the inhibition was mitigated by deletion in d5 (Figure 7I). Besides E2F1, two other activating E2Fs, E2F2 and E2F3, were also negatively regulated by BTG3, as this was revealed by the inhibition of E2F2- and E2F3-dependent activation of the ARF reporter by BTG3 (Figure 7J), and direct protein–protein interaction in GST pull-down assay (Supplementary Figure S7).
The physiological consequence of such an interaction was demonstrated further by colony formation assay, in which the d5 construct completely lost and the d3 construct partially lost growth suppression functions (Figure 6B).
To gain further insights into the role of endogenous BTG3, siRNA was used in combination with the reporter assay. Upon BTG3 knockdown, the activity of transfected E2F1 was elevated moderately (Figure 7K), indicating that endogenous BTG3 plays at least a partial role in the regulation of E2F1 activity. Similar results were obtained using another siRNA btg3–2 (Supplementary Figure S3D). Concurrently, knockdown of BTG3 in the normal human fibroblasts IMR90 and LNCaP cells increased the endogenous ARF expression by 2.9- (Figure 7L) and 1.6-fold (Supplementary Figure S2A), respectively. Increase in p14/ARF protein was also detected by Western blotting in BTG3-ablated LNCaP cells (Supplementary Figure S2B). We were not able to detect the ARF protein by Western blotting in IMR90 cells, very likely due to its low level of expression.
Taken together, our results strongly indicate that, by binding to E2F1 and probably also E2F2 and E2F3 through the N-terminal domain, BTG3 exerts a negative regulatory role in E2F-dependent transactivation and cell proliferation.
BTG3 modulates the G2/M checkpoint by blocking the DNA binding activity of E2F1
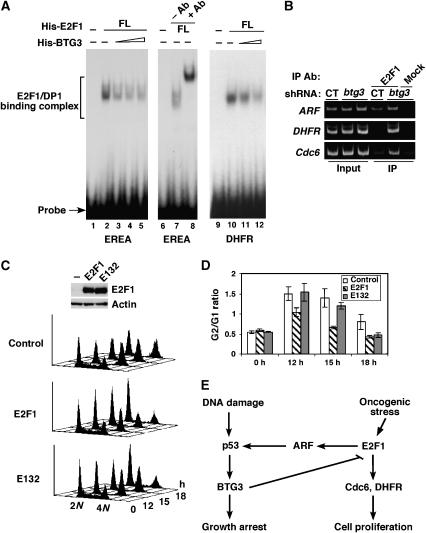
As BTG3 binds the E2F1 N-terminal domain responsible for specific DNA binding, one possibility is that binding of BTG3 may prevent E2F1 from binding to its target site. To examine this, an in vitro binding assay (EMSA) was conducted by incubating purified, recombinant His-tagged E2F1 and DP1 (Supplementary Figure S8A) with labeled probe derived from the ARF promoter (EREA) (Komori et al, 2005) or the DHFR promoter (Figure 8A). Specific binding complexes were formed upon adding FL E2F1 together with DP1 (Figure 8A, lanes 2 and 7), and the complexes were upshifted by antibodies raised against the N-terminal domain of E2F1 (Figure 8A, lane 8). Addition of increasing amounts of purified recombinant His-BTG3 (Supplementary Figure S8B) inhibited the E2F1 binding activity in a dose-dependent manner (Figure 8A, lanes 3–5; lanes 11 and 12), suggesting that interaction between E2F1 and BTG3 is unfavorable for its DNA binding.
Figure 8.
BTG3 regulates the G2/M DNA damage checkpoint by blocking the DNA binding activity of E2F1. (A) BTG3 disrupts the sequence-specific DNA binding activity of E2F1 in vitro. EMSA was performed with purified His-E2F1, His-DP1 (50 ng each) and 32P-labeled E2F1 binding sequence derived either from the ARF promoter (EREA, lanes 1–8) or the DHFR promoter (lanes 9–12). Increasing amounts of purified His-BTG3 (40, 80 and 160 ng, respectively) were added as indicated. E2F1 antibody was added in lane 8 to show the binding specificity. (B) BTG3 knockdown promotes binding of E2F1 to the endogenous ARF, DHFR and Cdc6 promoters. HCT116 cells were transfected with plasmids expressing BTG3-targeting shRNA, and binding of E2F1 to its target promoters was assessed by ChIP using anti-E2F1 antibody (lanes 4 and 5) or an unrelated antibody (lane 6) as negative control. CT, control vector. (C) HCT116 cells overexpressing E2F1 but not the DNA-binding-defective mutant E132 are impaired in G2/M arrest after IR. The G2/G1 ratios from three independent experiments are averaged and shown in (D). (E) Model depicting the relationship between p53, BTG3, E2F1 and its targets as described herein (see Discussion).
To test if binding of E2F1 to its target promoters was regulated by BTG3 in vivo, ChIP was performed using BTG3 knockdown HCT116 cells. As clearly shown in Figure 8B, binding of endogenous E2F1 to the ARF promoter was enhanced when endogenous BTG3 was downregulated by short-hairpin RNA (shRNA). The increase was even more pronounced on the Cdc6 and DHFR promoters. This, in conjunction with the binding inhibition observed in vitro, strongly suggest that BTG3 may inhibit E2F1 by modulating its DNA binding activity.
As BTG3 downregulation led to impaired G2/M arrest after IR (Figure 5B), we then sought to determine whether overexpression of E2F1 would mimic such a defect. Indeed, similar to those BTG3 knockdown cells, cells overexpressing E2F1 exhibited impaired G2/M block after IR (Figure 8C and D). In contrast, cells overexpressing E132, an E2F1 mutant defective in DNA binding, behaved almost as the control cells, further supporting the notion that regulation of E2F1 DNA binding activity by BTG3 is crucial for proper execution of the G2/M arrest after DNA damage. It should be noted that at late time point of the arrest (18 h), E132-expressing cells became indistinguishable from the E2F1-expressing cells (Figure 8C and D), suggesting the possibility that in addition to the DNA binding activity, other function of E2F1 may also be guarded by BTG3.
Discussion
In this report, we have described the identification of a p53 target gene, BTG3, whose expression is induced by DNA damage in a CHK1- and p53-dependent manner. The importance of BTG3 in DNA damage response was further highlighted by the defect in maintaining G2/M arrest upon its downregulation in HCT116 cells. Moreover, BTG3 appears to possess a growth suppression function and, paradoxically, does not affect RB phosphorylation, a property that sets it apart from other BTG family members. Instead, the BTG3 protein binds directly to and inhibits E2F1, a target downstream from RB.
Mechanisms of E2F1 inhibition by BTG3
As the BTG3 protein binds the E2F1 N-terminal region containing a specific DNA-binding domain, the most likely explanation for inhibition is that this interaction somehow interferes with the recognition of DNA by E2F1. Indeed, the DNA binding activity of E2F1 was markedly reduced in the presence of BTG3 protein (Figure 8A). Consistently, reducing BTG3 by siRNA in cells augmented binding of E2F1 to its targeted promoters (Figure 8B). This mode of E2F1 inhibition by the BTG3 protein is distinct from that used by the pocket proteins, in particular, RB. RB binds the C-terminal transactivation domain of E2F1, whereas BTG3 binds the N-terminal DNA-binding domain. RB/E2F1 interaction has no effect on E2F1 DNA binding activity, whereas BTG3 interaction is incompatible with DNA binding. Furthermore, knockdown or overexpression of BTG3 did not have any effect on the phosphorylation status of RB, suggesting that BTG3 and RB may utilize different mechanisms to regulate E2F1.
Inhibition of E2F1 by a non-pocket protein is not without precedence. p21/Waf1, besides being a Cyclin-dependent kinase inhibitor, was reported to associate with and inhibit E2F1 in an RB-independent pathway (Delavaine and La Thangue, 1999; Devgan et al, 2005). Interestingly, p21 is also a target of p53 when p53 is activated by DNA damage. Unlike BTG3, p21 associated with E2F1 at the promoter and interfered with the recruitment of coactivators (Devgan et al, 2005).
BTG3 and G2 checkpoint
Because BTG3 is induced by DNA damage through p53 activation, we speculate that BTG3, once induced, may execute some aspects of checkpoint function downstream of p53. As our data indicated, the BTG3 knockdown cells, although capable of checkpoint initiation, displayed accelerated exit from IR-induced G2 arrest (Figure 5B; Supplementary Figure S3B). Although the underlying mechanism is still not fully understood, we suspect that the impairment may be related to the disregulated Cdk activity in these cells. As shown in Figure 5D and E, these knockdown cells apparently possess elevated Cdc2 activity, demonstrated by the delayed reduction and also by the more robust recovery in Cyclin B-associated H1 kinase activity after IR. The defect in maintaining the G2 block after IR bears significant similarity to cells expressing oncogenic RAS, described by Knauf et al (2006). This similarity is striking because activating the RAS signal would eventually lead to hyperphosphorylated RB and activated E2F1. Their results together with ours suggest that disregulated cell proliferation may interfere with cell cycle checkpoint. This notion is further supported by our E2F1 overexpression experiments (Figure 8C). Different from other checkpoint players, the main function of BTG3 may not lie in the initiation of the ‘break', but in controlling cell proliferation by inhibiting E2F1. Since RB phosphorylation was not affected by either BTG3 knockdown or overexpression (Figure 6D and E), it is not likely that BTG3 plays a major role in the G1 to S transition in normal cell cycle progression. Instead, the increased interaction between BTG3 and E2F1 after IR (Figure 7F) is more consistent with a role of BTG3 in DNA damage response. This can be achieved by increased BTG3 expression as a result of p53 activation, or by post-translational modification of E2F1 as reported previously (Martinez-Balbás et al, 2000; Lin et al, 2001; Pediconi et al, 2003; Stevens et al, 2003).
Paradoxically, cells with downregulated BTG3 although divided more readily, did not survive better (Figure 6). Similar results were recently observed by Wang et al (2006) when the function of the checkpoint protein Rad17 was disrupted. It is possible that unscheduled cell proliferation may trigger DNA breakage, and subsequently growth arrest or cell death. These together highlight the importance of the coordination between cell proliferation and checkpoint control, and further point to a possible role of BTG3 in maintaining genome stability and as a tumor suppressor. Interestingly, loss of heterozygosity and promoter methylation of the BTG3 gene have been found in certain oral cancers (Yamamoto et al, 2001), suggesting that BTG3 may be a potential tumor suppressor gene.
Our current data are consistent with a model (Figure 8E) in which the BTG3 protein level is increased after DNA damage through activated p53, which then acts to keep the activity of E2F1 at bay and to facilitate the proper execution of checkpoint function. In addition, upon oncogenic stress, p53 accumulation as a result of activated E2F1 and increased ARF production would lead to increased BTG3 expression, which in turn would inhibit E2F1, forming a regulatory loop. According to this model, one would expect that apart from the checkpoint defect as illustrated in this report, BTG3 depletion under oncogenic stress would promote premature senescence because of uncontrolled ARF production. In this respect, BTG3 ablation would be functionally equivalent to oncogenic stimulation. It is worth noting that many cancer cells, including HCT116 used in this study, have impaired ARF expression (Burri et al, 2001). Although this allows us to dissect the relationship between BTG3 and E2F1 in more details, the possible involvement of ARF in the regulatory circuit would be best studied in a normal cellular setting. Nevertheless, our study provides new mechanistic insights on the regulation of E2F1 and also points to a possible strategic approach in cancer therapy.
Materials and methods
siRNA transfection
Conditions used for siRNA transfection were as described (Wei et al, 2005), using Oligofectamine (Invitrogen). Sequences targeted were the following: BTG3, 5′-AAGGCTAGTTCGAAAACATGA-3′; p53, 5′-AAGACTCCAGTGGTAATCTAC-3′; CHK1, 5′-GGTGCCTATGGAGAAGTTC-3′; control (random), 5′-AAGTCAATATGCGACTGATGG-3′. All siRNAs were synthesized by Qiagen.
For expression of BTG3 silencing shRNA, the above targeted sequence was cloned as a palindrome into pBabeH1 (a kind gift from Dr Xinbin Chen, UC Davis Cancer Center), which was then transfected into cells using Lipofectamine 2000.
Cell lysis and immunoblotting
Cell lysis was conducted as described (Ou et al, 2005). Preparation of cytosolic and nuclear fractions was as previously described (Wu et al, 2006). Antibodies used for immunoblotting were the following: anti-GST (sc-138, Santa Cruz), anti-HA (HA.11, Covance), anti-actin (Sigma-Aldrich), anti-α-tubulin (Sigma-Aldrich), anti-C23/nucleolin (sc-8031, Santa Cruz), anti-myc (sc-40, Santa Cruz), rabbit anti-E2F1 (sc-193, Santa Cruz), mouse anti-E2F1 (Ab-7, Neomarkers), anti-RB (BD Pharmingen), anti-Cyclin E (Ab-1, Calbiochem), anti-Cyclin D1 (sc-20044, Santa Cruz), anti-p21 (Ab-6, Calbiochem) and anti-PARP (Roche).
Generation and purification of anti-BTG3 antibody
Purified His-tagged BTG3 recombinant protein was used for antiserum production in rabbits by LTK Biolaboratories (Touyuan, Taiwan). The anti-BTG3 antiserum was further purified by affinity against antigen immobilized on a nitrocellulose membrane.
Additional Materials and methods are provided in Supplementary data.
Supplementary Material
Supplementary Information
Acknowledgments
We thank Dr Hsin-Fang Yang-Yen for pCMV-E2F1, Dr Kiyoshi Ohtani for pCDC6-Luc and pE2x4-Luc and the microarray core of the Institute of Molecular Biology, Academia Sinica, for technical assistance. This study was supported by the Academia Sinica Cancer Genomics Project, Grant #IBMS1/9 to S-Y Shieh.
References
- Altin JG, Kujubu DA, Raffion S, Eveleth DD, Herschman HR, Bradshaw RA (1991) Differntial induction of primary-response (TIS) genes in PC12 pheochromocytoma cells and the unresponsive variant PC12nnr5. J Biol Chem 266: 5401–5406 [PubMed] [Google Scholar]
- Bode AM, Dong Z (2004) Post-translational modification of p53 in tumorigenesis. Nat Rev Cancer 4: 793–805 [DOI] [PubMed] [Google Scholar]
- Boiko AD, Porteous S, Razorenova OV, Krivokrysenko VI, Williams BR, Gudkov AV (2006) A systematic search for downstream mediators of tumor suppressor function of p53 reveals a major role of BTG2 in suppression of Ras-induced transformation. Genes Dev 20: 236–252 [DOI] [PMC free article] [PubMed] [Google Scholar]
- Bracken AP, Ciro M, Cocito A, Helin K (2004) E2F target genes: unraveling the biology. Trends Biochem Sci 29: 409–417 [DOI] [PubMed] [Google Scholar]
- Bradbury A, Possenti R, Shooter EM, Tirone F (1991) Molecular cloning of PC3, a putatively secreted protein whose mRNA is induced by nerve growth factor and depolarization. Proc Natl Acad Sci USA 88: 3353–3357 [DOI] [PMC free article] [PubMed] [Google Scholar]
- Burri N, Shaw P, Bouzourene H, Sordat I, Sordat B, Gillet M, Schorderet D, Bosman FT, Chaubert P (2001) Methylation silencing and mutations of the p14ARF and p16ink4a genes in colon cancer. Lab Invest 81: 217–229 [DOI] [PubMed] [Google Scholar]
- Devgan V, Mammucari C, Millar SE, Brisken C, Dotto GP (2005) P21WAF1/Cip1 is a negative transcriptional regulator of Wnt4 expression downstream of Notch1 activation. Genes Dev 19: 1485–1495 [DOI] [PMC free article] [PubMed] [Google Scholar]
- Delavaine L, La Thangue NB (1999) Control of E2F activity by p21Waf1/Cip1. Oncogene 18: 5381–5392 [DOI] [PubMed] [Google Scholar]
- Dimova DK, Dyson NJ (2005) The E2F transcriptional network: old acquaintances with new faces. Oncogene 24: 2810–2826 [DOI] [PubMed] [Google Scholar]
- Field SJ, Tsai F-Y, Kuo F, Zubiaga AM, Kaelin WG Jr, Livingston DM, Orkin SH, Greenberg ME (1996) E2F-1 functions in mice to promote apoptosis and suppress proliferation. Cell 85: 549–561 [DOI] [PubMed] [Google Scholar]
- Fletcher BS, Lim RW, Varnum BC, Kujubu DA, Koski RA, Herschman HR (1991) Structure and expression of TIS21, a primary response gene induced by growth factors and tumor promoters. J Biol Chem 266: 14511–14518 [PubMed] [Google Scholar]
- Guardavaccaro K, Corrente G, Covone F, Micheli L, Dagnano I, Starace G, Caruso M, Tirone F (2000) Arrest of G1-S progression by the p53-inducible gene PC3 is Rb dependent and relies on the inhibition of Cyclin D1 transcription. Mol Cell Biol 20: 1797–1815 [DOI] [PMC free article] [PubMed] [Google Scholar]
- Guehenneux F, Duret L, Callanan MB, Bouhas R, Hayette S, Berthet C, Samarut C, Rimokh R, Birot AM, Wang Q, Magaud JP, Rouault JP (1997) Cloning of the mouse BTG3 gene and definition of a new gene family (the BTG family) involved in the negative control of the cell cycle. Leukemia 11: 370–375 [DOI] [PubMed] [Google Scholar]
- Harris SL, Levine AJ (2005) The p53 pathway: positive and negative feedback loops. Oncogene 24: 2899–2908 [DOI] [PubMed] [Google Scholar]
- Knauf JA, Ouyang B, Knudsen ES, Fukasawa K, Babcock G, Fagin JA (2006) Oncogenic RAS induces accelerated transition through G2/M and promotes defects in the G2 DNA damage and mitotic spindle checkpoints. J Biol Chem 281: 3800–3809 [DOI] [PubMed] [Google Scholar]
- Komori H, Enomoto M, Nakamura M, Iwanaga R, Ohtani K (2005) Distinct E2F-mediated transcriptional program regulates p14ARF gene expression. EMBO J 24: 3724–3736 [DOI] [PMC free article] [PubMed] [Google Scholar]
- Laptenko O, Prives C (2006) The transcriptional regulation by p53: one protein, many possibilities. Cell Death Differ 13: 951–961 [DOI] [PubMed] [Google Scholar]
- Lavin MF, Gueven N (2006) The complexity of p53 stabilization and activation. Cell Death Differ 13: 941–950 [DOI] [PubMed] [Google Scholar]
- Lin W-C, Lin F-T, Nevins JR (2001) Selective induction of E2F1 in response to DNA damage, mediated by ATM-dependent phosphorylation. Genes Dev 15: 1833–1844 [PMC free article] [PubMed] [Google Scholar]
- Martinez-Balbás MA, Bauer U-M, Nielsen SJ, Brehm A, Kouzarides T (2000) Regulation of E2F1 activity by acetylation. EMBO J 19: 662–671 [DOI] [PMC free article] [PubMed] [Google Scholar]
- Matsuda S, Rouault R-P, Magaud J-P, Berthet C (2001) In search of a function for the TES21/PC3/BTG1/TOB family. FEBS Lett 497: 67–72 [DOI] [PubMed] [Google Scholar]
- Montagnoli A, Guardavaccaro D, Starace G, Tirone F (1996) Overexpression of the nerve growth factor-inducible PC3 immediate early gene is associated with growth inhibition. Cell Growth Differ 7: 1327–1336 [PubMed] [Google Scholar]
- Muller H, Bracken AP, Vernell R, Moroni MC, Christians F, Grassilli E, Prosperimi E, Vigo E, Oliner Jd, Helin K (2001) E2Fs regulate the expression of genes involved in differentiation, development, proliferation, and apoptosis. Genes Dev 15: 267–285 [DOI] [PMC free article] [PubMed] [Google Scholar]
- Ohtani K, Degregori J, Nevins JR (1995) Regulaition of the cyclin E gene by transcription factor E2F1. Proc Natl Acad Sci USA 92: 12146–12150 [DOI] [PMC free article] [PubMed] [Google Scholar]
- Olivier M, Eeles R, Hollstein M, Khan MA, Harris CC, Hainaut P (2002) The IARC TP53 database: new online mutation analysis and recommendations to users. Hum Mutat 19: 607–614 [DOI] [PubMed] [Google Scholar]
- Oren M (2003) Decision making by p53: life, death and cancer. Cell Death Differ 10: 431–442 [DOI] [PubMed] [Google Scholar]
- Ou Y-H, Chung P-H, Sun T-P, Shieh S-Y (2005) P53 C-terminal phosphorylation by CHK1 and CHK2 participates in the regulation of DNA-damage-induced C-terminal acetylation. Mol Biol Cell 16: 1684–1695 [DOI] [PMC free article] [PubMed] [Google Scholar]
- Pediconi N, Ianari A, Costanzo A, Belloni L, Gallo R, Cimino L, Porcellini A, Screpanti I, Balsano C, Alesse E, Gulino A, Levrero M (2003) Differential regulation of E2F1 apoptotic target genes in response to DNA damage. Nat Cell Biol 5: 552–558 [DOI] [PubMed] [Google Scholar]
- Rahmani Z (2006) APRO4 negatively regulates Src tyrosine kinase activity in PC12 cells. J Cell Sci 119: 646–658 [DOI] [PubMed] [Google Scholar]
- Rimokh R, Rouault JP, Wahbi K, Gadoux M, Lafage M, Archimbaud E, Charrin C, Gentilhomme O, Germain D, Samarut J (1991) A chromosome 12 coding region is juxtaposed to the MYC protooncogene locus in a t(8;12)(q24;q22) translocation in a case of B-cell chromic lymphocytic leukemia. Genes Chromosomes Cancer 3: 24–36 [DOI] [PubMed] [Google Scholar]
- Rodier A, Marchal-Victorion S, Rochard P, Casas F, Cassar-Malek I, Rouault J-P, Magaud J-P, Mason DY, Wrutniak C, Cabello G (1999) BTG1: a triiodothyronine target involved in the myogenic influence of the hormone. Exp Cell Res 249: 337–348 [DOI] [PubMed] [Google Scholar]
- Rouault J-P, Falette N, Guehenneux F, Guillot C, Rimokh R, Wang Q, Berthet C, Moyret-Lalle C, Savatier P, Pain B, Shaw P, Berger R, Samarut J, Magaud J-P, Ozturk M, Samarut C, Puisieux A (1996) Identification of BTG2, an antiproliferative p53-dependent component of the DNA damage cellular response pathway. Nat Genet 14: 482–486 [DOI] [PubMed] [Google Scholar]
- Rouault J-P, Rimokh R, Tessa C, Paranhos G, Ffrench M, Duret L, Garoccio M, Germain D, Samarut J, Magaud J-P (1992) BTG1, a member of a new family of antiproliferative genes. EMBO J 11: 1663–1670 [DOI] [PMC free article] [PubMed] [Google Scholar]
- Stevens C, Smith L, La Thangue NB (2003) Chk2 activates E2F1 in response to DNA damage. Nat Cell Biol 5: 401–409 [DOI] [PubMed] [Google Scholar]
- Wang X, Zou L, Lu T, Bao S, Hurov KE, Hittelman WN, Elledge SJ, Li L (2006) Rad17 phosphorylation is required for claspin recruitment and Chk1 activation in response to replication stress. Mol Cell 23: 331–341 [DOI] [PubMed] [Google Scholar]
- Watanabe G, Albanese C, Lee RJ, Reutens A, Vairo G, Henglein B, Pestell RG (1998) Inhibition of Cyclin D1 kinase activity is associated with E2F-mediated inhibition os Cyclin D1 promoter activity through E2F and Sp1. Mol Cell Biol 18: 3212–3222 [DOI] [PMC free article] [PubMed] [Google Scholar]
- Wei J-H, Chou Y-F, Ou Y-H, Yeh Y-H, Tyan S-W, Sun T-P, Shen C-Y, Shieh S-Y (2005) TTK/hMps1 participates in the regulation of DNA damage checkpoint response by phosphorylating CHK2 on Threonine 68. J Biol Chem 280: 7748–7757 [DOI] [PubMed] [Google Scholar]
- Wu Z-H, Shi Y, Tibbetts RS, Miyamoto S (2006) Molecular linkage between the kinase ATM and NF-κB signaling in response to genotoxic stimuli. Science 311: 1141–1146 [DOI] [PubMed] [Google Scholar]
- Yamamoto N, Uzawa K, Yakushij T, Shibahara T, Noma H, Tanzawa H (2001) Analysis of the ANA gene as a candidate for the chromosome 21q oral cancer susceptibility locus. Br J Cancer 84: 754–759 [DOI] [PMC free article] [PubMed] [Google Scholar]
- Yamasaki L, Jacks T, Bronson R, Goillot E, Harlow E, Dyson NJ (1996) Tumor induction and tissue atrophy in mice lacking E2F1. Cell 85: 537–548 [DOI] [PubMed] [Google Scholar]
- Yoshida Y, Matsuda S, Ikematsu N, Kawamura-Tsuzuku J, Inazawa J, Umenori H, Yamamoto T (1998) ANA, a novel member of Tob/BTG1 family, is expressed in the ventricular zone of the developing central nervous system. Oncogene 16: 2687–2693 [DOI] [PubMed] [Google Scholar]
Associated Data
This section collects any data citations, data availability statements, or supplementary materials included in this article.
Supplementary Materials
Supplementary Information


