

Abstract
Rhythmic discharges of neurons are believed to be involved in information processing in both sensory and motor systems. However their fine structure and functional role need further elucidation. We employed a pattern-based approach to search for episodes of precisely rhythmic activity of single neurons recorded in different brain structures in behaving cats and rabbits. We defined discharge patterns using an algorithmic description, which is different from the previously suggested template methods. We detected episodes of precisely rhythmic discharges, specifically, triads of constant (precision ± 2.5%) inter-spike intervals in the 10–70 ms range. In 54% (67/125) of neurons tested, these patterns could not be explained by random occurrences or by steady or slowly changing input. Rhythmic patterns occurred at a wide range of inter-spike intervals, and were imbedded in non-rhythmic activity. In many neurons, timing of these precisely rhythmic patterns was related to different locomotion tasks or to respiration.
Keywords: activity, motor cortex, parietal cortex, ventrolateral thalamus, respiratory medulla, rhythmicity
INTRODUCTION
Rhythmic patterns in the activity of single neurons and neuronal populations have attracted considerable attention for many years. Such patterns were first studied in the aggregate activity of brain networks assessed by electro-encephalographic techniques (EEG). Rhythmic EEG activity was shown to occur during specific behavioral states such as different phases of sleep (rev. in [62]) and in some pathological conditions, such as seizures (rev. in [46]). Rhythmic EEG patterns occur when populations of neurons receive postsynaptic potentials and discharge periodically, and their periodicity is synchronized. Periodic discharges in the activity of single neurons were indeed shown to occur spontaneously in a variety of brain regions (e.g. [29, 69]), in response to natural stimulation (e.g. [23, 27, 28]), or neuronal membrane polarization [63]. When occurring spontaneously or in response to a natural stimulation, regular discharges of single neurons coincide with regular oscillation in the EEG [4, 5, 16, 28, 45, 51, 69]. Similar to the rhythmic EEG activity, rhythmic discharges of single neurons occur at different ranges of frequencies and correlate with stimuli or behavioral events [3, 12, 27, 28, 38, 39, 44, 45, 74]. Rhythmical discharges of neurons are believed to be important for information processing both in sensory and in motor systems [57, 59], however the fine structure of these discharges needs further elucidation.
Conventional approach to the analysis of regular discharges of single neurons have been constructing peri-stimulus, cross-correlation or auto-correlation histograms and inspecting them for the presence of preferred frequencies at which the neurons discharge [27, 38, 39, 40, 53]. This approach scans a wide range of inter-spike intervals, averages individual episodes of rhythmical activity of the neuron and reveals only those that occur frequently. As such, it is not sensitive to the rhythmic discharges that occur rarely. In addition, this approach does not distinguish between rhythmicity that occurs by chance and that which is truly related to a biological context. Another approach was to search for multiple occurrences of specific discharge patterns in a neuronal spike train [1, 2, 13, 15, 36, 41, 42, 43, 48, 65]. In this case, the first occurrence of a pattern is used as a template, which is compared with the subsequent spikes in order to find the matching patterns. After the matching patterns are found, their repeatability is examined. The template-matching approach reveals only very specific discharge patterns. In the present study, we use one principle of this approach - an interspike intervals analysis. However, we do not define patterns by specific templates, but instead defined them by an algorithmic description. That is, to find a matching pattern we use its general description, an “algorithm”, not an exact template. Particular discharge patterns which satisfy the algorithm can be still unique and un-repeated in the spike train. We hypothesized that such approach will reveal rhythmic discharges in a wide range of interspike intervals and allow a correlation of these discharges with behaviors. With this approach, we focused on regular, periodic (precisely rhythmic) discharge patterns and the firing patterns surrounding them, which can be attributed to spike omissions in the basic rhythm. We detected these regular patterns individually by assessing the structure of short sequences of interspike intervals. Using this approach, more detailed information on a neuron’s periodic rhythmical activity was obtained compared to the methods that rely on peri-stimulus or auto-correlation approaches. We investigated the rhythmic discharge patterns in several cortical and sub-cortical motor-related regions in behaving cats and rabbits during different behaviors.
Some of the results have been reported earlier in abstract form [20, 22].
METHODS
Archive neuronal spike activity data collected from 9 adult cats and 3 adult Dutch-Belted rabbits of both sexes was used for this study. The database for this study was a subset from the databases used for our previously published studies [6, 7, 8, 9, 49, 50, 60]. The selection of the neurons and neuronal populations for this study was based on the duration of available spike trains (4000–65000 spikes). During original data collection, all animals were not anesthetized or medicated. All experiments were conducted in compliance with the NIH animal care and use regulations, and were approved by the local Institutional Animal Care and Use Committees.
Surgical procedures
The procedures of surgical preparation of the animals were described previously [7, 50, 52]. Surgery was performed under isoflourane (cats, 2–5%), halothane (cats, 1–2%), or pentobarbital sodium (rabbits, 25–35 mg/kg) anesthesia using aseptic procedures. All rabbits were implanted with the chambers that allowed microelectrode access to the motor cortex. Cats were implanted to allow a microelectrode access to the motor cortex and the ventrolateral thalamus (n=2), or to the parietal cortex (n=2), or to the ventral respiratory neuron group of the medulla (n=5). In cats, for antidromic identification of pyramidal tract neurons of the motor cortex, two stimulating electrodes were implanted vertically into medullary pyramid. In rabbits, for antidromic identification of descending efferent neurons and putative interneurons of the motor cortex (see the criteria below), two or three stimulating electrodes were implanted into ventolateral thalamus. In both rabbits and cats, a plastic/metal base was attached to the scull by means of screws and cement. In the un-anesthetized state it was used for immobilization of the head during the search for the neurons. The scull screws connected together with a copper wire served as a reference electrode.
Cell recording and identification
After several days of recovery, neuronal activity was recorded extracellularly in awake animals using either platinum-tungsten quartz insulated microelectrodes (40 μm OD; [55]) or conventional tungsten varnish insulated electrodes (100 μm OD). The impedance of all types of electrodes was 2–4 MΩ at 1000 Hz. During locomotion experiments, signals were led to a JFET source-follower amplifier AD549 as a first stage (gain=1) and then to a low noise, precision operational amplifier OP27 (gain=20, output impedance less than 70 Ω). Both AD549 and OP27 were positioned on the head of the animal. During respiration experiments, signals were led to a high impedance probe GRASS HIP511 positioned near the animal, and then to GRASS P511 preamplifier. Signals from the microelectrode pre-amplifier were filtered (300 Hz – 10 kHz band pass) using an analog filter of CyberAmp-380, digitized at a sampling frequency of 30 kHz, displayed on the screen, and recorded on the disk of an IBM-compatible computer with Power1401/Spike2 system (Cambridge Electronic Design, Cambridge, UK) or tape-recorded. A waveform analysis was employed on- and off-line to discriminate between and identify the spikes of the neurons using the Power1401/Spike2 system waveform-matching algorithm. Only single unit recordings of excellent quality were used for the analysis. That is, the recordings with: (1) the signal to noise ratio of at least 4, (2) a single waveform, (3) a stable waveform, and for the efferent neurons, (4) a reliable collision during the behavior. A representative record of a neuron discharge is shown in Fig. 1 D.
Figure 1.

Experimental design. A: For cat locomotion experiments, the experimental box was divided into two corridors, and a horizontal ladder was placed in one of them. Cats were trained to pass sequentially and repeatedly through the corridors. B: A similar experimental paradigm was used for rabbit locomotion experiments, only instead of the ladder a set of five barriers was placed in one of the corridors. C: Cat sitting with the head restrained during respiratory experiments. D: A typical record of a neuron’s discharge during standing and locomotion. The bottom trace shows the swing (Sw - deflection up) and stance (St - deflection down) phases of the step cycle of the forelimb contralateral to the recording site in the cortex recorded by an electrical sensor.
To identify pyramidal tract neurons (PTNs) in the motor cortex in cats and corticofugal neurons in layer V in rabbits, we used the test for collision of spontaneously occurring spikes with those evoked by the medullary pyramid (cats) or ventrolateral thalamus (rabbits) electrical stimulation (0.2 msec rectangular pulses of graded intensity in the range of 0.1–0.5 mA) [11, 25]. In rabbits, cortical putative inhibitory interneurons were identified as the neurons, which, in response to the stimulation of thalamus, produced a burst of spikes (n ≥ 3) at a peak frequency > 600 Hz, while not responding antidromically [8, 66, 67, 68].
Behavioral tests
Locomotion tests
After a neuron was isolated, positive reinforcement (food) was used to engage cats (n=4) and rabbits (n=3) in locomotion [54, 61]. A box 2.5 m long and 0.5 m wide served as an experimental chamber. A longitudinal wall divided the box into two corridors that animals passed sequentially and repeatedly. In one of the corridors the floor was flat, whereas a horizontal ladder (cats) or a series of barriers (rabbits) were placed in the other corridor. The crosspieces of the horizontal ladder were flat and 5 cm wide, and they were spaced 25 cm apart (Fig. 1A, see also [7]). A series of barriers consisted of five barriers 4.5 cm high and 2 cm thick placed 43 cm apart (Fig. 1B, see also [8]). In the following text, we call locomotion on the flat surface - “simple” locomotion, and locomotion along a horizontal ladder, with overstepping of series of barriers, or on turns - “complex” locomotion. The passage of an animal through the beginning or the end of each corridor was monitored using infrared photodiodes. The duration of stance and swing phases of the forelimb contralateral to the investigated brain area was monitored using an electrical sensor. The recording session continued as long as the animals were willing to walk for the food reward.
Respiration tests
For respiration experiments, cats (n=5) were habituated to sit quietly on a comfortable pad with their heads restrained for up to four hours per day (Fig. 1C). After getting habituated to this experimental apparatus, the animals typically passed through phases of quiet wakefulness, non-REM sleep, and REM sleep [50].
Strategy for the data analysis and definitions
We developed and implemented an algorithmically described pattern matching approach to detecting episodes of precisely periodic activity in spike trains of single neurons. By its nature, such an approach encompasses a large number of possible individual searches. Before deciding on a particular strategy to use for this study (described below in detail), we have tested many alternative searches. We present here a search that revealed a considerable number of precisely periodic discharge patterns for which it was possible to determine their statistical significance. We have limited our analysis to patterns, consisting of small groups of impulses (four to six sequential impulses as described below). The concrete choice of numbers was a matter of practical convenience. We have chosen three precise inter-event intervals in a row as a basis for the search because this choice provided rare events in randomly reshuffled sequences and a considerable number of events in original sequences of impulses. Thus, in this paper, we describe one type of precisely rhythmic periodic discharge patterns, we call them H3-patterns, where the three similar successive interspike intervals constitute the basis of the pattern (the exact definition is given below). We developed a set of parameters to characterize these patterns and to discriminate between the three possible sources of their origin (Detailed in Appendices 2–6): (1) a random combination of interspike intervals; (2) a constant or slowly changing input; (3) a unique feature of the neuron’s activity. We have examined the relationship between H3-patterns and the activity of the animals (respiration or simple and complex locomotion).
Definition of a precise triad
We first designated single spikes or pairs of spikes that occurred with very short inter-spike intervals of <3 ms as “events” (Fig. 2A). We have then limited our analysis to groups of four consecutive events with similar inter-event intervals (IEIs) in the range of 10–70 ms (that is, to triads of IEIs). We have not examined the intervals less than 10 ms because, in the neuronal populations examined, the discharge rates in the excess of 100 imp/s were infrequent (see below). We did not examine the intervals longer than 70 ms because our preliminary analysis showed that H3-patterns with IEIs longer than 70 ms are really very rare in most of the neuronal populations studied. We have defined the precise triad as the triad in which the difference between the largest and the smallest IEIs did not exceed 5% of its smallest IEI (precision ± 2.5%) (Fig. 2A). This level of precision was set to permit statistical analysis of a sufficient number of precise triads (up to 10 – 20 for a thousand spikes), and at the same time avoid excessive false detections evaluated as the number of precise triads in the randomly permuted spike sequences (less than one per thousand impulses, see below).
Figure 2.

Examples of H3-patterns in the activity of neurons. A: An H3-pattern in the activity of a neuron (MC01) from cat motor cortex. B: An H3-pattern in the activity of a neuron (VL01) from cat ventrolateral thalamus. The inter-event interval (IEIs) are indicated. The events of the triad are designated by bold vertical bars below the spikes.
Definition of an H3-pattern
In addition to the IEIs of the precise triad, we have measured the duration of the two intervals, one that preceded and one that followed the triad (the pre- and post-triad intervals (PPTIs)). If these intervals were equal to the average IEIs (avIEI) of the triad, equal to a half or equal to two avIEIs with a 10% precision (criterion chosen after a preliminary assessment of the data), we called them qualifying PPTIs. The ground behind this choice of specific PPTIs was that the double interval may occur when a spike is “missing” from an otherwise rhythmic pattern. The halved interval may occur when there are several “missing” spikes, and the halved interval is the true frequency of the rhythm. We have defined an H3-pattern as a discharge pattern that consists of a precise triad that could be preceded or/and followed by a qualifying PPTI/PPTIs. If an H3-pattern included PPTI/PPTIs equal to avIEI, the search for the next triad started after the last of the intervals, ascribed to a given triad. Examination of PPTIs allowed us to explore the immediate surroundings of precise triads and get additional clues to the origin of the observed patterns of activity. Examples of H3 patterns in the activity of live neurons are given in Figure 2.
Parameters calculated
Parameters of an H3-pattern
After detection, each H3-pattern was displayed on a computer screen and visually inspected to make sure that there were no mistakes in spike recognition. For each H3-pattern we calculated: (1) the average IEI of the precise triad (avIEI, real numbers in the range 10–70 ms); (2) the number of doublets among the four events of the triad (integer numbers in the range 0–4); (3) the number of PPTIs, that constitute a half of the avIEI (integer numbers in the range 0–2); (4) the number of PPTIs, which constitute double of the avIEI (integer numbers in the range 0–2); (5) the number of PPTIs, equal to the avIEI (integer numbers in the range 0–2); (6) an index (0 or 1) signalizing (=1) if more then one of the parameters (2)–(5) are non-zero. Step-by-step procedures for the analysis of a spike train for the presence of H3-patterns are outlined in Appendix (A1).
Parameters of an individual neuron spike train
Spike trains in the range of 4000–65000 spikes were used for analysis. Each spike train was characterized by the following six parameters: g1 – the total number of the precise triads; g2,..., g6 – sums of the parameters (2)–(6) of individual H3-patterns found in the train. Using parameters gi, each spike train was characterized by a six-dimensional vector (G1, ..., G6), namely, the G-vector. As detailed in Appendixes 2, 4, and 5, the G-vector value was the basis for the decision whether or nor H3-patterns in a spike train can be explained by such trivial causes as random chances or a slow modulation.
In addition, histograms of distribution of IEIs and avIEIs for each spike train were constructed. A H3-factor, Hf, was calculated as a ratio between the difference between the actual number of H3-patterns in an impulse sequence (NH3) and the number of H3-patterns, expected on the basis of null hypothesis to the number of impulses in the sequence (Nspikes, expressed in thousands):
| (1) |
Evaluation of the significance of the data
A number of measures outlined in Appendices 2–6 was undertaken to evaluate the statistical significance and a not-trivial origin of H3-patterns. The comparison with the randomly reshuffled interspike intervals was the basic method for the statistical evaluation of the data. In Appendix 2 we describe the derivation of the expected number for the six parameters of the spike trains. A comparison of these numbers with the observed ones served as the main tool of the statistical inference. Appendix 3 discusses applicability of this statistical tool to the non-stationary data. Appendix 4 describes the derivation of the control sequences of spikes in a neuron model, in which the activity is modulated by a slowly changing signal. In Appendix 5 criteria are presented for a decision regarding a “not trivial” origin of the H3-patterns. Finally, Appendix 6 describes an independent method for evaluation of the statistical significance of the data that is based on evaluation of 3-d distribution of triples of successive interspike intervals (the “double return plots”). It provided data in support of the conclusions reached using methods described in the Appendices 2–5.
Relation of H3-patterns to locomotion (motor and parietal cortex, and ventrolateral thalamus) and respiration (respiratory medulla)
For each neuron, the impulse activity was assessed by calculating: (i) the mean frequency of the discharge, (ii) the degree of its step or breath related modulation, and (iii) the neuron preferred activation phase during a behavior. For each neuron tested during locomotion, the distribution of H3-patterns in the step cycle (during different locomotion tasks) and the H3-factor, Hf, for different tasks (standing, locomotion on the flat surface, on the horizontal ladder or over series of barriers, and on turns) were calculated. For neurons tested during respiration, H3-patterns were examined at different phases of the respiratory cycle. We used Kolmogorov-Smirnov test to evaluate whether the fluctuation of the number of H3-patterns over the behavioral cycle was due to the cycle-dependent discharge frequency modulation.
RESULTS
Spike sequences of 125 neurons from five neuronal groups were analyzed for the presence of H3-patterns: 1) 24 pyramidal tract projecting neurons from motor cortex of the cat, 2) 38 neurons from parietal cortex area 5 of the cat, 3) 21 neurons from cat ventrolateral thalamus, 4) 21 neurons from cat respiratory medulla, 5) 18 putative interneurons and 4 descending efferent neurons of layer V from motor cortex of the rabbit.
H3-patterns
Figure 2A shows an H3-pattern detected in the spike train of a neuron which was recorded in cat motor cortex, MC01. It consisted of a triad of IEIs (the four events of the triad are designated by bold vertical lines below the spikes) and a preceding the triad qualifying PPTI. The duration of ISIs in the triad from left to right was: 55.04, 53.94, and 54.30 ms, with the shortest ISI differing by 2% from the longest one. The avIEI of this triad is 54.43 ms. The duration of the IEI that preceded the triad was 109.61 ms, which differed from the 2x avIEIs by 0.7%, thus it represented a qualifying PPTI. Figure 2B shows an H3-pattern in the activity of a neuron from cat ventrolateral thalamus. The #3 event of the triad was a doublet of spikes with ISI <3 ms.
The top left graph of Figure 3 shows distribution of all triads of the 14 H3-patterns found in the activity of the neuron MC01. The avIEIs of all but two triads were in the range of 10–20 ms. In three bins (denoted by small asterisks), the number of H3-patterns exceeded the theoretical estimate for these bins (P<0.05). The remaining fragments of Figure 3 present distributions of avIEIs in the triads of H3-patterns for each of the rest of 23 neurons from the cat motor cortex. In all of the neurons a number of H3-patterns was found. The avIEIs of the triads of these H3-patterns ranged from 10 to 65 ms, with avIEIs in the range of 10–40 ms occurring more often than the longer avIEIs. In all but one neuron there was at least one bin in which the number of H3-patterns exceeded (P<0.05) the theoretical estimate for that bin (denoted by small asterisks). Similar data were obtained for the other four neuronal populations.
Figure 3.

Distribution of avIEIs in triads of H3-patterns in all tested neurons from cat motor cortex. Solid lines show theoretical estimates of the number of H3-patterns in each spike train. Small asterisks denote bins for which the number of H3-patterns exceeded the theoretical estimate. The cell ID is indicated in the top right corner of each panel. Large asterisks denote neurons with H3-patterns of a non-trivial origin.
The average ( ± SD) values of the H3-factor, Hf, in different neuronal populations were: 0.98 (0.56) in the cat motor cortex, 0.74 (0.47) in the rabbit motor cortex, 1.01 (0.68) in cat parietal cortex, 0.92 (0.43) in cat ventrolateral thalamus, and 4.11 (3.25) in cat respiratory medulla. The different neuronal groups did not vary significantly, except for cat respiratory medulla, in which Hf was significantly larger then in any other group (P <0.03, Kolmogorov-Smirnov test). Inside the H3-patterns, sequential IEIs of the triads did not show any regular change of values in any of the neurons.
Table 1 characterizes G-vectors for all spike trains in each of the five neuronal groups. With a six-component vector, each component could have one of three values: −1, 0, and 1 (detailed in Appendix 2), thus, a total of 36=729 individual G-vectors were theoretically possible. However, from Table 1 one can see that all 125 analyzed spike trains were in fact represented by only 18 template vectors. The template vector G0, all components of which was equal zero, represented 51 (41%) of all spike trains. Thus, these spike trains did not have any excess of H3-patterns over the number that could be expected according to the random occurrence hypothesis. The quote of such spike trains was the largest in the parietal cortex group (71%) and the smallest in the respiratory medulla group (5%). For the rest of the groups, this quote did not substantially differ: cat motor cortex (26%), rabbit cortex (41%), and ventrolateral thalamus (38%). The template vector Gm represented 7 spike trains from respiratory medulla, which means that H3-patterns in the activity of these neurons (6 % of all spike trains, and 33% of respiratory medulla spike trains) could be attributed to the slow modulation. The remaining 16 templates vectors represented the rest 67 (54%) spike trains. According to our criteria (see Methods), these spike trains had H3-patterns of a not trivial origin.
Table 1.
Characterization of G-vectors for all impulse sequences
| ID | G1 | G2 | G3 | G4 | G5 | G6 | ρ | MC | PC | VL | RM | RC | Total |
|---|---|---|---|---|---|---|---|---|---|---|---|---|---|
| G 0 | 0 | 0 | 0 | 0 | 0 | 0 | 0, 4 | 6 | 27 | 8 | 1 | 9 | 51 |
| I | 1 | 0 | 0 | 0 | 0 | 0 | 1, 3 | 13 | 7 | 10 | 6 | 10 | 46 |
| II | 1 | 0 | 0 | 0 | −1 | 0 | 2, 4 | 0 | 0 | 1 | 0 | 0 | 1 |
| III | 1 | 0 | 0 | −1 | 0 | 0 | 2, 2 | 1 | 0 | 0 | 1 | 0 | 2 |
| IV | 1 | 0 | −1 | 0 | 0 | 0 | 2, 2 | 0 | 0 | 0 | 1 | 0 | 1 |
| V | 1 | −1 | 0 | 0 | 0 | 0 | 2, 4 | 0 | 1 | 0 | 0 | 0 | 1 |
| VI | 1 | 1 | 0 | 0 | 0 | 0 | 2, 4 | 0 | 0 | 2 | 0 | 0 | 2 |
| VII | 1 | 1 | 0 | 0 | 0 | 1 | 3, 5 | 0 | 2 | 0 | 0 | 0 | 2 |
| VIII | 1 | 0 | 1 | 0 | 0 | 0 | 2, 4 | 1 | 0 | 0 | 0 | 1 | 2 |
| IX | 1 | −1 | 1 | 0 | 0 | 0 | 3, 5 | 0 | 0 | 0 | 1 | 0 | 1 |
| X | 0 | 0 | 0 | 1 | −1 | 0 | 2, 6 | 0 | 0 | 0 | 0 | 1 | 1 |
| XI | 0 | 0 | 0 | 1 | 0 | 0 | 1, 5 | 1 | 1 | 0 | 0 | 0 | 2 |
| XII | 1 | 0 | 0 | 1 | 1 | 1 | 4, 4 | 0 | 0 | 0 | 1 | 0 | 1 |
| XIII | 1 | 0 | 0 | 0 | 1 | 0 | 2, 2 | 0 | 0 | 0 | 0 | 1 | 1 |
| XIV | 0 | 0 | 0 | 0 | 1 | 0 | 1, 3 | 1 | 0 | 0 | 0 | 0 | 1 |
| XV | 1 | 0 | 0 | 0 | 1 | 1 | 3, 3 | 0 | 0 | 0 | 1 | 0 | 1 |
| XVI | 1 | 0 | 0 | 0 | 1 | 0 | 2, 2 | 0 | 0 | 0 | 2 | 0 | 2 |
| G m | 1 | 0 | −1 | −1 | 1 | 0 | 4, 0 | 0 | 0 | 0 | 7 | 0 | 7 |
| n/t | - | - | - | - | - | - | - | 17 | 11 | 13 | 13 | 13 | 67 |
| Total | - | - | - | - | - | - | - | 23 | 38 | 21 | 21 | 22 | 125 |
The first column shows the template vector’s ID. Besides G0 and Gm (see Methods), the vector names, designated by roman numerals, are arbitrary. Columns G1 – G6 – specify each of the six components of the template vectors. ρ –distances from the current template vector to the vectors G0 and Gm, respectively, divided by comma. Next five columns show how many neurons in a given group represent the vector, which components are specified in the current line. Last column summarizes these numbers for all cell groups. Line “n/t” shows number of impulse sequences, which properties can not be attributed to the trivial causes. Line “Total” summarizes the number of neurons in a given column and in all columns.
Most of the spike trains with non-trivial H3-patterns (46/67 or 69%) were characterized by the template vector I that indicated a significantly larger than expected number of precise triads in a spike train (G1=1) but had all other components equal to zero. Thus, the H3-patterns in these spike trains were predominantly isolated triads with no doublets of spikes and no surrounding additional rhythmical activity. Four more template vectors II–V which represented four spike trains also did not show an excess of spike doublets or qualifying PPTIs in addition to precise triads, on the contrary, values of their correspondent components (Gi = −1) pointed to lower than expected values of these numbers. Thus, the precise triads in these spike trains were even more “isolated” as compared to those, which spike trains were characterized by the template vector I. The lower two lines in the Table 1 summarize all features of all spike trains.
Figure 4 shows, for each of the five neuronal groups, distribution of all avIEIs of triads in H3-patterns of the spike trains that had non-trivial H3-patterns (regardless of the behavior). The expected number of H3-patterns in each bin was estimated as an average number of H3-patterns in three randomly permuted sets of ISIs of each of the spike trains. The bins in which the number of H3-patterns exceeded the expected values were blackened (P<0.05). One can see that in all neuronal groups the number of H3-patterns exceeded theoretical estimates in 12, 13, and 14 ms bins. That was also true for the 15–17 ms bins for all the neuronal groups except for the cat parietal cortex group. In all neuronal groups there were also many other bins, in which the number of observed H3-patterns exceeded theoretical estimates. Particularly, in the cat respiratory medulla group all bins in the range from 12 to 38 ms had a number of H3-patterns that was greater than the theoretical estimate.
Figure 4.

Distribution of avIEIs in triads of the H3-patterns in the spike trains with nontrivial H3-patterns. A: cat motor cortex (MC), B: rabbit motor cortex (RC), C: cat parietal cortex (PC), D: cat thalamus (VL), E: cat respiratory medulla (RM). The bins in which the number of H3-patters exceeded the theoretical estimate are blackened.
Double-return plots of IEIs
To additionally validate our conclusions regarding the statistical significance of the data, we used the 3-d double return plot analysis (detailed in the Appendix 6). In this method, IEIs are plotted in a 3-d space with coordinates (TN, TN−1, TN−2), were TN is the duration of the N-th IEI. Then a hypothesis that the precise triads of IEIs had occurred in a given region of the 3-d space by chance is evaluated. Figure 5A shows a 3-d double return plot of the activity of a neuron from cat motor cortex. This plot encompasses a cubic region 12x12x12 (ms) in a 3-d space that starts at the point (33, 33, 33) (ms). Each sphere represents three successive IEIs of the spike train of this neuron (this limited region of the 3-d space contains n=23 triples from the total number of 6233 triples for this neuron). The cylinder around the diagonal highlights the precise triads (n=4, shown here as empty spheres). The radius of the cylinder is R(T) = 0.45·p·T and the height is (T1-T0), where T is a current value of the interval, p is a parameter of the triad-searching algorithm (p=0.05, see Appendices 1, 6), and T0 and T1 are the starting and ending points of the cylinder. In this neuron, the probability to have 4 (or more) precise triads in this region was P<0.006. Thus, the null hypothesis that the distribution of the spheres in the cube was homogeneous was rejected, as the observed number of the precise triads could not be explained by random occurrences. This analysis was performed for 10 selected neurons (two more examples are shown in Fig. 5 B, C). Five neurons were randomly chosen from those, which did have the H3-patterns of a non-trivial origin, and five from those, which did not. In all cases, the probability of a random encountering of the precise triads was significantly small (at least, P<0.05) in all cases, in which we have revealed the non-random precise triads by other methods.
Figure 5.
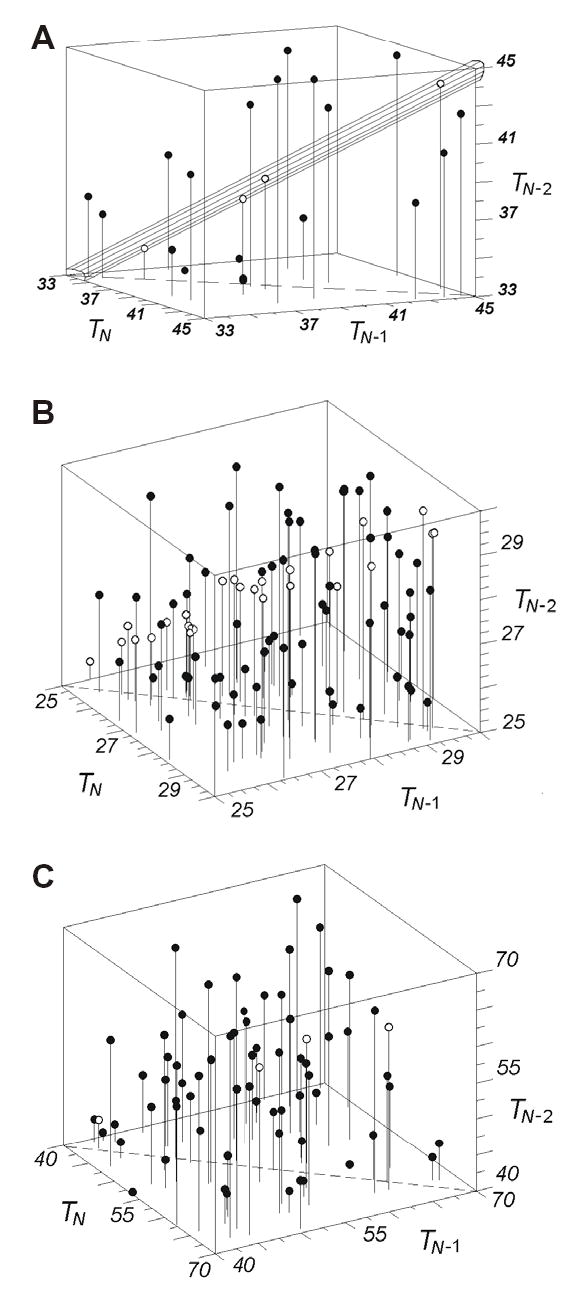
3-d double return plots of the activity of three representative neurons. A: IEIs in neuron CMC12 (n=23, n1=4; P<0.006), B: IEIs in neuron CMD10 (n=87, n1=26; P<10−7), C: IEIs in neuron RMC10 (n=74. n1=4; P<0.007). In A – C, n is the total number of spheres, captured in the sub-region of the 3-d space and n1 is the number of the precise triads in this region. The interrupted line at the bottom shows the line, where TN = TN−1. From all points lines are dropped to the plane (TN, TN−1). In A, the diagonal cylinder highlights the precise triads (empty spheres).
Behavior-related activity of the neurons
The neurons, whose spike trains we have analyzed for the presence of H3-patterns of a non-trivial origin, were involved in a periodic activity, either locomotion or respiration. The relation of spike activity of these neuronal populations to locomotion and respiration we have described in a series of separate reports: [6] - cat ventrolateral thalamus; [7] - cat parietal cortex; [9, 60] - cat motor cortex; [8] - rabbit motor cortex; [49, 50] - cat respiratory medulla. The database for this study was a subset from the databases used for the above published studies. In all cases, the neuronal recordings were stable and there was no change in the amplitude of the spikes that could be associated with the phases of stepping or respiration. Thus, we believe that the behavior phase-depended changes in the neuronal activity was a natural phenomenon not caused by mechanical disturbances from recording equipment. The databases for this study were characterized as follows.
Cat motor cortex
During standing, the mean activity of neurons in the cat motor cortex was 15.9 ± 7.8 imp/s (mean ± SD), it was 22.6 ± 10.4 imp/s during simple and 29.8 ± 16.0 imp/s during complex locomotion. During locomotion, the discharge of all the neurons but one was modulated in the rhythm of steps that is the activity of them was higher in one phase of the step cycle and lower in the other phase. An example of such dependence of the activity of a neuron on the phases of locomotion cycle is presented in Fig. 1D. The mean coefficient of frequency modulation (defined as M= (1 − Fmin/Fmax) x 100%, where Fmin and Fmax are the minimal and the maximal frequencies of the discharge in the 10 bin normalized histogram [8, 10] was 74 ± 18% during simple and 73 ± 20% during complex locomotion. The preferred phase of 70% of the neurons was at the end of stance or the beginning of swing phase during both simple and complex locomotion.
Rabbit motor cortex
During standing, efferent neurons and interneurons from the motor cortex of the rabbit had mean activities of 12.1 ± 6.4 and 23.2 ± 14.1 imp/s, respectively. During simple locomotion, these values were 9.3 ± 3.8 and 46.2 ± 20.3 imp/s, respectively, and they were 10.2 ± 6.4 and 46.4 ± 20.5 imp/s during complex locomotion. The activity of all efferent neurons and of 76% interneurons was modulated in relation to the step cycle. The coefficient of frequency modulation, M, during simple locomotion was 48 ± 5% in the efferent neurons, and it was 57 ± 18% in the interneurons. During complex locomotion the values of M were 59 ± 14% and 56 ± 20%, respectively. The preferred phase of 82% of the neurons during simple locomotion was in the stance phase. During complex locomotion there was an equal distribution of the preferred phases across the cycle.
Cat parietal cortex
During standing the mean activity of the neurons from cat parietal cortex was 13.8 ± 9.1 imp/s. It was 22.6 ± 25.9 imp/s during simple and 27.2 ± 25.9 imp/s during complex locomotion. The activity of 44% of the neurons was modulated in the stepping rhythm during simple locomotion, while 90% of the neurons was involved in the step-related activity during complex locomotion. Among modulated neurons, the M was 72±24% during simple and 73±16% during complex locomotion. During simple locomotion, three patterns of modulation were observed in approximately equal proportions: about 1/3 of the neurons had one peak of activity during the cycle, 1/3 had one trough, and 1/3 had two peaks. During complex locomotion, 85% of the neurons discharged two bursts per cycle. The preferred phases of activity were distributed approximately equally across the cycle during both simple and complex locomotion.
Cat ventrolateral thalamus
During standing, the mean activity of the neurons from ventrolateral thalamus was 26.6 ± 17.3 imp/s. It was 28.8 ± 15.3 imp/s during simple and 28.5 ± 16.7 during complex locomotion. The discharge of 83% of the neurons was modulated to the rhythm of steps during simple locomotion, and the activity of all the neurons was step-related during complex locomotion. During simple locomotion M=79 ± 14%, and during complex locomotion M=75 ± 16%. The preferred phase of 70% of them was at the end of swing or the beginning of stance phase during both locomotion behaviors.
Cat respiratory medulla
The mean activity of the neurons from respiratory medulla was 10.8 ± 9.7 imp/s. The discharge of all the neurons was modulated to the rhythm of respiration. The measure of neuron involvement in respiration, η2 [49], was in the range 0.5–0.9, for all neurons, except RM11 (η2 = 0.12). The preferred phase of 67% of them was in the inspiratory phase of the cycle.
Relation of H3-patterns to locomotion and respiration
For a number of spike trains with non-trivial H3-patterns, there was a relationship between specific behavior and H3-patterns occurrence. Figure 6A shows the percentages of neurons in different neuronal groups whose H3-patterns preferentially occurred during standing or during locomotion (as accessed by the binomial distribution test, P>0.95). In all neuronal groups, except for the rabbit motor cortex (RC), there was a number of neurons (ranging from 8 to 47%) whose H3-patterns occurred preferentially during one behavior or another. In all neuronal populations there were more neurons exhibiting H3-patterns preferentially during locomotion and fewer of those whose H3-patterns occurred mostly during standing.
Figure 6.

Relation of H3-patterns to locomotion and respiration behaviors. A: Percentage of neurons that exhibit H3-patterns preferentially during standing (gray) or locomotion (black). MC - cat motor cortex; RC - rabbit motor cortex PC) - cat parietal cortex; VL - cat thalamus; RM - cat respiratory medulla. B: Percentage of neurons with H3-patterns occurring preferentially during simple locomotion on the flat surface (gray) or during complex locomotion on the horizontal ladder (cats), during overstepping series of barriers (rabbits), and on turns (black). In A, B the statistical significance of the preference was accessed by the binomial distribution test, level of significance P>0.95. C: A fragment of a breathing sequence (the time course of respiration frequency, the upper trace) is presented along with the sequence of H3-patterns found in the activity of a respiratory medulla neuron (RM03, the lower trace). Arrows point from respiratory disturbances (peaks on the respiration frequency curve) to gaps in the H3-patterns occurrences (underlined).
During locomotion, there was a relationship between specific locomotion behavior and H3-patterns occurrence found in all the neuronal groups. Figure 6B shows the percentages of neurons in different neuronal groups with H3-patterns occurring preferentially during simple locomotion on the flat surface or during complex locomotion, such as locomotion on the horizontal ladder (cats), with overstepping of series of barriers (rabbits), and on turns. Here again the statistical significance of this preference was determined using the binomial distribution test with the level of significance set at P>0.95. In all neuronal groups, there was a number of neurons (ranging from 20 to 42%) whose H3-patterns occurred preferentially during simple or complex locomotion behavior. In all neuronal populations, except for the rabbit motor cortex group, all neurons with a locomotion-type preference exhibited H3-patterns preferentially during complex locomotion.
Similar to locomotion, the occurrence of H3-patterns during respiration could be dependent on the mode of respiration. Figure 6C shows such an example. Here the time course of the respiration frequency is presented along with the sequence of H3-patterns found in the activity of a respiratory medulla neuron. One can see that after most of the episodes of respiratory rhythm disturbance (peaks on the upper curve) there were periods of a decreased H3-patterns frequency (indicated by arrows that point from a rhythm disturbance to a gap in the H3-patterns occurrence). In total, the H3-patterns of 33% of the spike trains inspected during respiration showed a dependence on the mode of respiration.
The activity of the great majority of the neurons taken for this study was related to locomotion (cortical and thalamic neurons) or respiration (respiratory medulla) rhythms, that is, it was higher in one phase of the cycle and lower in the other phase. If H3-patterns were due to a random combination of impulses, one can expect that the number of H3-patterns in a given phase of a cycle will be linearly proportional to the number of spikes in this phase. Figure 7A shows, in a raster format, the simple spike activity (small dots) of a motor cortex neuron along with H3-patterns occurrences (diamonds) that were observed during 70 steps. One can see that although the neuron was as intensively active during the beginning of swing as it was during end of stance, all H3-patterns occurred during stance phase. Thus, the occurrences of the H3-patterns in the activity of this neuron were clearly step-related and were not simply increasing their frequency with the rise of the activity of the neuron.
Figure 7.
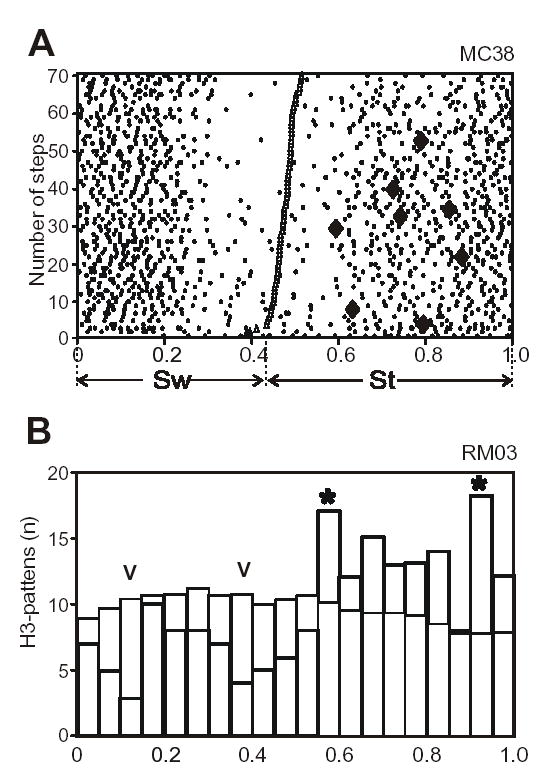
Relation of H3-patterns to locomotion and respiration cycles. A: A raster of activity of a neuron from the cat motor cortex (MC38) during locomotion on the flat surface. Swing (SW) is separated from stance (St) by triangles. The raster is rank-ordered according to the duration of the swing phase. Simple spikes are presented as small dots, the H3-patterns – as large diamonds. B: Distribution of expected (thin lines) and actual numbers (thick lines) of H3-patterns over respiratory cycle in neuron RM05 (15867 interspike intervals, 316 breaths, 117 H3-patterns). Zero phase corresponds to transition from expiration to inspiration. Asterisks denote bins in that the number of H3-patterns exceeded (P<0.05, Kolmogorov-Smirnov test) the theoretical estimate, while symbols “v” indicate those where the number of H3-patterns was less then expected (P<0.05).
To evaluate whether the fluctuation of the number of H3-patterns over the cycle was merely due to the discharge frequency fluctuations, we used Kolmogorov-Smirnov test. Thus, we determined the similarity between the actual H3-patterns distribution and the distribution that could be expected on the base of the hypothesis that the number of H3-patterns is linearly proportional to the number of spikes. Figure 7B shows distributions over the respiration cycle of the number of actual (thick lines) and expected (thin lines) H3-patterns for the respiratory medulla neuron RM05. In two bins (denoted by asterisks) the number of H3-patterns exceeded (P<0.05) the theoretical estimate, and two bins (denoted by the symbol “v”) the number of H3-patterns was less then expected (P<0.05).
In each of the neuronal groups studied, spike trains were found whose H3-patterns, in excess of the theoretical estimate, depended on the behavioral cycle phase. The percentage of such spike trains was 33% (in 6 out of 17 spike trains with non-trivial H3-patterns) in the cat motor cortex, 13% (2/15) in the rabbit motor cortex, 25% (3/12) in the cat parietal cortex, 42% (5/12) in the cat ventrolateral thalamus, and 29% (6/21) in the cat respiratory medulla.
DISCUSSION
In this study, algorithmically defined patterns of precisely regular patterns (H3-patterns) were found and characterized in the activity of neurons from a variety of brain structures in behaving cats and rabbits. Methods have been developed to identify and eliminate the H3-patterns that could be attributed to the “trivial” factors, such as random fluctuations of inter-spike intervals or a slow modulation of an input to a neuron. To the best of our knowledge, this is the first example, where algorithmically defined discharge patterns have been revealed in neuronal spike trains. The main distinction of our approach from correlational methods, which were intensively used before [e.g. 38, 39, 40, 53] is in the individual detection and characterization of each episode of periodic rhythmicity in the neuronal spike trains. In particular, our method detects rhythmicity even in cases, where each episode of rhythmicity has its unique basic frequency. This feature of the method helps to describe the whole spectrum of the rhythmic frequencies, which are present in the activity of a given neuron (Fig. 3), or a given neuron group (Fig. 4). The same feature enabled us to identify the exact times of occurrences of the rhythmic episodes (Figs. 6 and 7), which can be useful in attempts to identify the role of rhythmicity. Superficially, our method seems much like the diverse “template-matching” methods for identification of the precise neuronal discharges [1, 2, 13, 15, 36, 42, 43]. However, the only common property that it shares with these methods is the individualized approach to analysis of single occurrences of specific discharge patterns. In contrast to these methods, our method does not use templates fixed in time domain to match any current timing of spikes. The method that we have developed for H3-patterns can be generalized to other types of algorithmically defined discharge patterns. We believe that the proposed approach adds to the existing methods of the analysis of neuronal precise firing patterns.
In the present study a search for algorithmically defined discharge patterns was used to assess the activity of neurons from a variety of brain structures in behaving cats and rabbits. We found that, in the activity of a majority of the neurons, the number of H3-patterns exceeded the number that could be expected to occur by chance, and they were not caused by a slow modulation. Thus, these precisely regular discharge patterns, the H3-patterns, present a new formerly un-explored phenomenon in neuronal activity that is independent of its other characteristics. In the activity of cortical and thalamic neurons, the H3-patterns occurred with an average rate of one per 1000 of spikes, and as many as 4.6 per 1000 spikes in the activity of respiratory medulla neurons. The inter-event intervals (inter-spikes or inter-doublets-of-spikes intervals) of H3-patterns were diverse in all of the neurons, mainly falling in the range of 10–40 ms, that is 25–100 Hz.
In the activity of many neurons H3-patterns were correlated with a specific locomotion or respiration behavior: they occurred preferentially during complex locomotion when visuo-motor coordination of stepping was required and paused after disturbances in respiration (Fig. 6). This suggests that H3-patterns may encode specific features of a behavior. Compatible with this view, is also the finding that in some neurons H3-patterns were locomotion or respiration phase-dependent (Fig. 7), and the analysis showed that this dependence was not imposed by cyclic modulation of impulse frequency.
What is the possible origin of the observed precisely regular discharge patterns? A recent modeling study by Hopfield and Brody [32, 33] suggested a mechanism for generating short periods of precisely rhythmic discharges from non-rhythmic responses of neurons. Indeed, if many neurons respond to a stimulus with steadily decaying discharge frequencies, at some point in time, the frequencies of some of them may become very close to each other or even equal. If these neurons with nearly equal discharge frequencies are synaptically connected, their discharges may become synchronized [18, 19, 64, 70]. If the neurons, which from time to time become synchronously active, also have a mutual synaptic target, then the periods of their synchronous activity can be easily detected by this target. It was shown that the likelihood of the postsynaptic spike generation increases if two spikes from different sources arrive to a neuron simultaneously or within ~7 ms [72]. Thus, during these short periods when the pre-synaptic neurons fire at a very similar rates (with a precision of a few milliseconds), the postsynaptic neuron might be prone to discharge periodically at the peaks of the cumulative EPSPs, that is at the mean frequency of the pre-synaptic discharges. Consistent with this hypothesis is the finding of H3-patterns in the activity of neurons of all groups with “omissions” of spikes (PPTIs = 2 * avIEIs) and doublets of spikes instead of single impulses (Table 1). These features can be easily explained assuming periodic waves at the input, at the verge of which neurons discharge, do not discharge, or generate a doublet of spikes. Consistent with this view is also our finding of a wide and continuous range of the inter-event intervals in the H3-patterns of individual neurons (e.g. Fig. 3). This suggests that the H3-patterns were not due to an intrinsic resonance property of single neurons or fixed neuronal networks, but rather depended on a variable neuronal ensemble, in which the neurons were involved at each particular time.
Encoding information by synchronizing activity of the neurons was suggested by von der Malsburg in 1981 [75], and has been since studied both theoretically and experimentally. In this view frame, synchronously active neurons are believed to signal about features of the same object (thus perceived simultaneously) [27, 59], or to control the same motor act [37]. Despite possible criticisms [58], synchronous firing still might be the mechanism for “binding” perceptions coming from a singe object and for forming motor “synergies” for movements. If this indeed is the case, then the precisely rhythmical discharge patterns, such as H3-patterns, would be detectors of synchronous activity or the “binding” elements.
A most plausible alternative hypothesis would be that the cell’s endogenous property to discharge at a constant interspike interval caused the occurrences of H3-patterns. This hypothesis, however, is less easily reconcilable with our data. At least two features of the H3-patterns are not commonly found in the endogenously active cells. First, in each of the spike sequences examined, a very wide range of possible periodicity was found, with the discharges in each 1 ms window typically constituting only about 10% of all neuron’s rhythmic H3-type discharges (Fig. 3). That is, no neurons had a truly preferred discharge rhythm. Second, the sequential inter-event intervals in individual H3-patterns did not show any consistent trends of interval change, thereby standing apart from the sequences described as “bursts” which bear various characteristic discharge frequency changes over time.
The respiratory medulla neurons showed the largest counts of H3-patterns. This could be associated with their involvement in a high frequency oscillation (HFO) network that was suggested to operate in the respiratory medulla [26, 34, 35, 47].
Two explanations can be proposed for the intuitively perceived “infrequency” of H3-patterns in the discharges of the neurons. First, one can argue that the number of H3-patterns was small because the criterion for the precision of the regularity was excessively high (5%). This criterion was set conservatively according to the time frame in which it was shown that two excitatory inputs facilitate each other (~7 ms) in the projection from visual thalamus to visual cortex [72]. Unfortunately, there is no corresponding data available for the neuronal population that we have studied. Their properties may be different, thus the 5% criterion may be indeed too strict for them. Second, one can argue that even intuitively “infrequent” events do have a physiological effect. Indeed, the frequency of H3-patterns in relation to a behavior is in the range of the rare single spike activity of many neuronal subpopulations, including numerous cortico-cortical, cortico-thalamic, and cortico-striatal projecting populations in mammals [8, 9, 10, 56, 60, 66, 67, 68, 71], as well as a group of neurons that connect two song-production nuclei in song birds [30]. Although in most of these cases the functional role of such sparse firing is yet to be determined, it seems to be computationally efficient in visual processing [73] and in songs learning in songbirds [24].
Acknowledgments
The authors are grateful to Dr. Harvey Swadlow for valuable comments on the manuscript. This work was supported by grants from NIH F32 NS-10314 and R01 NS-39340 to INB, NIH R01 HL21257 and NS46062 as part of the NSF/NIH CRCNS Program to JMO, and HL62589 to EHV.
APPENDIX
A1. Procedures for the analysis of a spike train for the presence of H3-patterns
Transformation of a spike train into a sequence of events (E)
The inter-spike intervals of a spike train were looked at sequentially. If the current interval was less than 3 ms, then the moment of generation of the impulse, that opened the interval was referred to as a moment of E and the interval to the next E was then obtained as a sum of a current inter-spike interval and the next inter-spike interval. Doublets only were accounted for in this manner. Thus, if a series of inter-spike intervals contained not only doublets, but also triplets, quadruplets, etc. of intervals <3 ms, then after transformation of a sequence of spikes into a sequence of E the latter contained inter-event intervals (IEI) shorter than 3 ms. Because IEIs <3 ms were very rare, no efforts were made to exclude them.
Determination of a precise triad in the sequence of events
A current IEI was compared to the previous IEI. If they were equal with a precision of 10% of the duration of a current IEI, an occurrence of a precise triad was suspected. To find out if this was the case, the next IEI was compared to the current one, and if it also was within 10% of the duration of the current IEI, then the difference between the minimal and the maximal IEIs within the triad was calculated. If that difference was still less than 10% of the minimal of the IEIs in the triad, then the quadruplet of Es, starting with the E that opened the first IEI of the triad was declared to be a candidate for a precise triad. For each candidate triad the minimum and the maximum IEIs, Tmin and Tmax were found. In case when (Tmax − Tmin) / Tmin) < 0.05, the sequence was considered to be a precise triad.
Determination of PPTIs and a H3-pattern
The IEIs preceding and following the IEIs of the precise triad were compared to x1/2, x1 and x2 values of the avIEI of the triad. If their value differ not more then 10% of the avIEI, they were considered to be qualifying PPTIs, and the whole pattern was declared to be an H3-pattern. If no qualifying PPTIs were found, the precise triad itself was declared to be a H3-pattern.
A2. Evaluation of the significance of the data
The central question of the spike trains analysis for a presence of specific patterns, including H3-patterns, is whether these patterns can be explained by trivial reasons. In order to answer this question, we considered the probabilistic null-hypothesis stated as follows. The quantitative characteristics that characterize H3-patterns in a spike train can be explained by statistical variations of properties of interspike intervals in random reshuffling of the original spike train. As the reshuffled sequence consists of the same intervals as the original one, the distribution of interspike intervals in it and in the original spike train are identical. However, the interspike intervals in the reshuffled sequence are independent from each other. We have used the reshuffled sequence to estimate the probabilities of g1,..., g6 parameters of the spike train. For g1,..., g5, we have used analytical or semi-analytical calculations, based on the reshuffling hypothesis (see below). To estimate g6, for each spike train, we have obtained three randomly reordered sequences, and have calculated the mean value of this parameter. We have named these estimates the “theoretical” values of the parameters. For verifying the correctness of our estimates of the probabilities of numerical parameter values, for a part of the data we have performed an extensive Monte Carlo study of the properties of reshuffled impulse sequences. For this purpose, for each of 15 spike trains from rabbit motor cortex that showed non-trivial H3-patterns, we have made 1000 random reshuffling. In each reshuffled sequence we have then detected the H3-patterns and constructed empirical distribution functions for each of the parameters g1, ..., g6. For 13 out of 15 neurons the statistical conclusion based on our semi-analytical probability estimates was confirmed with the Monte Carlo method.
The probability that a specific value of a parameter gi (i = 1, ..., 6) might be observed under the null-hypothesis was estimated based on an assumption that the number of real occurrence of particular events obey Poisson distribution with the λ-parameter that is equal to the “theoretical” estimate of the value of the parameter gi. The validity of the Poisson distribution based estimation of the null-hypothesis probabilities in our case was verified as follows. For the three random reshuffles of each of 21 respiratory medullary neurons spike trains, we have calculated how often the observed values of five of the parameters (g1,..., g5) exceed the Poisson distribution based confidence level of 0.05. In so obtained 21x3x5=315 comparisons of the “theoretical” and the “experimental” values, we found 14 cases where “experimental” values exceeded “theoretical” ones with P<0.05. This was in a good correspondence with the Poisson hypothesis, as 315*0.05=15.75.
It is worth noting, that there exist three distinct statistical objects that are connected with the name of S.-D. Poisson (1781–1840) (rev. in Dayan and Abbott, 2001). (1) The best known is the Poisson distribution, a distribution law that describes rare events. This is the only Poisson-related object that we use in this paper. Its application was detailed in the previous paragraph. (2) The second Poisson-related object is the Poisson point process defined as the “absolutely random” sequence of impulses with a fixed average frequency. In early studies of spike trains, the Poisson point process was often used as a null-hypothesis for different analyses, but later was found unsatisfactory (Oram et al., 1999). In this study, we do not use Poisson point process. Our null-hypotheses are always the original, randomly reshuffled sequence of interspike intervals. This reshuffling corresponds to a different mathematical notion - the renewal process. (3) The third Poisson-related object is the exponential distribution of the interspike intervals in the Poisson point process. We do not base any portion of our analysis on this distribution.
“Theoretical” estimate of the number of precise triads in a spike train, g1
For the purpose of “theoretical” estimate of g1, we have used the empirical frequency of specific IEIs as a function of the IEIs duration, f(τ). For its calculation, the whole range of IEI was divided into sequential segments of increasing duration so that the sequential segments (“boxes”) duration Di and Di+1 followed the equation: Di+1 = Di · (1+0.05), and D0=3.0 ms. Then we calculated frequencies of interval occurrence for each box. Considering these values to be probabilities of occurrences of intervals within a box, we took their cubes as probabilities of occurrences of precise triads within the corresponding box. The product of these probabilities to the number of intervals yielded an estimate of a “theoretical” number of precise triads within the box. Dividing these numbers over the box length we obtained estimates of the density of the number of triads as a function of the triad duration. The expected number of triads in the interval of triad’s duration [T1, T2] was obtained as an integral of the density of precise triads over the interval [T1, T2]:
| (2) |
In this expression, γ is a normalization factor. Its value is difficult to calculate by pure analytical means. So, the γ value was chosen to make the average “theoretical number” of precise triads in the interval [10 ms, 70 ms] for neurons in cat motor cortex equal to the average number of precise triads found by our algorithm for the three random reshuffles of IEIs for each of these impulse sequences. We thus obtained γ =2.74. Using this value, we have calculated the values for “theoretical estimates” of the number of precise triads for all other neuronal types (Table 2). For comparison, “experimental” values of g1 for precise triads that were found using our algorithm for H3 pattern identification for the three random reshuffles of the original sequences are also given in Table 2. There was good matching between the theoretical and experimental values for the rest of neuronal groups supporting the validity of the adopted approach for obtaining theoretical estimates of the number of precise triads under the null hypothesis. In order to obtain the expected number of precise triads in 1 ms duration bins for the comparison with the empirical values in the distribution histograms of the precise triad’s IEIs, we have used the expression (2) for each histogram bin.
Table 2.
“Theoretical” and “experimental” estimates of the average number of precise triads in randomly reshuffled sequences of neuron spikes by neuronal group.
| Neuronal Group | “Theoretical” value | Experimental value |
|---|---|---|
| MC | 7.3 | 7.3* |
| RC | 13.9 | 14.6 |
| PC | 5.1 | 5.4 |
| VL | 21.9 | 22.9 |
| RM | 21.8 | 21.3 |
Neurons of the cat motor cortex were used to obtain the value of the proportionality coefficient, γ=2.74, therefore the theoretical and experimental data for these neurons are precisely same. MC - cat motor cortex, RC - rabbit motor cortex, PC - cat parietal cortex ; VL - cat thalamus, RM - cat respiratory medulla.
“Theoretical” estimate of the number of pairs of spikes with ISI <3 ms (doublets) among the four events of each triad, g2
First, the empirical probability of the event to be a doublet was determined as a ratio of the number of doublets in a given set of events to the number of events in this set. The “theoretical” estimate of the number of doublets was calculated as a four-fold number of the precise triads in this sequence multiplied by the empirical probability of a doublet.
“Theoretical” estimates of the numbers of qualifying PPTIs, g3, g4, g5
These numbers were calculated by counting for each precise triad the numbers of intervals that fell within the limits [0.9 Tab, 1.1 Tab], where Tab was 2.0*avIEI, 0.5*avIEI, or avIEI. This count was further multiplied by 2 to account for the number of PPTIs preceding and following each precise triad, divided by the number of IEIs in the sequence and summed for all the precise triads. These sums were considered to be the “theoretical” null hypothesis based estimates of the parameters g3, g4, and g5.
“Theoretical” estimate of g6 value
The number of combinations was determined for the three random permutations of the original order of IEIs in the spike train. The obtained number was then adjusted by the ratio of the precise triads in the original spike train and in a given permutation. An average of the latter three values was taken as the theoretical estimate of g6 value.
Using parameters gi, each spike train was characterized by a six-dimensional vector (G1, ..., G6), namely, the G-vector. The components of the G-vector could have one of the three values: “+1”, “0”, and “−1” and were defined as follows:
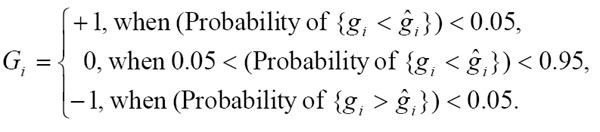
The calculated expected values of the parameters gi, i = 1, ..., 6 are here denoted as . A component #i had a value ”+1” if the real value of a parameter gi at this position exceeded (P>0.95) its expected “theoretical” value. A component had a value “−1” if the opposite inequality was significant, and “0” if the difference between “theoretical” and observed values of the parameter gi was not significant. Thus, if the occurrence of all H3-patterns in a spike train could be explained by a random chance, then all the components of its G-vector will be zeros.
A3. Applicability of the statistical tests to non-stationary data
For the estimation of the statistical significance of revealed phenomena, we have compared for each spike train the obtained number of H3-patterns with the number that could be obtained using the same procedures from a randomly reshuffled sequence. However, the validity of application of this procedure to non-stationary impulse sequences such as neuronal discharges that vary according to periodic behavioral events was not clear. In order to validate the method, we have performed a data separation test. It is illustrated below for the neuron from respiratory medulla RM05.
The spike train of neuron RM05 consisted of 22449 interspike intervals. We have divided them into three sequential portions, containing 8000, 8000, and 6449 intervals each. We have calculated the g1,..., g6 parameters for each part of the spike train and for the whole train. Results are presented in Table 3. It can be seen that the values of parameters for each subsequence are different. This indicates that the sequence is not stationary. However, the sum of the parameters for the three parts of the train precisely coincides (within 5% precision) with the value of the corresponding parameter calculated for the whole train. For the parameter g2, the difference is 33%. However, this was the single difference between the sum of the parameters for subsets and the parameter for the whole sequence that exceeded 10% found in our data. We have conducted the same type calculations for all spike trains dividing them into two parts each. In most cases, the results for the two parts differed by 50% or more, however, the sums for each of the parameter values for the two halves of the spike train always coincided with the parameter value for the whole train within 10% precision. These tests have demonstrated that the parameter values that we have obtained using the methods described above, in our conditions, did not depend on whether data were stationary or not.
Table 3.
Experimental (gi) and “Theoretical” ( ) values of the g-parameters for the impulse sequence of neuron RM05 and of its subsequences
| ID | ints# | g1 | g2 | g3 | g4 | g5 | g6 | |||||
|---|---|---|---|---|---|---|---|---|---|---|---|---|
| #1 | 8000 | 68 | 39.9 | 0 | 1.06 | 0 | 3.5 | 5 | 6.9 | 32 | 28.94 | 1 |
| #2 | 8000 | 51 | 27.42 | 0 | 0.64 | 4 | 4.0 | 7 | 5.93 | 20 | 17.52 | 4 |
| #3 | 6550 | 36 | 18.53 | 0 | 0.62 | 3 | 2.05 | 7 | 5.08 | 18 | 11.61 | 4 |
| sum | 22550 | 155 | 85.55 | 0 | 2.32 | 7 | 9.55 | 19 | 17.91 | 70 | 58.07 | 9 |
| whole | 22550 | 153 | 82.59 | 0 | 1.74 | 7 | 9.56 | 19 | 17.99 | 70 | 55.62 | 9 |
Parameters of the three subsequences (#1, #2, and #3), the sum of the parameters for them (sum), and parameter values for the whole sequence (whole) are shown in the lines. The number of interspike intervals in a subsequence is shown in the second column.
A4. Slow modulation as a source of precise triads
The neuronal populations that we have studied were involved in rhythmic activities, locomotion or respiration, each of which was characterized by a continuous modulation of the discharge frequency in the great majority of the neurons (see Fig. 1D for an example). Such modulation included periods of slow frequency changes or even episodes of a constant frequency. In the latter case, even in the presence of noise, an occurrence of precise triads is inevitable. We aimed to exclude such triads. To obtain a reference, we considered a sequence of impulses generated by a simple neuron model with the slowly modulated signal plus noise at its input [21]. Details of the model are as follows.
A model neuron output was controlled by two variables: a membrane potential U(t), and a threshold H(t). In the model, activation of the artificial neuron did not affect its U(t), while the threshold was a function of a single parameter – the time, that has passed since the last spike of the neuron. For this function, we have adopted a hyperbola because it yields a simple linear relationship between the membrane potential and the output spike frequency [17]. The membrane potential consisted of three components: (a) a periodically changing deterministic input; (b) a constant bias; and (c) random noise. We have defined the “slow modulation” as a steady or a steadily changing input. For the periodic component we have chosen a 1/2 of a period of a cosine wave (starting with the phase of −π), that occupied a half of the oscillation period of the input signal. The low-pass filtered white noise was used (time constant - 20 ms). The model was updated in steps of 0.2 ms duration.
The impulse sequence generated by this slow modulation model was characterized by a specific G-vector, Gm=(+1,0,−1,−1,+1,0). In other words, the impulse sequence of this modeled neuron contained a large number of precise triads and of PPTIs equal to avIEIs, a small number of PPTIs of half or double avIEI length, and a small number of H3-patterns with a combination of these features. Thus, if most of the H3-patterns in a spike train would be due to a slow modulation, the G-vector for this train would coincide with Gm. If on the contrary, the G-vector of a spike train was distant from the Gm, we could conclude that the observed H3-patterns in that spike train were not likely to be caused by any slow modulation, including that of locomotion or respiration rhythms.
A5.Conclusion on a non-trivial origin of H3-patterns in spike trains
We have made a decision whether H3-patterns in a spike train can or can not be explained by such trivial causes as random chances or a slow modulation on the basis of the G-vector values. If G-vector did not coincide with neither G0 nor Gm we refer to such spike trains as spike trains showing non-trivial H3-patterns. Their probable origin is conferred in the Discussion. To measure how much H3-patterns of a given impulse sequence, represented by its G-vector, differ from the trivial cases, represented by G0 and Gm we used the distance between pairs of G-vectors, e.g. between G1=(G11, G12, G13, G14, G15, G16) and G2=(G21, G22, G23, G24, G25, G26), defined as
| (3) |
A6. Double return plot of interspike intervals
To additionally validate our approach to the statistical evaluation of the significance of the data, we used an independent method, namely, the 3-d double return plot analysis. This is a generalization of the standard return maps method commonly used for the neuronal spike trains analysis (e.g., [76]). The successive triples of the intervals, (TN, TN−1, TN−2) were plotted in a 3-d space as shown in Fig. 5 (TN is the duration of the N-th IEI, N varies from 1 to the number of IEIs in the set minus 2). The precise triads revealed by our algorithm (empty spheres in Fig. 5) were found inside a thin cylinder in close vicinity to the diagonal of the positive octant. The expected number of the precise triads in this cylinder, based on an assumption of a random homogenous distribution, was then calculated. This calculation took into account: (1) the total number of the spheres, captured in the 3-d space sub-region, (2) the number of the precise triads in it, (3) the volume of the cylinder, to which the precise triads belonged, and (4) the total volume of the 3-d space sub-region. The precise triad search algorithm, as described in Appendix 1, yields the effective radius of the “enlightened cylinder” in Fig. 5A equal 0.45·p·T (the calculations of the cylinder radius using Monte Carlo method are straightforward). Comparison of the expected and observed numbers of the precise triads using the Poisson distribution yielded the probability of the observed data under the hypothesis, that the spheres are homogeneously distributed in the sub-region. We rejected this hypothesis (and therefore accepted the hypothesis of a non-random distribution of the precise triads) if P<0.05.
References
- 1.Abeles M, Gat I. Detecting precise firing sequences in experimental data. J Neurosci Methods. 2001;107(1–2):141–54. doi: 10.1016/s0165-0270(01)00364-8. [DOI] [PubMed] [Google Scholar]
- 2.Baker SN, Lemon RN. Precise spatiotemporal repeating patterns in monkey primary and supplementary motor areas occur at chance level. J Neurophysiol. 2000;84:1770–1780. doi: 10.1152/jn.2000.84.4.1770. [DOI] [PubMed] [Google Scholar]
- 3.Baker SN, Olivier E, Lemon RN. Coherent oscillations in monkey motor cortex and hand muscle EMG show task-dependent modulation. J Physiol. 1997;501(1):225–241. doi: 10.1111/j.1469-7793.1997.225bo.x. [DOI] [PMC free article] [PubMed] [Google Scholar]
- 4.Baker SN, Pinches EM, Lemon RN. Synchronization in monkey motor cortex during a precision grip task. II. Effect of oscillatory activity on corticospinal output. J Neurophysiol. 2003;89(4):1941–1953. doi: 10.1152/jn.00832.2002. [DOI] [PubMed] [Google Scholar]
- 5.Baker SN, Curio G, Lemon RN. EEG oscillations at 600 Hz are macroscopic markers for cortical spike bursts. J Physiol (L) 2003;550( 2):529–534. doi: 10.1113/jphysiol.2003.045674. [DOI] [PMC free article] [PubMed] [Google Scholar]
- 6.Beloozerova IN, Sirota MG. Abstract Viewer/Itinerary Planner. Washington, DC: Society for Neuroscience; 2002. Activity of ventrolateral thalamus (VL) during locomotion. Program No. 62.13. [Google Scholar]
- 7.Beloozerova IN, Sirota MG. Integration of motor and visual information in parietal area 5 during locomotion. J Neurophysiol. 2003;90(2):961–971. doi: 10.1152/jn.01147.2002. [DOI] [PubMed] [Google Scholar]
- 8.Beloozerova IN, Sirota MG, Swadlow HA. Activity of different classes of neurons of the motor cortex during locomotion. J Neurosci. 2003a;23(3):1087–1097. doi: 10.1523/JNEUROSCI.23-03-01087.2003. [DOI] [PMC free article] [PubMed] [Google Scholar]
- 9.Beloozerova IN, Sirota MG, Swadlow HA. Abstract Viewer/Itinerary Planner. Washington, DC: Society for Neuroscience; 2003b. Activity and silence of feline motor cortex efferent populations during locomotion. Program No. 921.22. Online. [Google Scholar]
- 10.Beloozerova IN, Sirota MG, Swadlow HA, Orlovsky GN, Popova LB, Deliagina TG. Activity of different classes of neurons of the motor cortex during postural corrections. J Neurosci. 2003c;23(21):7844–7853. doi: 10.1523/JNEUROSCI.23-21-07844.2003. [DOI] [PMC free article] [PubMed] [Google Scholar]
- 11.Bishop PO, Burke W, Davis R. The identification of single units in central visual pathways. J Physiol (L) 1962;162:409–431. doi: 10.1113/jphysiol.1962.sp006942. [DOI] [PMC free article] [PubMed] [Google Scholar]
- 12.Bragin A, Engel J, Jr, Wilson CL, Fried I, Buzsaki G. High-frequency oscillations in human brain. Hippocampus. 1999;9(2):137–142. doi: 10.1002/(SICI)1098-1063(1999)9:2<137::AID-HIPO5>3.0.CO;2-0. [DOI] [PubMed] [Google Scholar]
- 13.Chang EY, Morris KF, Shannon R, Lindsey BG. Repeated sequences of interspike intervals in baroresponsive respiratory related neuronal assemblies of the cat brain stem. J Neurophysiol. 2000;84:1136–1148. doi: 10.1152/jn.2000.84.3.1136. [DOI] [PubMed] [Google Scholar]
- 14.Dayan P, Abbott LF. Theoretical Neuroscience. Computational and Mathematical Modeling of Neural Systems. MIT Press; Cambridge: 2001. p. 576. [Google Scholar]
- 15.Dayhoff JE, Gerstein GL. Favored patterns in spike trains. I. Detection. J Neurophysiol. 1983;49(6):1334–1348. doi: 10.1152/jn.1983.49.6.1334. [DOI] [PubMed] [Google Scholar]
- 16.Donoghue JP, Sanes JN, Hatsopoulos NG, Gaal G. Neural discharge and local field potential oscillations in primate motor cortex during voluntary movements. J Neurophysiol. 1998;79(1):159–173. doi: 10.1152/jn.1998.79.1.159. [DOI] [PubMed] [Google Scholar]
- 17.Dunin-Barkowski WL. Continuos description of a neuron impulse model. Biofizika. 1967;12(4):746–750. (in Russian). [PubMed] [Google Scholar]
- 18.Dunin-Barkowski WL. Some properties of a group of neurons, working in parallel. II. A role played by excitatory and inhibitory interconnections. Biofizika. 1971;16(4):698–704. (in Russian) [Google Scholar]
- 19.Dunin-Barkowski WL, Chetaev AN. On the stability of activity level in a net of excitable elements. Biofizika. 1971;16(5):911–914. (in Russian) [PubMed] [Google Scholar]
- 20.Dunin-Barkowski WL, Beloozerova IN, Sirota MG, Orem JM, Lovering AT, Vidruk EH. H-patterns in activity of single neurons; Eleventh Annual Computational Neuroscience Meeting; Chicago. July 21 – 25; 2002. p. 101. [Google Scholar]
- 21.Dunin-Barkowski WL, Escobar AL, Lovering AT, Orem JM. Respiratory pattern generator model using Ca++-induced Ca++ release in neurons shows both pacemaker and reciprocal network properties. Biological Cybernetics. 2003;89:274–288. doi: 10.1007/s00422-003-0418-6. [DOI] [PubMed] [Google Scholar]
- 22.Dunin-Barkowski WL, Orem JM, Lovering AT, Vidruk EH, Sirota MG, Beloozerova IN. 2003 Abstract Viewer/Itinerary Planner. Washington, DC: Society for Neuroscience; 2003. Precise rhythmicity in activity of neocortical, thalamic and brain stem neurons in un-anesthetized cats. Program No. 661.5. Online. [Google Scholar]
- 23.Engel AK, Konig P, Gray CM, Singer W. Stimulus-Dependent Neuronal Oscillations in Cat Visual Cortex: Inter-Columnar Interaction as Determined by Cross-Correlation Analysis. Eur J Neurosci. 1990;2(7):588–606. doi: 10.1111/j.1460-9568.1990.tb00449.x. [DOI] [PubMed] [Google Scholar]
- 24.Fiete IR, Hahnloser RH, Fee MS, Seung HS. Temporal sparseness of the premotor drive is important for rapid learning in a neural network model of birdsong. J Neurophysiol. 2004;92(4):2274–2282. doi: 10.1152/jn.01133.2003. [DOI] [PubMed] [Google Scholar]
- 25.Fuller JH, Schlag J. Determination of antidromic excitation by the collision test: problems of interpretation. Brain Res. 1976;122:283–298. doi: 10.1016/0006-8993(76)90284-5. [DOI] [PubMed] [Google Scholar]
- 26.Funk GD, Parkis MA. High frequency oscillations in respiratory networks: functionally significant or phenomenological. Respir Physiol & Neurobiol. 2002;131:101–120. doi: 10.1016/s1569-9048(02)00041-1. [DOI] [PubMed] [Google Scholar]
- 27.Gerstein GL. Functional Association of Neurons: Detection and Interpretation. In: Schmidt FO, editor. The Neuroscience: Second Study Program. NY: The Rockefeller Univ. Press; 1970. pp. 648–661. [Google Scholar]
- 28.Gray CM, Singer W. Stimulus-specific neuronal oscillations in orientation columns of cat visual cortex. Proc Natl Acad Sci U S A. 1989;86(5):1698–1702. doi: 10.1073/pnas.86.5.1698. [DOI] [PMC free article] [PubMed] [Google Scholar]
- 29.Grenier F, Timofeev I, Steriade M. Neocortical very fast oscillations (ripples, 80–200 Hz) during seizures: intracellular correlates. J Neurophysiol. 2003;89(2):841–852. doi: 10.1152/jn.00420.2002. [DOI] [PubMed] [Google Scholar]
- 30.Hahnloser RH, Kozhevnikov AA, Fee MS. An ultra-sparse code underlies the generation of neural sequences in a songbird. Nature. 2002;419(6902):65–70. doi: 10.1038/nature00974. [DOI] [PubMed] [Google Scholar]
- 31.Haykin S. Neural networks: a comprehensive foundations. Mac Millan; NY: 1999. p. 795. [Google Scholar]
- 32.Hopfield JJ, Brody CD. What is moment? "Cortical" sensory integration over a brief interval. PNAS. 2000;97(25):13919–13924. doi: 10.1073/pnas.250483697. [DOI] [PMC free article] [PubMed] [Google Scholar]
- 33.Hopfield JJ, Brody CD. What is moment? Transient synchrony as a collective mechanism for spatiotemporal integration. PNAS. 2001;98(3):1282–1287. doi: 10.1073/pnas.031567098. [DOI] [PMC free article] [PubMed] [Google Scholar]
- 34.Huang W-X, Cohen MI, Yu Q, See WR, He Q. High-Frequency oscillations in membrane potentials of medullary inspiratory and expiratory neurons (including laryngeal motoneurons) J Neurophysiol. 1996;76:1405–1412. doi: 10.1152/jn.1996.76.3.1405. [DOI] [PubMed] [Google Scholar]
- 35.Huang W-X, Yu Q, Cohen MI. Fast (3 Hz and 10 Hz) and slow (respiratory) rhythms in cervical sympathetic nerve and unit discharges of the cat. J Physiol. 2000;523.2:459–477. doi: 10.1111/j.1469-7793.2000.00459.x. [DOI] [PMC free article] [PubMed] [Google Scholar]
- 36.Ikegaya Y, Aaron G, Cossart R, Aronov D, Lampl I, Ferster D, Yuste R. Synfire chains and cortical songs: temporal modules of cortical activity. Science. 2004;304(5670):559–564. doi: 10.1126/science.1093173. [DOI] [PubMed] [Google Scholar]
- 37.Jackson A, Gee VJ, Baker SN, Lemon RN. Synchrony between neurons with similar muscle fields in monkey motor cortex. Neuron. 2003;38(1):115–125. doi: 10.1016/s0896-6273(03)00162-4. [DOI] [PubMed] [Google Scholar]
- 38.Lebedev MA, Nelson RJ. Rhythmically firing (20–50 Hz) neurons in monkey primary somatosensory cortex: activity patterns during initiation of vibratory-cued hand movements. J Comput Neurosci. 1995;2(4):313–334. doi: 10.1007/BF00961443. [DOI] [PubMed] [Google Scholar]
- 39.Lebedev MA, Nelson RJ. Rhythmically firing neostriatal neurons in monkey: activity patterns during reaction-time hand movements. J Neurophysiol. 1999;82(4):1832–1842. doi: 10.1152/jn.1999.82.4.1832. [DOI] [PubMed] [Google Scholar]
- 40.Lebedev MA, Wise SP. Oscillations in the premotor cortex: single-unit activity from awake, behaving monkeys. Exp Brain Res. 2000;130(2):195–215. doi: 10.1007/s002210050022. [DOI] [PubMed] [Google Scholar]
- 41.Lestienne R. Spike timing, synchronization and information processing on the sensory side of the central nervous system. Progr Neurobiol. 2001;65:545–591. doi: 10.1016/s0301-0082(01)00019-3. [DOI] [PubMed] [Google Scholar]
- 42.Lestienne R, Strehler BL. Time structure and stimulus dependence of precisely replicating patterns present in monkey cortical neuronal spike trains. Brain Res. 1987;437(2):214–238. doi: 10.1016/0006-8993(87)91638-6. [DOI] [PubMed] [Google Scholar]
- 43.Lestienne R, Tuckwell HC, Chalansonnet M, Chaput M. Repeating triplets of spikes and oscillations in the mitral cell discharges of freely breathing rats. Eur J Neurosci. 1999;11(9):3185–3193. doi: 10.1046/j.1460-9568.1999.00740.x. [DOI] [PubMed] [Google Scholar]
- 44.Murthy VN, Fetz EE. Coherent 25- to 35-Hz oscillations in the sensorimotor cortex of awake behaving monkeys. Proc Natl Acad Sci U S A. 1992;89(12):5670–5674. doi: 10.1073/pnas.89.12.5670. [DOI] [PMC free article] [PubMed] [Google Scholar]
- 45.Murthy VN, Fetz EE. Oscillatory activity in sensorimotor cortex of awake monkeys: synchronization of local field potentials and relation to behavior. J Neurophysiol. 1996;76(6):3949–3967. doi: 10.1152/jn.1996.76.6.3949. [DOI] [PubMed] [Google Scholar]
- 46.McCormick DA, Contreras D. On the cellular and network bases of epileptic seizures. Annu Rev Physiol. 2001;63:815–846. doi: 10.1146/annurev.physiol.63.1.815. [DOI] [PubMed] [Google Scholar]
- 47.Nakazawa K, Granata A, Cohen MI. Synchronized fast rhythms in inspiratory and expiratory nerve discharges during fictive vocalization. J Neurophysiol. 2000;83:1415–1425. doi: 10.1152/jn.2000.83.3.1415. [DOI] [PubMed] [Google Scholar]
- 48.Oram MW, Wiener MC, Lestienne R, Richmond BJ. Stochastic nature of precisely timed spike patterns in visual system neuronal responses. J Neurophysiol. 1999;81:3021–3033. doi: 10.1152/jn.1999.81.6.3021. [DOI] [PubMed] [Google Scholar]
- 49.Orem JM, Dick T. Consistency and signal strength of the respiratory neuronal activity. J Neurophysiol. 1983;50:1098–1107. doi: 10.1152/jn.1983.50.5.1098. [DOI] [PubMed] [Google Scholar]
- 50.Orem JM, Lovering AT, Dunin-Barkowski WL, Vidruk EH. J Physiol. Vol. 527.2. 2000. Endogenous excitatory drive to the respiratory system in rapid eye movement sleep; pp. 365–376. [DOI] [PMC free article] [PubMed] [Google Scholar]
- 51.Pellerin JP, Lamarre Y. Local field potential oscillations in primate cerebellar cortex during voluntary movement. J Neurophysiol. 1997;78(6):3502–3507. doi: 10.1152/jn.1997.78.6.3502. [DOI] [PubMed] [Google Scholar]
- 52.Prilutsky BI, Sirota MG, Gregor RJ, Beloozerova IN. Quantification of whole-body biomechanics and motor cortex activity during locomotion. J Neurophysiol. 2005;94(4):2959–2969. doi: 10.1152/jn.00704.2004. [DOI] [PubMed] [Google Scholar]
- 53.Prut Y, Perlmutter SI. Firing properties of spinal interneurons during voluntary movement. I. State-dependent regularity of firing. J Neurosci. 2003;23(29):9600–9610. doi: 10.1523/JNEUROSCI.23-29-09600.2003. [DOI] [PMC free article] [PubMed] [Google Scholar]
- 54.Pryor K. Lads before the wind. Harper and Row; New York, Evanston, San Francisco, London: 1975. p. 278. [Google Scholar]
- 55.Reitboeck HJ. Fiber microelectrodes for electrophysiologycal recordings. J Neurosci Meth. 1983;8:249–262. doi: 10.1016/0165-0270(83)90038-9. [DOI] [PubMed] [Google Scholar]
- 56.Ruffo M, Postupna N, Anderson M. Corticothalamic neurons to motor thalamus have low spontaneous or task related activity. Soc Neurosci Abst. 2001;27:824.4. [Google Scholar]
- 57.Sanes JN, Truccolo W. Motor "binding:" do functional assemblies in primary motor cortex have a role? Neuron. 2003;38(1):3–5. doi: 10.1016/s0896-6273(03)00203-4. [DOI] [PubMed] [Google Scholar]
- 58.Shadlen MN, Movshon JA. Neuron. 1. Vol. 24. 1999. Synchrony unbound: a critical evaluation of the temporal binding hypothesis; pp. 67–77. 111–125. [DOI] [PubMed] [Google Scholar]
- 59.Singer W. Neuronal synchrony: a versatile code for the definition of relations. Neuron. 1999;24:49–65. doi: 10.1016/s0896-6273(00)80821-1. [DOI] [PubMed] [Google Scholar]
- 60.Sirota MG, Swadlow HA, Beloozerova IN. Three channels of corticothalamic communication during locomotion. J Neurosci. 2005;25(25):5915–5925. doi: 10.1523/JNEUROSCI.0489-05.2005. [DOI] [PMC free article] [PubMed] [Google Scholar]
- 61.Skinner BF. The Behavior of Organisms. Appleton-Century-Crofts, Inc; 1938. [Google Scholar]
- 62.Steriade M. The corticothalamic system in sleep. Front Biosci. 2003;8:878–99. doi: 10.2741/1043. [DOI] [PubMed] [Google Scholar]
- 63.Steriade M. Neocortical cell classes are flexible entities. Nat Rev Neurosci. 2004;5(2):121–134. doi: 10.1038/nrn1325. [DOI] [PubMed] [Google Scholar]
- 64.Strogatz SH, Mirollo RE, Matthews PC. Coupled nonlinear oscillators below the synchronization threshold: Relaxation by generalized Landau damping. Phys Rev Lett. 1992;68(18):2730–2733. doi: 10.1103/PhysRevLett.68.2730. [DOI] [PubMed] [Google Scholar]
- 65.Strehler BL, Lestienne R. Evidence on precise time-coded symbols and memory of patterns in monkey cortical neuronal spike trains. Proc Natl Acad Sci U S A. 1986;83(24):9812–9816. doi: 10.1073/pnas.83.24.9812. [DOI] [PMC free article] [PubMed] [Google Scholar]
- 66.Swadlow HA. Efferent neurons and suspected interneurons in binocular visual cortex of the awake rabbit: Receptive fields and binocular properties. J Neurophysiol. 1988;59:1162–1187. doi: 10.1152/jn.1988.59.4.1162. [DOI] [PubMed] [Google Scholar]
- 67.Swadlow HA. Efferent neurons and suspected interneurons in S-1 vibrissa cortex of the awake rabbit: Receptive fields and axonal properties. J Neurophysiol. 1990;62:288–308. doi: 10.1152/jn.1989.62.1.288. [DOI] [PubMed] [Google Scholar]
- 68.Swadlow HA. Efferent neurons and suspected interneurons in motor cortex of the awake rabbit: Axonal properties, sensory receptive fields and subthreshold synaptic inputs. J Neurophysiol. 1994;71:437–453. doi: 10.1152/jn.1994.71.2.437. [DOI] [PubMed] [Google Scholar]
- 69.Timofeev I, Steriade M. Fast (mainly 30–100 Hz) oscillations in the cat cerebellothalamic pathway and their synchronization with cortical potentials. J Physiol. 1997;504 ( Pt 1):153–168. doi: 10.1111/j.1469-7793.1997.153bf.x. [DOI] [PMC free article] [PubMed] [Google Scholar]
- 70.Tsodyks M, Mitkov II, Sompolinsky H. Pattern of synchrony in inhomogeneous networks of oscillators with pulse interactions. Phys Rev Lett. 1993;71(8):1280–1283. doi: 10.1103/PhysRevLett.71.1280. [DOI] [PubMed] [Google Scholar]
- 71.Turner RS, DeLong MR. Corticostriatal activity in primary motor cortex of the macaque. J Neurosci. 2000;20(18):7096–7108. doi: 10.1523/JNEUROSCI.20-18-07096.2000. [DOI] [PMC free article] [PubMed] [Google Scholar]
- 72.Usrey WM, Alonso JM, Reid RC. Synaptic interactions between thalamic inputs to simple cells in cat visual cortex. J Neurosci. 2000;20(14):5461–5467. doi: 10.1523/JNEUROSCI.20-14-05461.2000. [DOI] [PMC free article] [PubMed] [Google Scholar]
- 73.Vinje WE, Gallant JL. Sparse coding and decorrelation in primary visual cortex during natural vision. Science. 2000;287(5456):1273–1276. doi: 10.1126/science.287.5456.1273. [DOI] [PubMed] [Google Scholar]
- 74.Volgushev M, Pernberg J, Eysel UT. Gamma-frequency fluctuations of the membrane potential and response selectivity in visual cortical neurons. Eur J Neurosci. 2003;17(9):1768–1776. doi: 10.1046/j.1460-9568.2003.02609.x. [DOI] [PubMed] [Google Scholar]
- 75.von der Malsburg C. The what and why of binding: the modeler's perspective. Neuron. 1999;24(1):95–104. doi: 10.1016/s0896-6273(00)80825-9. 111–125. [DOI] [PubMed] [Google Scholar]
- 76.Wan Y-H, Jian Z, Wen Z-H, Wang Y-Y, Han S, Duan Y-B, Xing J-L, Zhu J-L, Hu S-J. Synaptic transmission of chaotic spike trains between primary afferent fiber and spinal dorsal horn neuron in the rat. Neuroscience. 2003;125:1051–1060. doi: 10.1016/j.neuroscience.2004.02.035. [DOI] [PubMed] [Google Scholar]