

Abstract
GABAergic interneurons in many areas of the neocortex are mutually connected via chemical and electrical synapses. Previous computational studies have explored how these coupling parameters influence the firing patterns of interneuronal networks. These models have predicted that the stable states of such interneuronal networks will be either synchrony (near zero phase lag) or antisynchrony (phase lag near one-half of the interspike interval), depending on network connectivity and firing rates. In certain parameter regimens, the network can be bistable, settling into either stable state depending on the initial conditions. Here, we investigated how connectivity parameters influence spike patterns in paired recordings from layer I interneurons in brain slices from juvenile mice. Observed properties of chemical and electrical synapses were used to simulate connections between uncoupled cells via dynamic clamp. In uncoupled pairs, action potentials induced by constant depolarizing currents had randomly distributed phase differences between the two cells. When coupled with simulated chemical (inhibitory) synapses, however, these pairs exhibited a bimodal firing pattern, tending to fire either in synchrony or in antisynchrony. Combining electrical with chemical synapses, prolonging τDecay of inhibitory connections, or increasing the firing rate of the network all resulted in enhanced stability of the synchronous state. Thus, electrical and inhibitory synaptic coupling constrain the relative timing of spikes in a two-cell network to, at most, two stable states, the stability and precision of which depend on the exact parameters of coupling.
Keywords: inhibition, GABAA, gap junctions, synchrony, neocortex, anesthesia
Introduction
In the auditory cortex (ACx), firing patterns distributed across populations of pyramidal cells are postulated to represent features of the acoustic environment (Lu et al., 2001; Mickey and Middlebrooks, 2003). We are interested in how GABAergic interneurons shape these firing patterns. Interneurons regulate spike timing by inhibiting target cells for brief periods of time, and they coordinate spike timing across cell populations via divergence (Cobb et al., 1995). These rules apply as well in interneuronal networks in which cells are coupled by inhibitory synapses and/or gap junctions (Whittington et al., 1995; Galarreta and Hestrin, 1999; Beierlein et al., 2000). Spike times in these networks are constrained by synaptic coupling parameters, the modulation of which alters the dynamics of observed firing patterns. For example, synchronous γ oscillations (30-80 Hz) exhibited by interneuronal networks are modulated in frequency and coherence by anesthetic agents that prolong inhibition (Whittington et al., 1996; Faulkner et al., 1998). Indeed, it is postulated that general anesthetics impair cortical processing by modulating these firing patterns (Faulkner et al., 1998; Baker et al., 2002; John, 2002; Mashour, 2004). Because most anesthetic agents prolong GABAA receptor-mediated IPSCs (Jones and Harrison, 1993; Banks and Pearce, 1999; Antkowiak, 2001), it is critical to understand how prolonging inhibition alters the functional output of interneuronal networks.
Interneurons in layer I (LI) form networks of cells coupled by both chemical and electrical synapses (Chu et al., 2003). Many LI interneurons have dense, horizontally extensive axonal projections, suggesting that LI interneurons may coordinate activity patterns across multiple cortical columns (Nieuwenhuys, 1994; Hestrin and Armstrong, 1996; Zhou and Hablitz, 1996). In the ACx, γ oscillations occur spontaneously but can also be evoked by stimulation of intralaminar thalamic nuclei (Brett and Barth, 1997), which project preferentially to LI (Hu, 2003). These rhythmic firing patterns are also observed in vitro (Metherate and Cruikshank, 1999; Traub et al., 2005), indicating that intracortical circuitry is sufficient to underlie this network activity.
In theoretical and computational studies, networks of cells connected by weak inhibitory synapses and/or gap junctions exhibit two stable firing states, synchrony (zero phase lag) or antisynchrony (phase lag of 0.5 on the unit circle) (van Vreeswijk et al., 1994; Wang and Buzsaki, 1996; Di Garbo et al., 2002; Lewis and Rinzel, 2003). Over some range of the parameter space, these networks exhibit “bistability,” converging toward either synchrony or antisynchrony, depending on the initial conditions. Evidence for bistability has not been observed previously in biological networks, although a recent study showed that synchrony and antisynchrony can coexist at different mean firing rates (Gibson et al., 2005).
We hypothesized that networks of interneurons in LI would exhibit multiple preferred-activity patterns and that anesthetic agents would alter the stability of these patterns by modulating inhibition. To test this hypothesis, we recorded interneurons in LI coupled via dynamic clamp and investigated the firing patterns these two-cell networks generated using coupling parameters recorded under control conditions and in the presence of the general anesthetic isoflurane.
Materials and Methods
Slice preparation. All experimental protocols conformed to American Physiological Society/National Institutes of Health guidelines and were approved by the University of Wisconsin Research Animal Resources Committee. Male and female CBA/J mice (postnatal days 13-25) were decapitated under isoflurane anesthesia, and the brains were extracted and immersed in artificial CSF [ACSF; composed of (in mm) 126 NaCl, 26 NaHCO3, 1.8 KCl, 2.1 CaCl2, 1.4 MgSO4, 1.2 KH2PO4, and 10 glucose] at 0-4°C. Slices (500 μm) were obtained from the left hemisphere in a plane 15° off the horizontal plane, as described for auditory thalamocortical slices (Cruikshank et al., 2001). Slices were maintained in ACSF saturated with 95% O2/5% CO2 at 24°C for >1 h before transfer to the recording chamber, which was perfused at 3 ml/min with ACSF at 34°C.
Putative LI interneurons in the ACx were visualized using a video camera (VE-1000; DAGE MTI, Michigan City, IN) connected to an up-right microscope (BX-50WI; Olympus America, Melville, NY) equipped with an infrared bandpass filter (775 ± 75 nm), a long-working-distance water-immersion objective (40×; numerical aperture, 0.7), and differential interference contrast optics. The microscope and recording pipette were under remote control using an integrated motorized control system (Luigs & Neumann, Ratingen, Germany).
Patch-clamp electrophysiology: voltage clamp. Patch pipettes were fabricated from borosilicate glass (KG-33; 1.7 mm outer diameter; 1.1 mm inner diameter; Garner Glass, Claremont, CA) using a Flaming-Brown two-stage puller (P-87; Sutter Instruments, Novato, CA). The patch pipettes had open-tip resistances of 2-4 MΩ. Spontaneous IPSCs (sIPSCs) were recorded under whole-cell voltage clamp at 34°C with patch pipettes filled with the following (in mm): 100 KCl, 40 K-gluconate, 10 NaCl, 10 HEPES, 0.1 EGTA, 4 MgATP, and 5 N-(2,6-dimethylphenylcarbamoylmethyl)triethylammonium chloride, pH 7.3. Access resistances were <20 MΩ and compensated by 20-60%. Cells were held at -60 mV. GABAA receptor-mediated sIPSCs were isolated by bath application of 4 mm kynurenic acid to block ionotropic glutamate receptor-mediated currents. All remaining currents were blocked by 20 μm bicuculline (n = 5 cells; data not shown). Kynurenic acid, bicuculline, and all components of the pipette solution and control ACSF were obtained from Sigma-Aldrich (St. Louis, MO).
Isoflurane (Novaplus; Abbott Labs, North Chicago, IL) was bath applied to slices as follows. Isoflurane was prepared as an aqueous solution from a saturated stock solution (15 mm in ACSF) (Firestone et al., 1986) and diluted to a final concentration in ACSF on the day of the experiment. The isoflurane solution was prepared in 500 ml Teflon gas sampling bags (catalog #10-923-5; Fisher Scientific, Hampton, NH) that contained ACSF bubbled with 95% O2/5% CO2. Teflon tubing was used between the ACSF reservoirs and the recording chamber to minimize loss of the volatile agent before it reached the tissue. Preliminary experiments in which isoflurane concentration was measured in the liquid phase using Ca2+-sensitive electrodes (Hagan et al., 1998) indicated that ∼15% of the isoflurane was lost before it reached the center of the recording chamber, similar to a previous study using identical techniques and equipment (Banks and Pearce, 1999). We calibrated the Ca2+-sensitive electrode by determining the relationship between electrode potential and isoflurane concentration in solutions bubbled with isoflurane gas, and in parallel with solutions prepared as for our slices from stock concentrations assuming a saturating concentration of 15 mm (Hagan et al., 1998). We then measured the electrode potential in the slice chamber while perfusing with different isoflurane concentrations and calculated the percentage of loss according to the measured linear relationship between electrode potential and isoflurane concentration. This loss was accounted for in the reported values of the concentration of isoflurane used in these experiments.
After forming a gigaohm seal and rupturing the membrane to achieve intracellular access, glutamate receptor antagonists were allowed to equilibrate for 5 min before recording a baseline control period of 15 min duration. Isoflurane was then bath applied for 20 min. Recovery data were recorded for >30 min after removal of isoflurane from the bathing medium. Recovery data were obtained in eight of nine recordings. Throughout the experiment, access resistance was monitored at least every 10 min, and compensation was adjusted as needed. Experiments in which access resistance changed by >25% were discarded.
For these and all experiments, data were amplified (MultiClamp-700A; Molecular Devices, Union City, CA), low-pass filtered (10 kHz), digitized (20 kHz; DigiData 1322A; Molecular Devices), and recorded using pClamp version 9.0 (Molecular Devices).
Patch-clamp electrophysiology: current clamp. Identical patch pipettes were used for these experiments as for the voltage-clamp experiments. The patch pipette solution contained the following (in mm): 140 K-gluconate, 10 NaCl, 10 HEPES, 0.1 EGTA, and 2 MgATP, pH 7.2. A junction potential of -12 mV was corrected off-line. Open tip resistances with this solution were 4-6 MΩ. Pairs of LI cells were tested for synaptic coupling by triggering action potentials in the putative presynaptic cell in current-clamp mode and recording from the putative postsynaptic cell in voltage-clamp mode, varying the holding potential from -100 to +20 mV. Junctional conductance of electrical synapses was estimated by assuming that both cells were isopotential and connected only to each other.
Dynamic-clamp recordings from cell pairs. Patch pipettes and pipette solution were identical to those used for the current-clamp experiments above. Bath application of 4 mm kynurenic acid and 20 μm bicuculline was used to block ionotropic glutamate and GABA synaptic currents.
Dynamic-clamp recordings were implemented using Real-Time Linux Dynamic Clamp software developed at the Boston University Neuronal Dynamics Laboratory (Dorval et al., 2001) running under Red Hat Linux and connected to a MultiClamp amplifier (700A; Molecular Devices) via a data acquisition board (NI PCI-6052E; National Instruments, Austin, TX). To simulate chemical (inhibitory) synapses, the dynamic clamp generated a signal of form Is = Gs(e-t/τDecay - e-t/τRise)(Vm - Erev)/KSF, where Gs is the maximal synaptic conductance (0.5 nS), t is the time since the initiation of the synaptic event, τDecay is the synaptic conductance decay time constant (7, 14, and 21 ms), τRise is the synaptic conductance rise time constant (0.5 ms), Vm is membrane potential, Erev is the synaptic reversal potential (-70 mV), and KSF is a scale factor such that the peak of the current scales to unity when Gs = 1. This current was injected into either cell whenever a spike (defined as a threshold crossing, typically 0 mV, of positive slope) was detected in the opposite cell, with a synaptic delay of 1.2 ms from spike detection to event initiation. To simulate electrical synapses, the dynamic clamp applied a current of the form Ie = Ge (Vopp - Vm) to each cell continuously, where Ge is the gap-junction conductance (0.5 nS) and Vopp is the membrane potential of the opposite cell.
These signals were scaled appropriately, converted to analog signals, and passed to the current-drive channel of the bridge-balance amplifier. The measured values Vm and Vopp were updated, and new values of Is and Ie were calculated and delivered, at a clock rate of 5-10 kHz. The inhibitory synaptic coupling parameters used were based on sIPSCs observed in voltage-clamped LI cells under normal conditions (τDecay, ∼7 ms) and in the presence of 0.2 and 0.4 mm isoflurane (τDecay, ∼14 and ∼21 ms, respectively) (Fig. 1). The electrical conductance parameter used was based on recordings from pairs of LI cells coupled with biological gap junctions (Fig. 1).
Figure 1.
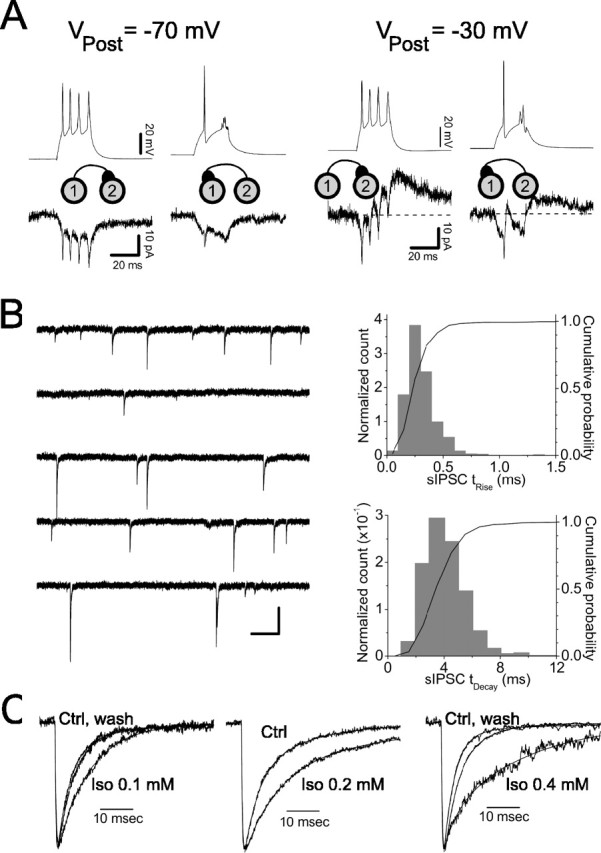
Synaptic coupling parameters in LI interneurons. A, Bidirectional electrical and chemical coupling between a pair of LI interneurons. The top traces show membrane potential recorded in the presynaptic cell under current clamp, and the bottom traces show membrane current recorded in the postsynaptic cell recorded under voltage clamp. The identities of the presynaptic and postsynaptic cells are indicated by the diagrams between the voltage and current traces. Left, Responses when the postsynaptic cell was held near the reversal potential for Cl-(VPost = -70 mV); right, responses recorded with the postsynaptic cell held at -30 mV. The resting potential of the cell 1 was -71.4 mV, and the resting potential of the cell 2 was -69.0 mV. The traces are the averages of 10-15 trials each. Before averaging, the traces were aligned on the time axis to the peaks of the first action potential in the presynaptic cell. This distorted the responses to the subsequent action potentials in the averages, which is particularly evident in the traces in which cell 2 was the presynaptic cell. B, sIPSCs recorded from an LI interneuron under whole-cell voltage clamp. Left, Ten seconds of continuous data recorded at a holding potential of -60 mV. IPSCs are inward because the cell is Cl- loaded. Right, The distribution of 10-90% rise times (top) and 63% decay times (bottom) for the same cell based on 10 min of recorded data. C, Modulation of sIPSCs by isoflurane (Iso). The averaged, normalized sIPSCs from three different cells treated with 0.1 mm isoflurane (left), 0.2 mm isoflurane (middle), and 0.4 mm isoflurane (right) are shown. Weighted decay time constants were as follows: left: Ctrl, 7.3 ms; Iso, 9.9 ms; wash, 8.2; middle: Ctrl, 9.5 ms; Iso, 21.4 ms; wash, not recorded; right: Ctrl, 5.0 ms; Iso, 19.3 ms; wash, 5.9 ms. Ctrl, Control.
Square pulses of current (duration, 0.5-2 s) were injected to induce spiking in both cells, with the current amplitude in each cell adjusted to achieve a target interspike interval (ISI) between 10 and 120 ms. For each pair of cells, we tested the effect on relative spike times of changing τDecay (7, 14, and 21 ms) with and without electrical coupling, typically at three different firing rates. A single trial consisted of the responses to a train of square current pulses eliciting >200 spikes in each cell when the cells were connected with one set of coupling parameters. Thus, in each cell pair, up to 24 trials were obtained. Trials in which either cell was unable to maintain a consistent ISI (SD/mean, >0.2) or in which the cells did not have similar ISIs [D = Mean1 - Mean2/(Mean1 + Mean2) > 0.25] were discarded. In fact, the disparity measure, D, was usually much less than 0.25 (D ≤ 0.1 for 316 of 436, ∼72% of trials; D ≤ 0.15 for 374 of 436, ∼86% of trials; D ≤ 0.2 for 431 of 436, ∼99% of trials).
Firing properties of LI interneurons were heterogeneous, and the cells studied in these experiments included representatives of previously identified classes of cortical interneurons, including fast spiking, regular spiking, and low-threshold spiking cells (Kawaguchi and Kubota, 1997; Gibson et al., 1999; Markram et al., 2004). However, there was considerable overlap in the firing and membrane properties of the cells in our data set, and we could find no satisfactory quantitative method for assigning individual cells to classes in a nonarbitrary manner. Thus, we do not present an analysis of how membrane or firing properties affected the network behavior of interneuronal pairs.
Analysis. sIPSCs were analyzed using an automated event detection algorithm (Banks et al., 1998). In this algorithm, two windows were moved along the data, a “peak” window and a “baseline” window. At each time point, the data within each window were averaged, and the baseline point was subtracted from the peak. This yielded a “pseudo-differentiated” form of the data that was characterized by large, rapid peaks at the onset of GABAA IPSCs. Threshold-level crossings were identified in this pseudo-differentiated data, with threshold set as 3 × σNoise, where σNoise was measured during periods of no visually detectable events and was typically 3-5 pA. Because the baseline value was constantly updated during the analysis, slow changes in baseline had no effect on the accuracy of the algorithm. This algorithm successfully detected >99% of sIPSCs. Individual sIPSCs (n > 20 in each cell for each condition) were selected for averaging when no other detected events occurred within ±100 ms of the peak. The averaged sIPSCs were then used to measure 10-90% rise times (tRise). Decay phases were best fit by two exponential components, and decay kinetics were characterized additionally by the weighted sum of the exponential decay components, τDec,Wt = A1τ1 + A2τ2. The time courses of individual, uncontaminated events were also characterized by the time to decay from peak to within 37% of the baseline.
For analyzing network activity in dynamic-clamp recordings, spike times were detected from the raw voltage traces using software written in Matlab. All spike times in a given trial were used, provided the trial satisfied the inclusion criteria mentioned above. Mean ISIs were computed from these raw spike times. Spike pairs in the network were defined by treating one cell as a reference cell and the other cell as a comparison cell, and for each spike in the reference cell finding the closest spike in time in the comparison cell. These spike pairs were then used to compute relative spike-time and phase histograms, fractions of spike pairs falling into particular phase ranges, and phase dynamics (i.e., trajectories of transitions between different phases). The phase variable, φ, of the network was defined by normalizing the time differential between neighboring spikes in the two cells to the ISI of the reference cell (both cells were treated as the reference in separate analyses). Phase thus had a range of 0 ≤ φ ≤ 1, but because this unit circle displayed symmetry about φ = 0.5 (see Results), we folded it into a half-circle, so that 0.9 ≥ φ ≥ 0.8 was equivalent to 0.1 ≤ φ ≤ 0.2, 0.8 ≥ φ ≥ 0.7 was equivalent to 0.2 ≤ φ ≤ 0.3, and so on. We found that the ratio of τDecay to mean ISI (White et al., 1998) was a good predictor of the stability of the synchronous firing state (see Results). To investigate the effect of this “inhibitory ratio” on network firing behavior, we took all trials recorded under the conditions being considered and divided the data into quintiles of the inhibitory ratio, computing mean parameters within each quintile.
Data are presented as mean ± SD. Statistical comparisons were performed using SPSS for Windows version 12.0 (SPSS, Chicago, IL).
Results
Synaptic coupling parameters in LI interneurons
We assessed the incidence, type, and strength of synaptic coupling between LI interneurons using paired whole-cell recordings. In these experiments, the putative presynaptic cell was stimulated in current-clamp mode with a current pulse that depolarized the cell and triggered action potentials, and the putative postsynaptic cell was held at various potentials in voltage clamp (Fig. 1 A). Near the reversal potential for GABAA receptor-mediated IPSCs (Vm = -70 mV), electrical coupling was manifested as a slow change in the holding current in the postsynaptic cell during the slow subthreshold depolarization in the presynaptic cell, and more rapid “spikelets” during action potentials in the presynaptic cell (Fig. 1A, left). When the postsynaptic cell was held depolarized to the reversal potential for GABAA IPSCs, chemical coupling was manifest as slower, slightly delayed synaptic outward currents that, if electrical coupling was also present, rode on top of the electrical coupling response (Fig. 1A, right). Evidence for electrical coupling was found in 25% (16 of 65) of the pairs of LI interneurons tested, with a mean coupling strength of 0.43 ± 0.39 nS, and in all cases, the coupling was bidirectional. Evidence for chemical coupling was observed in 15% (10 of 65) of pairs, with one-half of these connections bidirectional. In most cases, chemical coupling (6 of 10 pairs) was observed in conjunction with electrical coupling. Interestingly, all five pairs with bidirectional chemical coupling were also coupled by electrical synapses.
In the four cell pairs coupled by chemical synapses in the absence of electrical coupling, IPSCs occurred with a synaptic delay of 1.16 ± 0.13 ms, had peak amplitudes of 0.44 ± 0.22 nS, had 10-90% rise times of 1.45 ± 0.95 ms, and had 63% decay times of 6.33 ± 5.64 ms. The small sample size and large variability of the kinetics parameter measurements led us to obtain additional parameter estimates by analyzing sIPSCs, and their modulation by the volatile anesthetic agent isoflurane, in single-cell recordings from LI interneurons under whole-cell voltage clamp. This approach was necessarily indirect, because the sIPCSs recorded in LI cells undoubtedly arose from multiple interneuron populations in the slice. However, given the homogeneity of sIPSCs that we observed (Fig. 1 B), this approach is likely to give a good approximation to the parameters of inhibitory synapses connecting LI cells.
sIPSCs in LI cells occurred at rates of 1.86 ± 0.97 Hz and had mean amplitudes, rise times, and weighted decay time constants of 0.73 ± 0.34 nS, 0.74 ± 0.22 ms, and 7.0 ± 1.5 ms, respectively (n = 11 cells) (Fig. 1 B). We observed no correlation between rise time and amplitude for individual sIPSCs (data not shown), indicating that sIPSCs were not grossly distorted by spatial filtering. Isoflurane at 0.1, 0.2, and 0.4 mm prolonged the decay of sIPSCs by 1.4 ± 0.2-, 2.2 ± 1.0-, and 3.4 ± 0.4-fold, respectively (Fig. 1C) (n = 3 cells for each concentration). No significant effects were observed on rise time, amplitude, and frequency of sIPSCs at any concentration (data not shown). For our dynamic-clamp experiments, we used conductance amplitudes of 0.5 nS for both electrical and GABAergic synapses. For GABAergic synaptic conductance waveforms, a synaptic delay of 1.2 ms was used, 10-90% rise times were set to 1.1 ms (i.e., τRise = 0.5 ms), and decay time constants were set to 7, 14, and 21 ms, these corresponding to control, 0.2 mm isoflurane, and 0.4 mm isoflurane, respectively.
Network activity in cell pairs coupled by inhibition alone
To assess the firing patterns exhibited by a network of LI cells coupled with well defined synaptic parameters, we obtained whole-cell recordings from pairs of neurons that were not biologically coupled but functionally coupled using a dynamic-clamp system. The amplitude and time course of conductance waveforms implemented were based on measurements in biologically coupled cells as presented above. Network activity was studied in 58 pairs of interneurons in LI of the mouse ACx coupled via dynamic clamp. Of these cell pairs, 26 satisfied our inclusion criteria (see Materials and Methods) and were tested with at least two values of inhibitory conductance τDecay. Nearly all cells were tested with three values of τDecay at two or more firing rates. Twenty-three cell pairs were tested additionally with electrical coupling. In separate trials, we used tonic depolarizing currents to induce firing frequencies ranging from <10 to >75 Hz in these networks and recorded spike times in each cell under conditions of inhibitory coupling, electrical coupling, combined inhibitory and electrical coupling, and no coupling (control) between the cells. Inhibitory coupling was usually tested for three distinct IPSC decay time constants (7, 14, and 21 ms), both with and without electrical coupling, to probe the changes that GABAA-specific modulators might produce in these networks. The total number of trials in 26 cell pairs coupled by inhibition alone was 191, and the total number of trials in 23 cell pairs coupled with combined electrical and inhibitory coupling was 160.
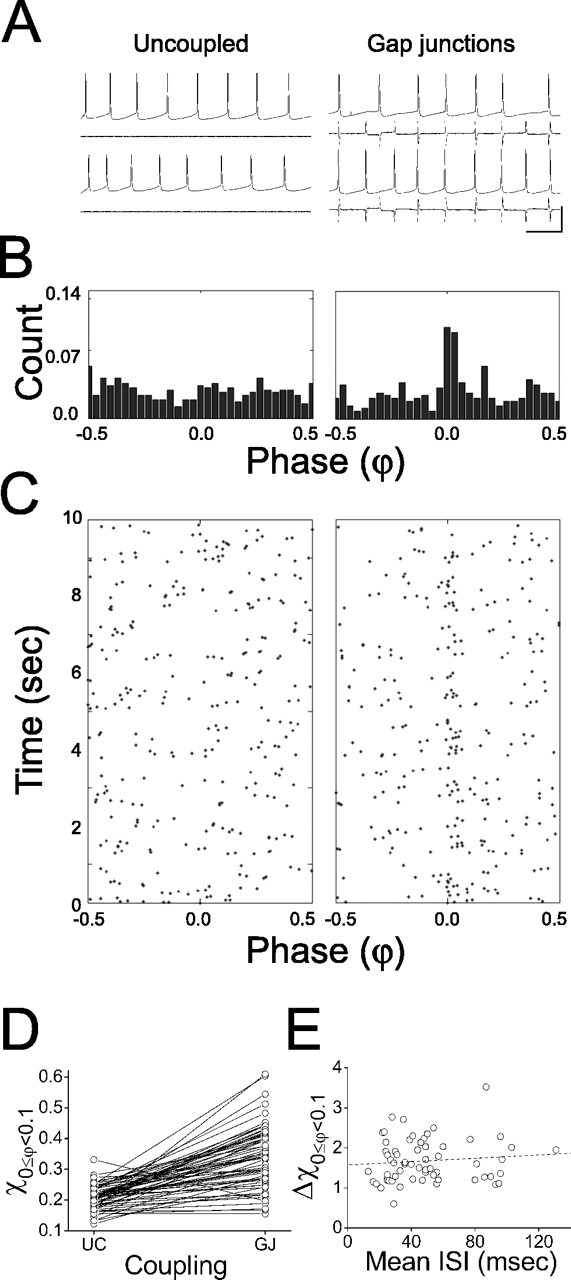
The phase relationship between spike pairs in these recordings, φ, was obtained for all neighboring spikes in each of the trials described above. In the absence of any coupling, φ was always distributed uniformly (Fig. 2 A). When the cells were coupled with inhibition, they entered a firing pattern in which they tended to alternate between two distinct phase ranges: one distributed broadly about φ = ∼0.5 (antisynchrony) and the other more tightly distributed about φ = ∼0 and/or 1 (synchrony) (Fig. 2 B-D). To quantify the synchronous and antisynchronous distributions, we used an algorithm that for each trial automatically detected the peaks and troughs in histograms like those plotted in Figure 2B, combined the “half-peaks” for φ = ±0.5, and computed the mean phase and its SD for the synchronous and antisynchronous phase distributions. For the synchronous distribution, the mean phase averaged across all trials and all cell pairs was μφ = 0.0086 ± 0.012, and the mean SD of phase averaged across all trials and all cell pairs was σφ = 0.037 ± 0.021. For the antisynchronous peak, μφ = 0.47 ± 0.022 and σφ = 0.12 ± 0.029; the smaller value of σφ for synchronous versus antisynchronous spike pairs reflects the more precise timing of synchronous versus antisynchronous spike pairs (n = 191 trials in 26 cell pairs; p < 0.001; Student's paired t test). Because the phase range 0 ≤ φ ≤ 1 displayed considerable symmetry about φ = 0 and φ = 0.5, we treated this unit circle as a half-circle, so that all spike pairs in the range 1 ≥ φ ≥ 0.5 were “folded” to overlay with spike pairs in the range 0 ≤ φ < 0.5 (see Materials and Methods). We divided this half-circle into five equal ranges and defined spike pairs falling within 0.4 ≤ φ ≤ 0.5 as antisynchronous and spike pairs falling within 0 ≤ φ < 0.1 as synchronous. The fractions of spike pairs falling in the synchronous and antisynchronous phase ranges were defined as χ0 ≤ φ < 0.1 and χ0.4 ≤ φ < 0.5, respectively. Note that randomly distributed phases would have χ0 ≤ φ < 0.1 = χ0.4 ≤ φ < 0.5 = 0.2.
Figure 2.

Bistability in a mutually inhibitory two-cell network in LI. A, Sample voltage and current traces from a pair of spiking cells when they are uncoupled and mutually coupled by inhibitory synapses with τDecay = 7, 14, and 21 ms. Vertical scale bar: 40 mV, 55 pA; horizontal scale bar, 100 ms. B, Normalized phase (φ) histograms for entire trials in each coupling regimen (columns arranged as in A). C, Raster plot of φ between neighboring spikes in each coupling regimen (columns arranged as in A and B) according to the time in which they occurred during the trial.
Synchronous firing was not, on average, favored over antisynchronous firing in mutually inhibitory cells (Fig. 3A), but synchrony did become more prevalent as the decay time of IPSCs or the firing rate of the network was increased (Fig. 3 B,C). A two-way ANOVA with repeated measures (τDecay as the repeated-measure, within-subjects factor; mean ISI as the between-subjects factor) showed a significant effect of τDecay on χ0 ≤ φ < 0.1 (F(2,106) = 20.96; p < 0.001) and a significant effect of firing rate on χ0 ≤ φ < 0.1 (F(3,53) = 17.51; p < 0.001) but no interaction between the two factors (F(6,106) = 1.998; p > 0.05). Post hoc tests showed significant increases in χ0 ≤ φ < 0.1 with increasing τDecay (Tukey's test; p < 0.001 for all comparisons). The degree to which inhibitory coupling promoted the synchronous firing state compared with the uncoupled regimen was also dependent on the mean firing rate of the network. At the fastest firing rates tested, inhibitory coupling generally yielded increases (relative to uncoupled) in synchronous firing (Fig. 3C, □), whereas at the slowest firing rates, inhibitory coupling generally yielded decreases in synchrony when inhibition was added (Fig. 3C, ⋄). A similar trend is seen when fractional change in synchrony from uncoupled to coupled by inhibition (τDecay = 7 ms) is plotted as a function of mean ISI (Fig. 3D).
Figure 3.

Synchrony is sensitive to both inhibitory decay time and mean firing rate. A, Fraction of phase values falling into each phase range (χφ) averaged over all cell pairs tested (n = 26) and all trials at τDecay = 7 ms (□, 62 trials), 14 ms (○, 59 trials), and 21 ms (▵, 58 trials). B, Fraction of spike pairs falling into the synchronous phase range (χ0 ≤ φ < 0.1) for τDecay = 7, 14, and 21 ms (59 trials from 26 cell pairs; trend lines show same-rate, within-pair comparisons; mean ± SD overlaid). C, Mean ± SD of the fraction of spike pairs falling into the synchronous phase range for pairs in five distinct rate quintiles when they are uncoupled (Unc) and when they are mutually inhibitory with τDecay =7, 14, and 21 ms (59 trials from 26 cell pairs; 11 or 12 trials per quintile). Data are normalized to the fraction of synchronous spike pairs in the uncoupled regimen for that particular pair. Faster firing rates are shown in darker colors, and slower rates are shown in lighter colors. D, Fractional change in synchrony from uncoupled to inhibitory coupling (Δχ0 ≤ φ < 0.1) with τDecay = 7 ms (same-rate, within-pairs comparison; n = 57) as a function of the mean firing rate. The dotted line indicates fit of the function Δχ0 ≤ φ < 0.1 = Ae-k ISI to the data, where A = 1.7 and k = 0.044.
The similar effects of τDecay and firing rate on network synchrony reflects the relative amount of time between spikes that inhibition can influence the trajectory of membrane potential in the two cells. To study this explicitly, we considered the fraction of spike pairs falling into the synchronous range in a given trial as a function of the ratio of the inhibitory decay time constant to the mean ISI of the cells (τDecay/ISI). According to general scaling principles, this inhibitory ratio should determine the capacity of the network to generate synchrony, regardless of whether the two variables (τDecay and ISI) are both large or both small. Indeed, we found that this ratio was positively correlated with the tendency of the network to generate synchronous action potentials (Fig. 4A). Because χ0 ≤ φ < 0.1 cannot be greater than unity, we fit a function of the form 1 - Ae-Bx to the data of Figure 4A, where x = τDecay/ISI, and both parameters A (0.94) and B (0.53) indicate the sensitivity of the network to changes in τDecay/ISI within the parameter ranges tested.
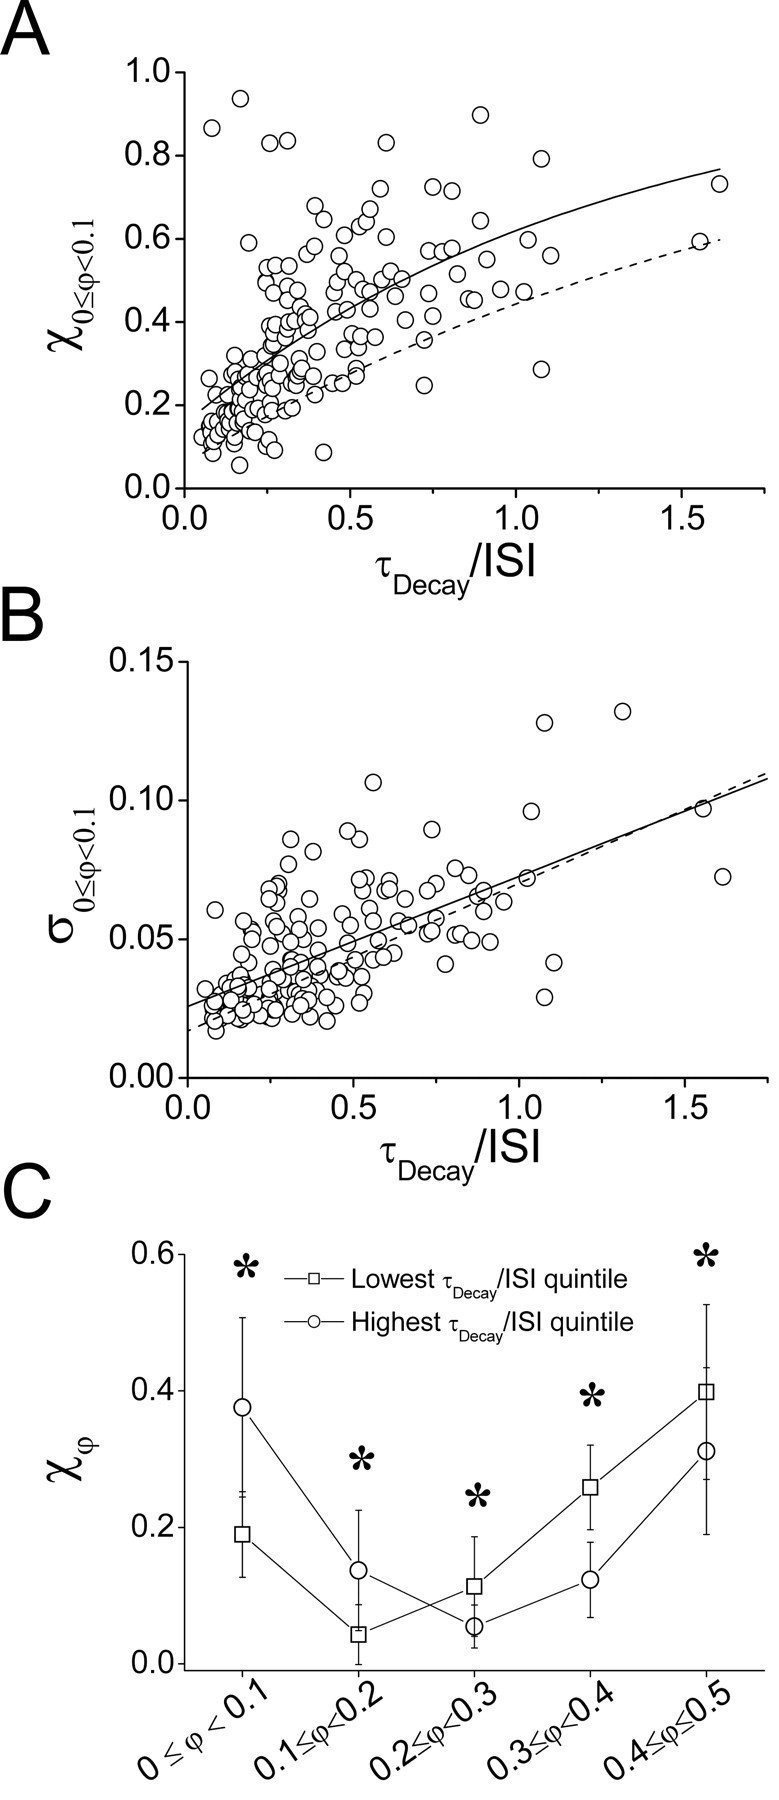
Figure 4.
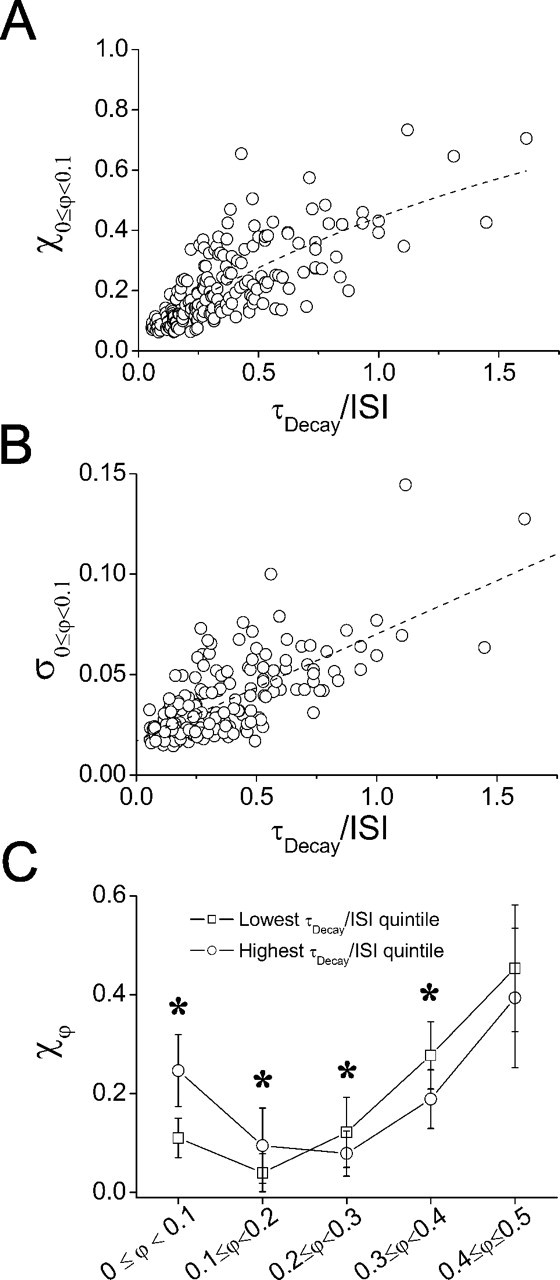
Network synchrony and spike variability increase with τDecay/ISI. A, Fraction of spike pairs in the synchronous phase range (χ0 ≤ φ < 0.1) for each trial (n = 191) as a function of the ratio of synaptic conductance τDecay to mean ISI in the network. See Results for exponential fit parameters. B, SD (within trials) of spike pairs occurring in the synchronous phase range (σ0 ≤ φ < 0.1) as a function of the ratio of synaptic conductance τDecay to mean ISI in the network. Linear fit has slope = (5.32 ± 0.407) × 10-2, y-intercept = (1.70 ± 0.181) × 10-2; p < 0.0001. C, Mean ± SD of normalized phase-range distributions for all pairs tested (n = 26) in the highest (○) and lowest (□) quintiles of τDecay/ISI (38 trials each). The asterisks a indicate a significant difference between quintiles (p < 0.05; Tukey's post hoc test).
To assess the variability of spike pairs falling into the synchronous range, we obtained SD values for the distribution of spike pairs in the range 0 ≤ φ < 0.1 for each coupled trial (σ0 ≤ φ < 0.1). An increase in σ0 ≤ φ < 0.1 accompanied the enhancement of synchrony as the inhibitory ratio was increased (Fig. 4B), indicating that although faster firing rates and slower inhibitory decay times promoted spiking near synchrony, they also decreased the precision of this synchrony. In contrast, the SD of antisynchronous spike-pair phase differences exhibited a small but significant decrease with an increasing inhibitory ratio (linear regression slope, -0.0159; correlation coefficient, -0.14; p < 0.01; data not shown).
To summarize the phase-distribution of spike pairs in two-cell networks coupled by inhibition, and the importance of the inhibitory ratio to this distribution, we averaged the fraction of spike pairs occurring in each phase range across multiple cell pairs and compared network behavior within quintiles of the mean values of τDecay/ISI observed for each trial. These average distributions confirmed that although antisynchrony was the most common state of the network under inhibitory coupling, networks operating within the highest quintile of τDecay/ISI yielded more synchrony than did those operating within the lowest quintile (Fig. 4C). Furthermore, this promotion of synchronous firing behavior was accompanied by an increase in the incidence of firing in the near-synchronous phase range and a decrease in the incidence of firing in the middle and near-antisynchronous phase ranges (Fig. 4C). There were significant effects of τDecay/ISI on the fraction of spike pairs in each phase range (one-way ANOVA with each phase range tested separately; 0 ≤ φ < 0.1: F(4,186) = 33.02; p < 0.001; 0.1 ≤ φ < 0.2: F(4,186) = 12.94; p < 0.001; 0.2 ≤ φ < 0.3: F(4,186) = 6.557; p < 0.001; 0.3 ≤ φ < 0.4: F(4,186) = 17.34, p < 0.001; 0.4 ≤ φ < 0.5: F(4,186) = 3.558; p < 0.01). Post hoc tests showed that there were significant differences between the highest and lowest quintiles of τDecay/ISI for the synchronous, near-synchronous, and near-antisynchronous phase ranges but not for the antisynchronous phase range (Fig. 4C).
Network activity in cell pairs coupled by electrical synapses
Electrical coupling without inhibition did not produce the bistable network activity observed under mutual inhibition but instead promoted the synchronous state exclusively in 24 of 26 pairs (Fig. 5A-D). Although the degree to which synchrony was promoted by electrical coupling varied considerably from pair to pair (Fig. 5D), it was not rate dependent (Fig. 5E).
Figure 5.
Electrical coupling promotes synchrony in LI networks. A, Sample voltage and current traces from a pair of spiking cells when they are uncoupled (left) and electrically coupled (right). Vertical scale bar: 40 mV, 70 pA; horizontal scale bar, 50 ms. B, Normalized phase (φ) histograms for entire trials in each coupling regimen (columns arranged as in A). C, Raster plot of φ between neighboring spikes for each coupling regimen (columns arranged as in A and B) according to the time in which they occurred during the trial. D, Fraction of spike pairs falling into the synchronous phase range (χ0 ≤ φ < 0.1) for pairs that are uncoupled and electrically coupled (61 trials from 26 cell pairs; trend lines show same-rate, within-pair comparisons). E, Fractional change in synchrony from uncoupled to electrically coupled (Δχ0 ≤ φ < 0.1; samerate, within-pairs comparisons). Note that this change is not rate dependent (n = 61 trials).
When inhibitory and electrical coupling were combined, the bistable firing pattern observed under mutual inhibition was, once again, observed, but with an increased incidence of synchrony for all values of τDecay (Fig. 6). To quantify this promotion of the synchronous state, we examined how the relationship between χ0 ≤ φ < 0.1 and the τDecay/ISI ratio was altered by the addition of electrical coupling between the cells. Electrical coupling changed the sensitivity of the network to changes in τDecay/ISI, as measured by the parameter B in the fit of 1 - Ae-Bx to the data (B = 0.80, compared with 0.53 with inhibition alone), and increased the average amount of synchrony achieved for any given rate and decay time, as measured by the parameter A (0.84, compared with 0.94 with inhibition alone) (Fig. 7A). An increase in the variability of synchronous range spike-pairs as a function of τDecay/ISI was observed, similar to the case of inhibitory coupling alone (Fig. 7B). Thus, combining electrical with inhibitory coupling in these networks resulted in a promotion of synchrony with little effect on its precision. Average phase distributions showed a promotion of synchrony when the cells were electrically coupled similar to the case of inhibition alone, with synchrony becoming as prevalent as antisynchrony in the highest range of τDecay/ISI (Fig. 7C). A one-way ANOVA showed significant effects of τDecay/ISI on the fraction of spike pairs in each phase range (phase ranges were tested separately; 0 ≤ φ < 0.1; F(4,155) = 16.83, p < 0.001; 0.1 ≤ φ < 0.2; F(4,155) = 18.01, p < 0.001; 0.2 ≤ φ < 0.3: F(4,155) = 7.030, p < 0.001; 0.3 ≤φ < 0.4; F(4,155) = 23.77, p < 0.001; 0.4 ≤ φ < 0.5; F(4,155) = 4.888; p < 0.01). Post hoc tests showed that there were significant differences between the highest and lowest quintiles of τDecay/ISI for all phase ranges (Fig. 7C).
Figure 6.
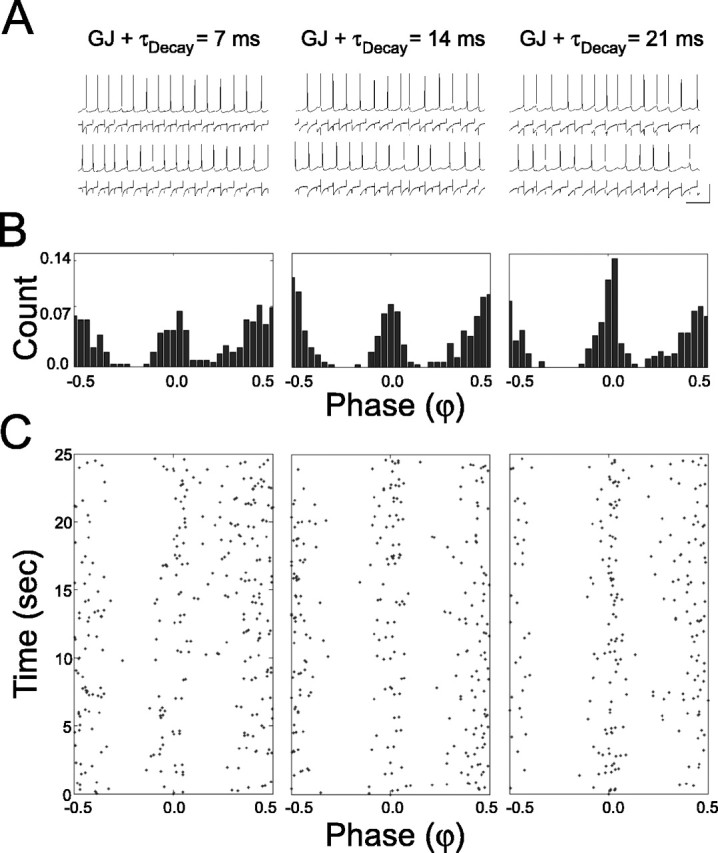
Combined electrical and inhibitory coupling yields bistability with enhanced synchrony. A, Sample voltage and current traces from a pair of cells when they are mutually coupled by both gap junctions and inhibitory synapses with τDecay = 7 ms (left), 14 ms (middle), and 21 ms (right). Vertical scale bar: 40 mV, 55 pA; horizontal scale bar, 100 ms. B, Phase (φ) histograms for entire trials in each coupling regimen (same as top). C, Raster plot of φ between neighboring spikes in each coupling regimen (same as top and middle) according to the time in which they occurred during the trial.
Figure 7.
Combined electrical and inhibitory coupling enhances synchrony. A, Fraction of spike pairs in the synchronous phase range (χ0 ≤ φ < 0.1) for each trial (n = 150) as a function of the ratio of synaptic conductance τDecay to mean ISI in the network. The solid line is the exponential fit to these data. See Results for fit parameters. The dashed line is the fit to data from cell pairs coupled with inhibition only, from Figure 4 A. B, SD (within trials) of spike pairs occurring in the synchronous phase range as a function of the ratio of synaptic conductance τDecay to mean ISI in the network. The solid line linear fit has a slope = (4.69 ± 0.454) ×10-2, y-intercept = (2.58 ± 0.224) × 10-2 (p < 0.0001). The dashed line is the linear fit to data from cell pairs coupled with inhibition only, from Figure 4 B. C, Mean ± SD of normalized phase-range distributions for all pairs tested (n = 23) in the highest (○) and lowest (□) quintiles of τDecay/ISI (30 trials each). The asterisks indicate a significant difference between quintiles (p < 0.05; Tukey's post hoc test).
Temporal dynamics of bistable networks
Most computational studies of mutually inhibitory cells have been deterministic (noise free) by design, yielding a single steady state that can be predicted, either numerically or analytically, by the initial phase condition of the network (van Vreeswijk et al., 1994; Lewis and Rinzel, 2003). The activity of biological cells, however, is subject to both intrinsic and extrinsic sources of noise. Throughout the course of trials in which LI cells were coupled by inhibition, φ alternated between the synchronous and antisynchronous ranges, assuming values outside of either range as well. Because φ did not coalesce to a single phase range but varied stochastically over time, we wanted to measure the stability of the synchronous and antisynchronous phase ranges and to characterize transitions between them over time.
To measure the stability of the synchronous and antisynchronous phase ranges, we counted clusters of spike pairs occurring consecutively in either range (Fig. 8A) and computed the likelihood that a synchronous or antisynchronous spike pair was part of a cluster of n such spike pairs. The probability that a cluster of size n would occur decreased with constant fractional decrement as cluster size increased (Fig. 8B), as in a geometric series of the form PR(n) = ρRn, (0 < ρR < 1), where PR(n) is the probability that a given φ value in phase range R is part of a cluster of n such φ values and ρR is the constant coefficient of decrement as n increases. Because ρR is between 0 and 1, the series PR(n) decreases exponentially, and log(PR(n)) decreases linearly with slope = log(ρR). Such linearity was evident in logarithmic plots of cluster distribution for both the synchronous (Fig. 8 B, left) and antisynchronous (Fig. 8 B, right) states, although antisynchrony was the more stable of the two (note the difference in vertical scale for the antisynchronous versus synchronous cluster plots in Fig. 8 B).
Figure 8.
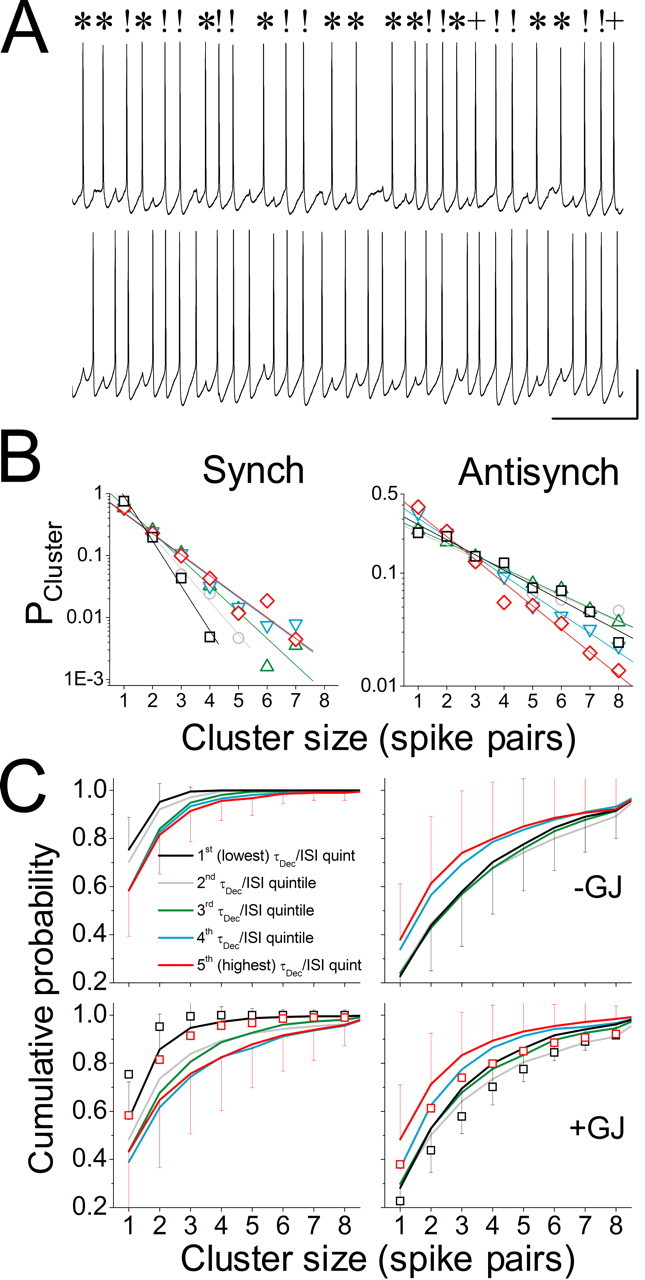
Stability of the synchronous and antisynchronous states has a geometric distribution and depends on both τDecay/ISI and the presence of electrical coupling. A, Sample voltage trace containing clusters of consecutively synchronous and consecutively antisynchronous spike pairs in a bistable LI network. The symbols!, *, and + denote synchronous, antisynchronous, and “intermediate” (neither synchronous nor antisynchronous) spike pairs, respectively. Calibration: 20 mV, 200 ms. B, The probability that spike pairs falling into the synchronous (Synch; left) or antisynchronous (Antisynch; right) phase ranges belong to clusters of n such spike pairs (n = 1,..., 9) for different quintiles of τDecay/ISI [first (lowest) quintile is in black, second quintile is in gray, third quintile is in green, fourth quintile is in cyan, fifth (highest) quintile is in red]. This stability measure was normalized to the total number of clusters occurring in the range for each trial, so that it was independent of the overall frequency with which the range was entered. C, Cumulative distribution functions for the probability that spike pairs belong to clusters of size n, averaged across all trials in each quintile of τDecay/ISI [first (lowest) quintile is in black, second quintile is in gray, third quintile is in green, fourth quintile is in cyan, fifth (highest) quintile is in red]. The top row shows distributions for cell pairs coupled by inhibition alone, and the bottom row shows distributions for cell pairs coupled by combined inhibition and electrical coupling (+GJ). Clusters of synchronous spike pairs are shown on the left, and clusters of antisynchronous spike pairs are shown on the right. For clarity, error bars (SD) are shown only for the first and fifth quintiles. Note shifts toward greater stability of the synchronous state (leftward shift of distributions) and less stability of the antisynchronous state (rightward shift of distributions) as τDecay/ISI increases. For comparison, the data for the first and fifth quintiles for inhibition alone are replotted as black and red open squares, respectively, in the bottom two panels. Note shifts toward greater stability of the synchronous state and less stability of the antisynchronous state for the case of combined coupling versus inhibition alone (compare open squares and solid lines for first and fifth quintiles).
The coefficient of decrement, ρR, was altered by changes in τDecay/ISI, with increases in τDecay/ISI corresponding, in general, to increases in the stability of the synchronous state and decreases in the stability of the antisynchronous state (Fig. 8B). To investigate how the distributions of synchronous and antisynchronous cluster sizes change as a function of the ratio τDecay/ISI, we computed the cumulative distribution function of synchronous and antisynchronous cluster sizes for each trial and averaged these functions across all trials within quintiles of the inhibitory ratio (n = 191 trials for inhibition alone; n = 160 trials for inhibition with electrical coupling) (Fig. 8C). In all cases, the highest and lowest quintiles differed significantly from each other (p < 0.01; Kolmogorov-Smirnov test), with synchronous cluster size increasing and antisynchronous cluster size decreasing, as τDecay/ISI increased. Similar results were obtained for inhibitory coupling and combined inhibitory and electrical coupling (Fig. 8C). As expected, the addition of electrical coupling led to greater stability of the synchronous state, as indicated by the larger synchronous cluster sizes (i.e., rightward shift of cumulative distribution function) and smaller antisynchronous cluster sizes (i.e., leftward shift of cumulative probability function), compared with inhibition alone (Fig. 8C) [the data for inhibition alone are replotted for the first and fifth quintiles of τDecay/ISI as open squares in the bottom two panels (i.e., compare black squares with black solid line and red squares with red solid line in bottom left and bottom right panels)].
To characterize the transitions between the synchronous and antisynchronous states, we computed the fraction of such transitions occurring in n steps for n = 1, 2,..., 9. One-step transitions consisted of an instantaneous switch from one stable state at the ith spike pair in the trial to the other stable state at the (i + 1)th spike pair, whereas two-step transitions consisted of one stable state at the ith spike pair, followed by an intermediate phase value (0.1 ≤ φ < 0.4) at the (i + 1)th spike pair, and finally the other stable state at the (i + 2)th spike pair. Thus, every n step transition consisted of a chain of n - 1 intermediate φ values linking one stable φ value to another (Fig. 9A). The probability distribution of these transition lengths was described by a decreasing geometric series much like that describing the stability of the two stable states, with the frequency of n step transitions decrementing by a constant coefficient for increasing values of n (data not shown).
Figure 9.
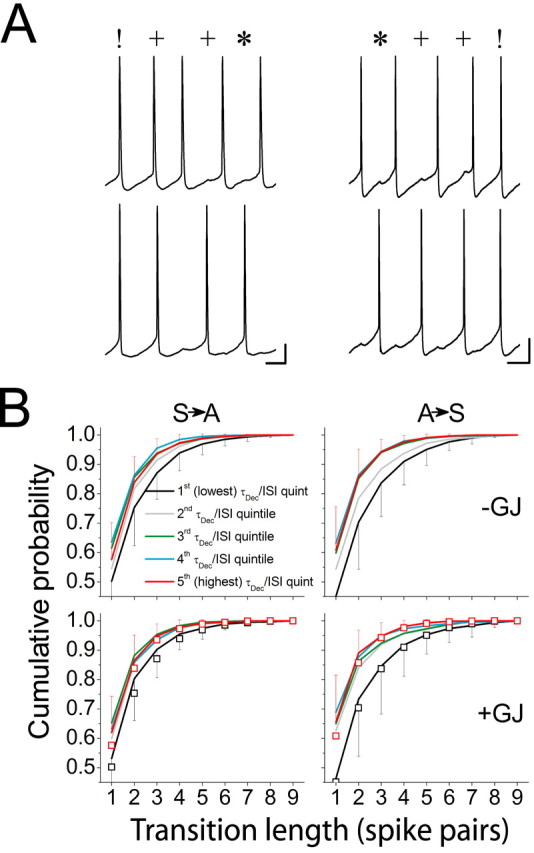
Length of transitions between stable states depends on τDecay/ISI. A, Sample voltage traces of a three-step transition from synchrony to antisynchrony (left) and a three-step transition from antisynchrony to synchrony (right) (different cell pairs in the traces). The symbols!, *, and + denote synchronous, antisynchronous, and “intermediate” spike pairs, respectively. Calibration: 10 mV, 50 ms (left) and 20 ms (right). B, Cumulative distribution functions for the probability that phase transitions occur in n steps (n = 1, 2,..., 9) averaged across all trials in each quintile of τDecay/ISI [first (lowest) quintile is in black, second quintile is in gray, third quintile is in green, fourth quintile is in cyan, fifth (highest) quintile is in red]. The top row shows distributions for cell pairs coupled by inhibition alone, and the bottom row shows distributions for cell pairs coupled by combined inhibition and electrical coupling (+GJ). Transitions from the synchronous to antisynchronous state (S→A) are shown on the left, and transitions from the antisynchronous to synchronous state (A→S) are shown on the right. For clarity, error bars (SD) are shown only for the first and fifth quintiles. In the bottom row, open symbols represent the distributions for the first and fifth quintiles without electrical coupling replotted from the top row for comparison. Note shifts toward more abrupt transitions (leftward shift of distributions) as τDecay/ISI increases. Note also that gap junctions have little effect on transition length (compare open symbols and corresponding solid lines in the bottom row).
Transitions from synchrony to antisynchrony required fewer steps than did transitions from antisynchrony to synchrony, but electrical coupling did not alter transition probabilities for either transition type (Fig. 9B). Networks operating in the highest quintile of τDecay/ISI generally had more abrupt shifts from one stable phase state to the other, as indicated by the lower incidence of long transitions compared with networks operating in the lowest quintile of τDecay/ISI (Fig. 9B). This is consistent with the observation that the stability of the synchronous state is promoted at the expense of less stable intermediate phase states (Figs. 4C, 7C).
Discussion
Comparison with model networks and previous biological studies
The collective dynamics of mutually inhibitory and electrically coupled neurons has been investigated previously with a variety of analytical and computational approaches (van Vreeswijk et al., 1994; Wang and Buzsaki, 1996; Di Garbo et al., 2002, 2005; Lewis and Rinzel, 2003; Nomura et al., 2003). Such studies have usually predicted that networks of mutually inhibitory neurons will fall into either a synchronous or antisynchronous attractor state, depending on the amplitude and kinetics of inhibitory coupling, as well as on the firing rate of the cells and their initial phase condition. Here, we have taken a direct, experimental approach to determine the extent to which these activity patterns are realized in pairs of biological neurons, using a dynamic-clamp system to couple pairs of interneurons in brain slices of the ACx. As with deterministic models, we found that mutually inhibitory networks had two preferred states: one synchronous (phase lag, ∼ 0) and the other antisynchronous (phase lag, ∼ 0.5). Consistent with several of the modeling studies, we found that either increasing the firing rate or prolonging inhibition stabilizes the synchronous state (van Vreeswijk et al., 1994; Di Garbo et al., 2002, 2005; Lewis and Rinzel, 2003; Nomura et al., 2003). Because the basis for these preferred states has been shown in several different models to be a one-dimensional dynamical system with two stable fixed points, we conclude that the bimodal phase distribution we observed in mutually inhibitory cells was most likely generated by such a system. Although it is not possible to assess the stability of the points φ = ∼0 and φ = ∼0.5 in our experimental system analytically, our results are what one would predict in the case of a bistable system with noise. Thus, although the dynamics underlying these LI networks remain unknown, their behavior is best described as “bistable.”
Electrically coupled model networks usually predict that gap junctions will enhance synchronous firing in a population, although, in some cases, electrical coupling alone has produced bistability and/or antisynchronous phase-locking in models (Chow and Kopell, 2000; Di Garbo et al., 2002; Lewis and Rinzel, 2003; Pfeuty et al., 2003). We found that electrical coupling enhanced synchrony in networks of LI cells, both in the presence and in the absence of inhibitory coupling. Because gap-junction coupling has been shown only to promote antisynchrony in model networks when the suprathreshold component of this coupling was relatively small, we conclude that for the electrical coupling parameters we used, which were based on recordings made from biologically coupled LI cells, the spikes that LI cell pairs generated gave a large enough suprathreshold component to the electrical conductance as to promote synchrony only. This result is consistent with studies of biological gap-junction coupling between cortical cells in vitro (Gibson et al., 1999, 2005; Tamas et al., 2000; Galarreta and Hestrin, 2001; Szabadics et al., 2001; Traub et al., 2001).
A recent study of interneurons coupled by inhibitory chemical synapses and/or gap junctions in LIV of the somatosensory cortex showed that mutually inhibitory networks in this region usually exhibit antisynchrony, but when coupled with both gap junctions and inhibitory chemical synapses, they usually exhibit synchrony (Gibson et al., 2005). As with deterministic models, these LIV networks coalesce to a single phase state during individual trials. In contrast to somatosensory LIV networks and modeling studies, pairs of LI interneurons in the ACx alternated between their two favored states frequently during each trial and did not display precise synchrony or antisynchrony (i.e., φ ≡ 0 or φ ≡ 0.5) but instead yielded two distinct phase ranges centered about φ =∼0 and φ = ∼0.5, respectively. This difference in the stability and precision of phase may be attributable to differences in the relative contributions of intrinsic membrane noise and coupling strengths, because noise can perturb a bistable network out of the basin of attraction of either stable state, but strong coupling can overcome noise to reinforce the stability of one state or the other. Indeed, electrical coupling in LIV somatosensory networks was reported to be severalfold stronger than in LI networks of the ACx (Fig. 1) (Gibson et al., 1999; Chu et al., 2003). The considerable heterogeneity of membrane and firing properties in LI of the ACx also may contribute to the inability of these networks to remain in a single stable state for long periods.
Temporal evolution and stability of network phase states
Because LI networks alternated between two states stochastically, the time evolution of φ during these trials was a novel subject of consideration. We found that the temporal stability of the synchronous and antisynchronous phase ranges was described by a decrementing geometric series, with the constant factor of decrement being the probability that φ would remain in the range of the state once the range had been entered (Fig. 7B). Because this probability was constant regardless of how many consecutive previous spike pairs had occurred within the range, the time evolution of φ in these networks was essentially memoryless beyond one step, such that the phase state of the network at any spike pair in the trial was only dependent on the phase state at the immediately preceding spike pair. This property satisfies the Markov condition of random processes, hence the time evolution of φ appears to be a Markov process (i.e., a “random walk” that is described completely by a fixed set of one-step transition probabilities). This was also supported by the observation that the number of unstable intermediate spike pairs occurring in the transition from one stable state to the other also had a distribution characteristic of a geometric series (data not shown).
The observation that LI networks are memoryless suggests that although interneuronal networks in LI have an intrinsic capacity to generate phase-locked oscillatory output, they cannot generate complex temporal firing patterns and may have limited capacity to reflect such patterns even if some are present in the inputs to this layer. Previous in vivo studies suggest that responses of cells in the thalamus that project to LI have poor representations of frequency and time information in the acoustic stimuli (Hu, 2003). Thus, activation of the afferent inputs to LI may reflect changes in the internal state rather than features of the external environment, and networks in this layer may be uniquely suited to modulating or constraining the firing of pyramidal cells with simple inhibitory oscillations. This is consistent with the observation that afferents selectively targeting LI trigger γ oscillations in the ACx (Brett and Barth, 1997).
Implications for cortical function and its disruption
Our results suggest that the modulation of GABAA-mediated IPSCs by endogenous or exogenous agents, such as anesthetic agents, can significantly alter the stability of the synchronous phase state in LI. They also suggest that, in the absence of GABAA receptor modulation, stronger excitatory inputs to LI can induce synchronous firing more readily than weaker inputs can.
Given these results, one might predict that in the non-anesthetized state, LI can respond to large, transient excitatory inputs with a brief period of synchronous firing, thereby synchronizing the activity of widespread cortical targets. Temporal binding mechanisms of this kind offer one possible mechanism by which the cortex might integrate information within and across sensory modalities (Engel and Singer, 2001). LI is also postulated to participate in “event holding” (Vogt, 1991), in which the responses of pyramidal cells in LII-VI to sensory input are temporally amplified by synaptic activation of their distal dendritic tufts in LI when the stimuli are novel or particularly salient. Interneuronal networks in LI might contribute to event holding by entraining the pattern of excitation in these dendritic compartments into a synchronized oscillation, both within and between distinct pyramidal cells. The synchronization properties of LI networks elucidated here, combined with the distinct anatomy of cells in this layer, suggest that LI could play significant roles in such mechanisms.
We found that prolonging the decay time of GABAA receptor-mediated IPSCs allowed more modest amounts of excitation to generate synchronous firing in LI. Because anesthetic agents can greatly suppress the activity of thalamocortical cells (Detsch et al., 1999; Ries and Puil, 1999; Alkire et al., 2000), we predict that in the anesthetized state, LI will respond to this reduced excitation with unusually slow patterns of synchronous inhibition onto its targets over a relatively long time course. Indeed, this may represent the cellular mechanism for the observation that moderate doses of anesthetic agents increase power in the α and β frequency bands (10-30 Hz) recorded from the frontal cortex in the EEG (Gugino et al., 2001). Instead of binding the activity of multiple cortical targets, this inhibition could disrupt the ability of pyramidal cells in the ACx to represent features of the acoustic environment by entraining them into an oscillatory firing pattern not amenable to sensory coding, temporal binding, or event holding. Thus, LI may play a significant role in both generating and, in the case of general anesthesia, disrupting cortical representations of the external environment.
Footnotes
This work was supported by National Institutes of Health Grants DC006013 (to M.I.B.) and NS34425 (to J. A. White and M.I.B.) and by the Department of Anesthesiology, University of Wisconsin (Madison, WI). We thank Yakov Verbny, Caitlin Cotter, Michael Rummel, and Abigail Schuh for technical support and Robert A. Pearce and Nancy Kopell for comments on this manuscript.
Correspondence should be addressed to Dr. Matthew I. Banks, Department of Anesthesiology, University of Wisconsin, 1300 University Avenue, Room 4605, Madison, WI 53706. E-mail: mibanks@wisc.edu.
Copyright © 2005 Society for Neuroscience 0270-6474/05/256175-12$15.00/0
References
- Alkire MT, Haier RJ, Fallon JH (2000) Toward a unified theory of narcosis: brain imaging evidence for a thalamocortical switch as the neurophysiologic basis of anesthetic-induced unconsciousness. Conscious Cogn 9: 370-386. [DOI] [PubMed] [Google Scholar]
- Antkowiak B (2001) How do general anaesthetics work? Naturwissenschaften 88: 201-213. [DOI] [PubMed] [Google Scholar]
- Baker PM, Pennefather PS, Orser BA, Skinner FK (2002) Disruption of coherent oscillations in inhibitory networks with anesthetics: role of GABAA receptor desensitization. J Neurophysiol 88: 2821-2833. [DOI] [PubMed] [Google Scholar]
- Banks MI, Pearce RA (1999) Dual actions of volatile anesthetics on GABAA IPSCs: dissociation of blocking and prolonging effects. Anesthesiology 90: 120-134. [DOI] [PubMed] [Google Scholar]
- Banks MI, Li T-B, Pearce RA (1998) The synaptic basis of GABAA,slow J Neurosci 18: 1305-1317. [DOI] [PMC free article] [PubMed] [Google Scholar]
- Beierlein M, Gibson JR, Connors BW (2000) A network of electrically coupled interneurons drives synchronized inhibition in neocortex. Nat Neurosci 3: 904-910. [DOI] [PubMed] [Google Scholar]
- Brett B, Barth DS (1997) Subcortical modulation of high-frequency (gamma band) oscillating potentials in auditory cortex. J Neurophysiol 78: 573-581. [DOI] [PubMed] [Google Scholar]
- Chow CC, Kopell N (2000) Dynamics of spiking neurons with electrical coupling. Neural Comp 12: 1643-1678. [DOI] [PubMed] [Google Scholar]
- Chu Z, Galarreta M, Hestrin S (2003) Synaptic interactions of late-spiking neocortical neurons in layer 1. J Neurosci 23: 96-102. [DOI] [PMC free article] [PubMed] [Google Scholar]
- Cobb SR, Buhl EH, Halasy K, Paulsen O, Somogyi P (1995) Synchronization of neuronal activity in hippocampus by individual GABAergic interneurons. Nature 378: 75-78. [DOI] [PubMed] [Google Scholar]
- Cruikshank SJ, Rose HJ, Metherate R (2001) Auditory thalamocortical synaptic transmission in vitro. J Neurophysiol 87: 361-384. [DOI] [PubMed] [Google Scholar]
- Detsch O, Vahle-Hinz C, Kochs E, Siemers M, Bromm B (1999) Isoflurane induces dose-dependent changes of thalamic somatosensory information transfer. Brain Res 829: 77-89. [DOI] [PubMed] [Google Scholar]
- Di Garbo A, Barbi M, Chillemi S (2002) Synchronization in a network of fast-spiking interneurons. Biosystems 67: 45-53. [DOI] [PubMed] [Google Scholar]
- Di Garbo A, Panarese A, Chillemi S (2005) Gap junctions promote synchronous activities in a network of inhibitory interneurons. Biosystems 79: 91-99. [DOI] [PubMed] [Google Scholar]
- Dorval AD, Christini DJ, White JA (2001) Real-time linux dynamic clamp: a fast and flexible way to construct virtual ion channels in living cells. Ann Biomed Eng 29: 897-907. [DOI] [PubMed] [Google Scholar]
- Engel AK, Singer W (2001) Temporal binding and the neural correlates of sensory awareness. Trends Cogn Sci 5: 16-25. [DOI] [PubMed] [Google Scholar]
- Faulkner HJ, Traub RD, Whittington MA (1998) Disruption of synchronous gamma oscillations in the rat hippocampal slice: a common mechanism of anaesthetic drug action. Br J Pharmacol 125: 483-492. [DOI] [PMC free article] [PubMed] [Google Scholar]
- Firestone LL, Miller JC, Miller KW (1986) Tables of physical and pharmacological properties of anesthetics. In: Molecular and cellular mechanisms of anesthetics (Roth SH, Miller KW, eds), pp 455-470. New York: Plenum Medical Book Company.
- Galarreta W, Hestrin S (1999) A network of fast-spiking cells in the neocortex connected by electrical synapses. Nature 402: 72-75. [DOI] [PubMed] [Google Scholar]
- Galarreta M, Hestrin S (2001) Spike transmission and synchrony detection in networks of GABAergic interneurons. Science 292: 2295-2299. [DOI] [PubMed] [Google Scholar]
- Gibson JR, Beierlein M, Connors BW (1999) Two networks of electrically coupled inhibitory neurons in neocortex. Nature 402: 75-79. [DOI] [PubMed] [Google Scholar]
- Gibson JR, Beierlein M, Connors BW (2005) Functional properties of electrical synapses between inhibitory interneurons of neocortical layer 4. J Neurophysiol 93: 467-480. [DOI] [PubMed] [Google Scholar]
- Gugino LD, Chabot RJ, Prichep LS, John ER, Formanek V, Aglio LS (2001) Quantitative EEG changes associated with loss and return of consciousness in healthy adult volunteers anaesthetized with propofol or sevoflurane. Br J Anaesth 87: 421-428. [DOI] [PubMed] [Google Scholar]
- Hagan CE, Pearce RA, Trudell JR, MacIver MB (1998) Concentration measures of volatile anesthetics in the aqueous phase using calcium sensitive electrodes. J Neurosci Methods 81: 177-184. [DOI] [PubMed] [Google Scholar]
- Hestrin S, Armstrong WE (1996) Morphology and physiology of cortical neurons in layer I. J Neurosci 16: 5290-5300. [DOI] [PMC free article] [PubMed] [Google Scholar]
- Hu B (2003) Functional organization of lemniscal and nonlemniscal auditory thalamus. Exp Brain Res 153: 543-549. [DOI] [PubMed] [Google Scholar]
- John ER (2002) The neurophysics of consciousness. Brain Res Rev 39: 1-28. [DOI] [PubMed] [Google Scholar]
- Jones MV, Harrison NL (1993) Effects of volatile anesthetics on the kinetics of inhibitory postsynaptic currents in cultured rat hippocampal neurons. J Neurophysiol 70: 1339-1349. [DOI] [PubMed] [Google Scholar]
- Kawaguchi Y, Kubota Y (1997) GABAergic cell subtypes and their synaptic connections in rat frontal cortex. Cereb Cortex 7: 476-486. [DOI] [PubMed] [Google Scholar]
- Lewis TJ, Rinzel J (2003) Dynamics of spiking neurons connected by both inhibitory and electrical coupling. J Comput Neurosci 14: 283-309. [DOI] [PubMed] [Google Scholar]
- Lu T, Liang L, Wang X (2001) Temporal and rate representations of time-varying signals in the auditory cortex of awake primates. Nat Neurosci 4: 1131-1138. [DOI] [PubMed] [Google Scholar]
- Markram H, Toledo-Rodriguez M, Wang Y, Gupta A, Silberberg G, Wu CZ (2004) Interneurons of the neocortical inhibitory system. Nat Rev Neurosci 5: 793-807. [DOI] [PubMed] [Google Scholar]
- Mashour GA (2004) Consciousness unbound—toward a paradigm of general anesthesia. Anesthesiology 100: 428-433. [DOI] [PubMed] [Google Scholar]
- Metherate R, Cruikshank SJ (1999) Thalamocortical inputs trigger a propagating envelope of gamma-band activity in auditory cortex in vitro. Exp Brain Res 126: 160-174. [DOI] [PubMed] [Google Scholar]
- Mickey BJ, Middlebrooks JC (2003) Representation of auditory space by cortical neurons in awake cats. J Neurosci 23: 8649-8663. [DOI] [PMC free article] [PubMed] [Google Scholar]
- Nieuwenhuys R (1994) The neocortex. An overview of its evolutionary development, structural organization and synaptology. Anat Embryol 190: 307-337. [DOI] [PubMed] [Google Scholar]
- Nomura M, Fukai T, Aoyagi T (2003) Synchrony of fast-spiking interneurons interconnected by GABAergic and electrical synapses. Neural Comp 15: 2179-2198. [DOI] [PubMed] [Google Scholar]
- Pfeuty B, Mato G, Golomb D, Hansel D (2003) Electrical synapses and synchrony: the role of intrinsic currents. J Neurosci 23: 6280. [DOI] [PMC free article] [PubMed] [Google Scholar]
- Ries CR, Puil E (1999) Mechanism of anesthesia revealed by shunting actions of isoflurane on thalamocortical neurons. J Neurophysiol 81: 1795-1801. [DOI] [PubMed] [Google Scholar]
- Szabadics J, Lorincz A, Tamas G (2001) β and γ frequency synchronization by dendritic GABAergic synapses and gap junctions in a network of cortical interneurons. J Neurosci 21: 5824-5831. [DOI] [PMC free article] [PubMed] [Google Scholar]
- Tamas G, Buhl EH, Lorincz A, Somogyi P (2000) Proximally targeted GABAergic synapses and gap junctions synchronize cortical interneurons. Nat Neurosci 3: 366-371. [DOI] [PubMed] [Google Scholar]
- Traub RD, Kopell N, Bibbig A, Buhl EH, LeBeau FE, Whittington MA (2001) Gap junctions between interneuron dendrites can enhance synchrony of γ oscillations in distributed networks. J Neurosci 21: 9478-9486. [DOI] [PMC free article] [PubMed] [Google Scholar]
- Traub RD, Bibbig A, Lebeau FEN, Cunningham MO, Whittington MA (2005) Persistent gamma oscillations in superficial layers of rat auditory neocortex: experiment and model. J Physiol (Lond) 562: 3-8. [DOI] [PMC free article] [PubMed] [Google Scholar]
- van Vreeswijk C, Abbott LF, Ermentrout GB (1994) When inhibition not excitation synchronizes neural firing. J Comput Neurosci 1: 313-321. [DOI] [PubMed] [Google Scholar]
- Vogt BA (1991) The role of layer I in cortical function. In: Cerebral cortex (Peters A, Jones EG, eds), pp 49-79. New York: Plenum.
- Wang XJ, Buzsaki G (1996) γ Oscillation by synaptic inhibition in a hippocampal interneuronal network model. J Neurosci 16: 6402-6413. [DOI] [PMC free article] [PubMed] [Google Scholar]
- White JA, Chow CC, Ritt J, Sototrevino C, Kopell N (1998) Synchronization and oscillatory dynamics in heterogeneous, mutually inhibited neurons. J Comput Neurosci 5: 5-16. [DOI] [PubMed] [Google Scholar]
- Whittington MA, Traub RD, Jefferys JG (1995) Synchronized oscillations in interneuron networks driven by metabotropic glutamate receptor activation. Nature 373: 612-615. [DOI] [PubMed] [Google Scholar]
- Whittington MA, Jefferys JG, Traub RD (1996) Effects of intravenous anaesthetic agents on fast inhibitory oscillations in the rat hippocampus in vitro. Br J Pharmacol 118: 1977-1986. [DOI] [PMC free article] [PubMed] [Google Scholar]
- Zhou FM, Hablitz JJ (1996) Morphological properties of intracellularly labeled layer I neurons in rat neocortex. J Comp Neurol 376: 198-213. [DOI] [PubMed] [Google Scholar]