

Abstract
Objectives. We sought to describe Black–White differences in HIV disease mortality before and after the introduction of highly active antiretroviral treatment (HAART).
Methods. Black–White mortality from HIV is described for the nation as a whole. We performed regression analyses to predict county-level mortality for Black men aged 25–84 years and the corresponding Black:White male mortality ratios (disparities) in 140 counties with reliable Black mortality for 1999–2002.
Results. National Black–White disparities widened significantly after the introduction of HAART, especially among women and the elderly. In county regression analyses, contextual socioeconomic status (SES) was not a significant predictor of Black:White mortality rate ratio after we controlled for percentage of the population who were Black and percentage of the population who were Hispanic, and neither contextual SES nor race/ethnicity were significant predictors after we controlled for pre-HAART mortality. Contextual SES, race, and pre-HAART mortality were all significant and independent predictors of mortality among Black men.
Conclusions. Although nearly all segments of the Black population experienced widened post-HAART disparities, disparities were not inevitable and tended to reflect pre-HAART levels. Public health policymakers should consider the hypothesis of unequal diffusion of the HAART innovation, with place effects rendering some communities more vulnerable than others to this potential problem.
In the United States, Blacks have a disproportionate share of mortality from HIV compared with Whites.1–2 Blacks comprised less than 15% of the US population during the course of the epidemic3 but accounted for 39.7% of all cases (368 169 of 928 188) reported through 2003.4 The approval by the US Food and Drug Administration of protease inhibitors for marketing in December 1995 and March 1996 introduced the use of highly active antiretroviral therapy (HAART) for US adults, which has led to significant declines in HIV mortality.5 Rates of decline have been unequal,5–7 however, with mortality rates among Blacks and women remaining high.7
We used multiple strategies to describe national trends in HIV-related mortality among Blacks and Whites before and after the introduction of HAART in 1996 (hereafter referred to as pre-HAART and post-HAART).
METHODS
Data Sources
The Compressed Mortality File (CMF) of the National Center for Health Statistics (NCHS) is a public-domain mortality and population database containing annual national-, state-, and county-level information specific by age, gender, race, and cause.8 As specified by NCHS, we used category codes 042 to 044 of the International Classification of Diseases, Ninth Revision (ICD-9-CM )9,10 for HIV from 1990 to 1998 and category codes B20 to B24 of the International Statistical Classification of Diseases, Tenth Revision (ICD-10)11,12 for 1999 to 2002. In this report, age categories and year-by-year inclusions reflect confidentiality requirements. In addition, we used US Census information (Short Form 3 of the NCHS)13 as presented in Geolytics software (Geolytics Inc, East Brunswick, NJ) for county-level socioeconomic and demographic descriptors and data developed by Neilson14 for the Gini coefficient.
Study Populations
We used national mortality data of all Black and White decedents in the United States from 1990 to 2002. We then reviewed all 3141 US counties, parishes, independent cities, and the District of Columbia to identify those with age-adjusted rates of HIV-disease mortality among Black men (aged 25 years or older) that were certified as reliable by the NCHS (i.e., rates based on at least 20 deaths),8 which uses an open-ended age category for the oldest population group (i.e., 85 years or older); corresponding data for Whites were obtained only for these counties. After 1996, Black:White HIV mortality rate ratios (MRRs) increased until 1998 and remained relatively stable from 1999 to 2002; we used the period 1999 to 2002 (3–6 years after the introduction of HAART) for further analysis. We excluded from this group communities in which HIV-related deaths among Whites aged 25 years and older did not meet confidentiality criteria (at least 6 deaths from HIV) and 1 additional county in which there were too few deaths from HIV in the years 1990 to 1993 to meet confidentiality criteria for Blacks or Whites; data for those years (1990–1993) were used as a predictor for post-HAART mortality in the multivariable analyses. After these exclusions, 140 counties remained. The broad age group allowed inclusion of the greatest possible number of counties. These remaining counties comprised 86% (17317 of 20170) of all HIV-related deaths among Black men in the United States aged 25 years and older and 66% (13903 of 20941) of corresponding deaths among Whites in 1999 to 2002. Numbers of HIV deaths among women were too small to permit efficient analysis.
Outcome Measures
National outcomes.
We compared age- and gender-specific Black : White MRRs and 95% confidence intervals (CIs) before and after the introduction of HAART using 10-year age groups (from 25–34 years to 75–84 years; deaths among those aged 85 years and older were too few to be included in the analyses); we used EpiBasic verson 1.0 (University of Aarhus, Nordre Ringgade, Denmark) for these analyses. As per Smith et al.15 the periods before and after the introduction of HAART are defined as the years before and after 1996. We also calculated the average yearly increase in Black : White MRRs from 1994 to 1998 for these age groups and the percentage change in age-adjusted mortality among Blacks and Black : White MRRs from the period 1990–1993 to 1999–2002.
Initial socioeconomic analyses.
We tested a traditional socioeconomic model (percentage of Black men aged 25 years or older who were not high school graduates, percentage of Blacks with yearly income below the federal poverty line, per capita income among Blacks, Black : White poverty rate ratio [all from the 2000 census], and Gini coefficient [1990]) to predict the Black : White MRR and the mortality rate among Blacks in the years 1999 to 2002 (4 to 6 years post-HAART). Because of multicollinearity, we combined percentage of Black men aged 25 years or older who were not high school graduates, percentage of Blacks with yearly income below the poverty line, and per capita income among Blacks into a socioeconomic index, using the method of Steenland et al.16 Use of this method entailed the following steps: (1) ranking all US counties, parishes, independent cities, and the District of Columbia for each variable; (2) obtaining the rank of each variable for each of the 140 communities; (3) summing ranks for educational attainment, poverty, and the complement of per capita income (so that higher ranks for each element equated with lower socioeconomic status); and (4) dividing the sum derived from step 3 by 3. One specification (used in models 1 and 2) included only cross-sectional sociodemographic factors, whereas the other specification (used in model 3) also included pre-HAART measures of the dependent variables to estimate change between the 2 periods. We performed multivariable analyses to predict Black : White MRRs using ordinary least squares17 and used a negative binomial model to predict the mortality rate among Blacks.18,19 The socioeconomic index was prepared using SPSS version 13 (SPSS Inc, Chicago, Ill).20 Multivariable analyses were performed using SAS software (SAS Institute Inc, Cary, NC).21
Identification of anomalous counties.
We adapted a method proposed by Pearce,22 who described a multistep, iterative method to multivariate models with anomalous case characteristics. Jackknife residual analysis23 identified anomalous counties (i.e., those with Black : White MRRs for HIV that were significantly different from those that would have been predicted on the basis of the socioeconomic model). Jackknife residual analysis was performed with StatsDirect (StatsDirect Ltd, Altrincham, Cheshire, England).24
Identification of new predictors.
The county with the highest Black : White MRR for men aged 25 years and older in the period 1999 to 2002 (Greene County, Mo; MRR = 37.2) was assessed for total population, percentage of the population that was urban, percentage that was Black, percentage that was Hispanic, percentage of the Black population that spoke English poorly or not at all, percentage of Black men aged 18 years or older who were civilian veterans, and percentage of Black households with a telephone. This assessment was made to identify characteristics that were either below the 5th percentile or above the 95th percentile for the 140-county cohort as a whole and that, if added to the purely socioeconomic model (model 1, which included only the socioeconomic index for educational attainment among Blacks, income among Blacks, and poverty among Blacks), might improve the percentage of variance explained as described by Pearce.22 Because Greene County was below the 5th percentile for both percentage of the population who were Black and percentage who were Hispanic, we chose to add these factors to the set of predictors used in model 1.
Repetition of the multivariate analysis.
To refine the socioeconomic model, the variables identified from Greene County in the previous paragraph were added to all of the factors included in the purely socioeconomic model (model 1) to predict age-adjusted Black : White MRRs and mortality rates among Black men in the period 1999 to 2002. Improvement of the model was measured by the percentage of additional variance explained. An F test was used to determine whether the differences in percentage of variance explained by each model were too large to be explained by chance alone.25
Longitudinal analyses.
We provide Black: White male MRRs for 1990 to 2002 in all counties in which the MRR was 2.00 or lower or 15.00 or greater during that period. Regarding the multivariable analyses, we added values for Black:White age-adjusted MRRs and mortality rates from 3 to 6 years before the introduction of HAART (1990–1993) for each county to better describe the role of place in predicting age-adjusted HIV mortality among Black men and the corresponding Black:White MRR in 1999 through 2002. An F test for model improvement was not considered appropriate, because models 1 and 2 were cross-sectional.
Additionally, to understand changes in rate ratios over time, we performed a separate analysis using dummy variables to designate counties with Black : White, age-adjusted male MRRs in the years 1999 to 2002 as either 1 (MRR ≤2.0), 2 (MRR 2.1–15.0) or3 (MRR > 15.0). In these analyses, we compared the slope of the MRR in each classification from the period 1990–1993 to 1999–2002. Finally, for illustration purposes, we tracked the progress of Black : White, age-adjusted HIV disease MRRs and age-adjusted mortality among Black and White men in counties with 1999–2002 MRRs at or above 15 or at or below 2.
Additional analyses.
Although it was not feasible to perform multivariate analyses for women, we calculated Black:White MRRs among women in counties with anomalously high disparities for the years 1999 to 2002 as well as counties at or near equality for those years. We also used the Wilcoxon signed rank test19 to compare the direction of post-HAART changes in MRR for counties with MRRs at or below 2.0 or at or above 15 in the period 1999 to 2002. Additionally, we calculated the percentage change from 1990–1993 to 1999–2002 for both age-adjusted mortality among Black men aged 25 years and older and corresponding values for Black:White MRRs. Finally, we compared national and local age-adjusted (25 years and older) MRRs for AIDS-defining conditions (disparities in mortality from AIDS-related infections including Pneumocystis carinii pneumonia, Mycobacterium infection, toxoplasmosis, and cryptosporidiosis [data not shown])26 in the years immediately before (1994–1995) and after (1997–1998) the introduction of HAART.
RESULTS
National Mortality
Figure 1 ▶ shows Black:White MRRs for the years 1990 to 2002 for men aged 25 to 74 years and for women aged 25 to 64. (Presentation is restricted to 10-year age groups for which reliable data for all years were available.) In nearly all age groups, post-HAART increases in MRR were in place by 1998. Among women, average yearly increases in Black:White MRR by age from 1994 to 1998 were 1.6 (25–34 years), 0.96 (35–44 years), 1.43 (45–54 years), and 1.10 (55–64 years); for men, the values were 0.64 (25–34 years), 0.57 (35–44 years), 1.06 (45–54 years), 1.09 (55–64 years), and 1.20 (65–74 years).
FIGURE 1—
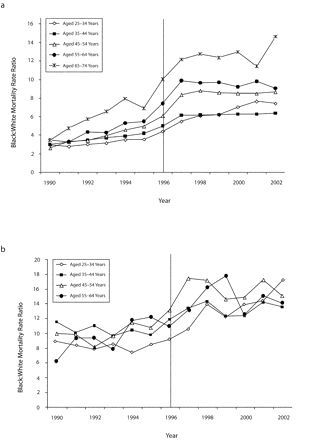
Black-to-White HIV-related mortality rate ratios among (a) men aged 25 to 74 years and (b) women aged 25 to 64 years: United States, 1990 to 2002.
Note. Reporting is restricted to 10-year age groups for which reliable data for all years were available. The horizontal line indicates the introduction of highly active antiretroviral therapy.
Table 1 ▶ shows average pre-HAART (1990–1995) and post-HAART (1997–2002) Black : White MRRs for men and women aged 25 to 84 years. In no case was there overlap in the age-specific 95% confidence intervals for the pre-HAART versus post-HAART period. After the introduction of HAART, all MRRs among women were higher than those in the corresponding age groups among men, and with the exception of persons aged 75 to 84 years, there was no overlap in the 95% confidence intervals.
TABLE 1—
US Black-to-White Mortality Rate Ratios (MRRs) for HIV Before (1990–1995) and After (1997–2002) the Introduction of Highly Active Antiretroviral Treatment (HAART), by Age and Gender
| Before Introduction of HAART (1990–1995) | After Introduction of HAART (1997–2002) | |||||||||
| Blacks | Whites | Blacks | Whites | |||||||
| Age and Gender | Deaths | Person-Years | Deaths | Person-Years | Black : White MRR (95% CI) | Deaths | Person-Years | Deaths | Person-Years | Black : White MRR (95% CI) |
| Men, y | ||||||||||
| 25–34 | 16 993 | 15 734 471 | 36 309 | 106 813 720 | 3.18 (3.12, 3.24) | 5 522 | 15 603 347 | 6 491 | 98 616 176 | 6.36 (6.12, 6.60) |
| 35–44 | 25 212 | 13 323 431 | 52 501 | 101 552 210 | 3.66 (3.61, 3.72) | 12 990 | 16 029 902 | 14 424 | 110 854 080 | 6.23 (6.08, 6.38) |
| 45–54 | 9 864 | 7 953 764 | 22 517 | 71 497 724 | 3.87 (3.77, 3.96) | 9 479 | 11 495 762 | 8 932 | 92 797 298 | 8.57 (8.32, 8.82) |
| 55–64 | 3 036 | 5 454 510 | 6 584 | 52 777 418 | 4.46 (4.27, 4.66) | 2 887 | 6 478 328 | 2 820 | 60 215 541 | 9.52 (9.03, 10.03) |
| 65–74 | 869 | 3 836 740 | 1 660 | 44 085 986 | 6.02 (5.53, 6.53) | 946 | 4 099 302 | 803 | 44 148 054 | 12.69 (11.54, 13.96) |
| 75–84 | 106 | 1 717 205 | 224 | 22 026 171 | 6.07 (4.77, 7.68) | 184 | 1 978 148 | 160 | 26 331 726 | 15.31 (12.32, 19.04) |
| Women, y | ||||||||||
| 25–34 | 5 672 | 17 569 200 | 4 072 | 104 089 262 | 8.25 (7.93, 8.59) | 3 401 | 17 294 748 | 1 406 | 94 635 076 | 13.24 (12.43, 14.09) |
| 35–44 | 6 930 | 15 356 318 | 4 411 | 101 213 489 | 10.35 (9.97, 10.76) | 6 007 | 18 151 026 | 2 730 | 109 713 087 | 13.30 (12.71, 13.92) |
| 45–54 | 2 110 | 9 511 830 | 1 581 | 73 336 535 | 10.29 (9.64, 10.98) | 3 233 | 13 432 221 | 1 430 | 94 357 256 | 15.88 (14.92, 16.91) |
| 55–64 | 701 | 6 967 552 | 584 | 57 389 348 | 9.89 (8.85, 11.05) | 851 | 8 075 059 | 464 | 64 191 326 | 13.57 (12.11, 15.23) |
| 65–74 | 255 | 5 484 261 | 333 | 55 117 359 | 7.70 (6.51, 9.09) | 311 | 5 812 723 | 126 | 52 826 054 | 22.43 (18,24, 27.59) |
| 75–84 | 51 | 3 110 854 | 114 | 35 903 451 | 5.16 (3.64, 7.24) | 70 | 3 527 517 | 58 | 40 063 530 | 15.90 (10.90, 23.34 |
Note. CI = confidence interval. Reporting is restricted to 10-year age groups for which reliable data for all years were available.
County-Level Mortality
Descriptive statistics.
In 1999–2002, the mean SD for age-adjusted mortality from HIV among Black men in the 140-county cohort was 65.1 ±47.2 per 100000 (ranged=15.7/ 100000–332.9/100000). The corresponding value for Black: White MRR was 7.2 ±5.0 per 100000 (range=0.91/100000–37.3/ 100000).
Longitudinal change.
Percentage changes in age-adjusted mortality among Black men and Black : White MRRs varied widely. Among the 140 counties, 118 (84%) experienced a decline in mortality among Blacks; percentage change from pre-HAART (1990–1993) to post-HAART (1999–2002) period, however, ranged from −80% to 325%, with a mean of −25% (95% confidence interval [CI] = −17%, −33%). Correspondingly, 137 counties (98%) experienced an increase in the Black : White MRR; values ranged from −23% to 724%, with a mean of 139% (95% CI = 121%, 157%).
Initial socioeconomic analyses.
Table 2 ▶ shows model predictions of post-HAART (1999–2002) age-adjusted Black : White MRRs for men and corresponding predictions for age-adjusted mortality rates among Black men. The traditional socioeconomic model was statistically significant for Black : White MRR (F = 3.67, P= .01, adjusted r 2 = 5.5%). The Black : White poverty rate ratio (P< .001) and socioeconomic index (P= .001) were significantly associated with Black : White MRR; only socioeconomic index (P< .001) was significantly associated with mortality rate.
TABLE 2—
Hierarchical Regression Models Predicting Black : White Age-Adjusted HIV-Related Mortality Rate Ratios (MRRs) Among Men Aged 25 Years and Older in 140 US Counties After the Introduction of Highly Active Antiretroviral Treatment: 1999–2002
| Predictor | Model 1,Metric Regression Coefficient (SE) | P | Model 2,Metric Regression Coefficient (SE) | P | Model 3,Metric Regression Coefficient (SE) | P |
| Hierarchical regression models | ||||||
| Socioeconomic index (2000) | −0.13 (0.09) | < .001 | −0.02 (0.09) | .83 | −0.07 (0.06) | .24 |
| Gini coefficient (1990) | −0.02 (0.10) | .89 | −0.007 (0.09) | .94 | 0.03 (0.06) | .64 |
| Black : White poverty rate ratio (2000) | 1.36 (0.47) | < .001 | 0.50 (0.54) | .35 | 0.68 (0.38) | .07 |
| % Black residents (2000) | −7.73 (2.93) | .009 | −0.58 (2.13) | .78 | ||
| Hispanic residents (2000), % | −15.16 (4.34) | .001 | −5.64 (3.13) | .07 | ||
| Black : White age-adjusted HIV disease mortality rate ratio for men aged 25 and older (1990–1993) | 1.16 (0.10) | < .001 | ||||
| Adjusted R2, % | 5.5 | 13.1 | 58.0 | |||
| F | 3.67 | .01 | 5.20 | < .001 | 32.63 | < .001 |
Note. Model 1 accounts only for socioeconomic context, including county-level year 2000 US Census values for percentage of the population who were Black men with less than a high school education, percentage of the population who were Black and with incomes below the poverty level, Black per capita income (all included in the socioeconomic index) and Black : White poverty rate ratio, as well as the Gini coefficient (another measure of economic inequality) for 1990. Model 2 adds 2 additional characteristics (percentage of the population who were Black residents and percentage of the population who were Hispanic residents) derived from communities whose Black : White MRRs were statistically greater than that which would have been predicted by model 1. Model 3 includes all of the predictors in models 1 and 2 plus values for Black : White MRRs and Black mortality in 1990 through 1993 (3 to 6 years pre-HAART). Hierarchical regression models predict the Black : White MRRs in 1999–2002 (3 to 6 years post-HAART).
Identification of anomalous counties and new predictors.
There were no counties with anomalously low Black : White MRRs. Greene County, Mo, which had the highest MRR, was deviant because of its low percentages of Blacks and Hispanics (both below the 5th percentile). Ranking 2 through 6 behind Greene County were Forsyth County, North Carolina (MRR = 30.0), Delaware County, Pennsylvania (MRR = 21.9), Monmouth County, New Jersey (MRR = 18.7), and New Castle County, Delaware (MRR = 18.3); these values were also higher than predicted by the socioeconomic model.
Repetition of the multivariate analysis.
When percentage of population that was Black and percentage that was Hispanic were added to the basic socioeconomic model, both were significantly associated with Black : White MRR (the dependent variable), and both were negatively correlated with MRR (P= .009 for percentage of Black residents and P= .001 for percentage of Hispanic residents). None of the socioeconomic factors were significantly associated with the dependent variable. The percentage of variance explained by the model increased to 13.1% (P= .001). For mortality rate among Blacks, only the socioeconomic index was significant (P< .001). All counties with anomalously high MRRs in model 1 also had anomalously high MRRs in model 2. Results for model 3 (in which a longitudinal predictor was added to the factors in model 2) are presented in the following section.
Longitudinal analyses.
Figure 2 ▶ (counties with MRR≤2.0 in 1999–2002) and Figure 3 ▶ (counties with MRR≥15.0 in 1999–2002) illustrate opposite ends of the range of Black:White MRRs for 1999–2002. With the exception of data for Blacks in Gaston County, North Carolina in 1990–1993, and Whites in Gaston and Forsyth Counties, North Carolina in 1999–2002, all data points denote at least 20 deaths; yearly data in these counties, however, are consistent with the 4-year totals.
FIGURE 2—
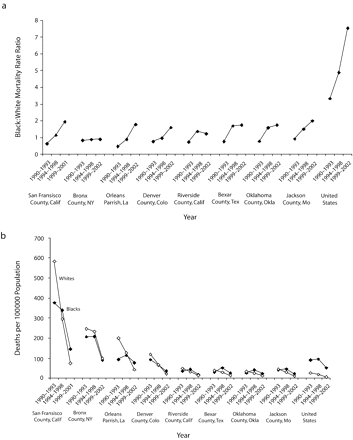
Black:White HIV mortality among men aged 25 years and older in the United States and in US counties with a mortality rate ratio (MRR) of 2.0 or less, by (a) MRRs and (b) race-specific, age-adjusted mortality rates: 1990–2002.
Note. In counties with at least 20 deaths among Blacks from HIV/AIDS.
FIGURE 3—
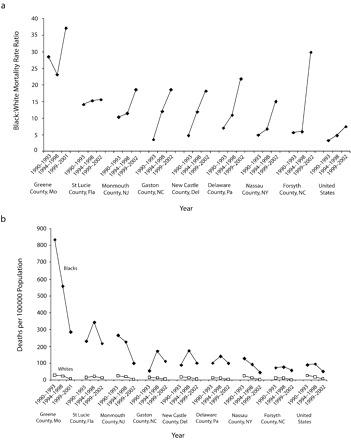
Black:White HIV mortality among men aged 25 years and older in the United States and in US counties with a mortality rate ratio (MRR) of 15.0 or higher, by (a) MRRs and (b) race-specific, age-adjusted mortality rates: 1990–2002.
Note. In counties with at least 20 deaths among Blacks from HIV/AIDS.
In Figure 2 ▶ and Figure 3 ▶, communities at or near Black–White MRR equality or high inequality after the introduction of HAART were also at or near equality or high inequality before its introduction. In all 16 of these communities (Figure 2 ▶ and Figure 3 ▶), pre-HAART (1990–1993) Black : White MRRs were lower than the corresponding post-HAART (1999–2002) values (P < .001). Notably, however, in every county with a post-HAART MRR of 2.0 or less, pre-HAART (1990–1993) HIV mortality among Blacks were lower than those among Whites; the opposite was true for counties in which post-HAART MRRs were 15.0 or above. Finally, there were different patterns for MRRs over time. Patterns for San Francisco County, California, and Orleans Parish, Louisiana, for example, mimic those of the United States as a whole, and Bronx County, New York, follows a unique, nearly horizontal pattern throughout.
Pre-HAART county values for age-adjusted Black : White MRRs were added to produce model 3 in Table 2 ▶, and pre-HAART county values for age-adjusted mortality among Blacks were added to produce model 3 in Table 3 ▶. After we accounted for the pre-HAART MRR—which had a small but highly significant association with the post-HAART MRR (P < .001)—none of the other variables were significantly associated with the post-HAART MRR; the percentage of variance explained increased to 58%. As shown in Table 1 ▶, the percentage of residents who were Black (P ≤.001), the socioeconomic index (P ≤.001), and pre-HAART mortality among Blacks (P < .001) were all significantly associated with post-HAART mortality among Blacks. In contrast to Black : White MRR, there was a statistically significant, positive association between percentage of Black residents and Black mortality in model 3. Further exploration of MRR predictions by classifying counties into 3 groups according to post-HAART MRR (data not shown) showed all classifications increased, and there was no significant difference in the slope from one class to the other. MRR magnitude, however, was higher among counties with MRRs of 15.0 or greater in 1999 to 2002.
TABLE 3—
Multivariate Negative Binomial Models Predicting Black : White and Age-Adjusted HIV-Related Mortality Among Black Men Aged 25 Years and Older in 140 US Counties After the Introduction of Highly Active Antiretroviral Treatment: 1999–2002
| Predictor | Model 1,Parameter Estimate (95% CI) | P | Model 2,Parameter Estimate (95% CI) | P | Model 3,Parameter Estimate (95% CI) | P |
| Multivariate negative binomial models | ||||||
| Socioeconomic index | 1.05 (1.03,1.07) | < .001 | 1.05 (1.03, 1.07) | < .001 | 1.03 (1.01, 1.04) | < .001 |
| Gini coefficient | 0.99 (0.97,1.02) | .64 | 0.99 (0.97, 1.01) | .52 | 1.01 (0.99, 1.02) | .23 |
| Black : White poverty rate ratio | 0.92 (0.84,1.02) | .11 | 0.91 (0.81, 1.01) | .08 | 1.04 (0.96, 1.12) | .32 |
| % Black residents | 1.11 (0.59, 2.09) | .74 | 2.15 (1.40, 3.31) | < .001 | ||
| % Hispanic residents | 0.68 (0.26, 1.76) | .43 | 1.17 (0.62, 2.22) | .62 | ||
| Age-adjusted HIV disease mortality rate among Black men aged 25 years and older (1990–1993) | 1.003 (1.002, 1.004) | < .001 | ||||
Note. CI - confidence interval. Model 1 accounts only for socioeconomic context, including county-level year 2000 US Census values for percentage of the population who were Black men with less than a high school education, percentage of the population who were Black and with incomes below the poverty level, Black per capita income (all included in the socioeconomic index) and Black : White poverty rate ratio, as well as the Gini coefficient (another measure of economic inequality) for 1990. Model 2 adds 2 additional characteristics (percentage of the population who were Black residents and percentage of the population who were Hispanic residents) derived from communities whose Black : White MRRs were statistically greater than that which would have been predicted by model 1. Model 3 includes all of the predictors in models 1 and 2 plus values for Black : White MRRs and Black mortality in 1990 through 1993 (3 to 6 years pre-HAART). Negative binomial regression models predict Black mortality in 1999–2002 (3 to 6 years post-HAART).
Additional analyses.
Pre- and post-HAART disparities for AIDS-defining conditions (data not shown) were small nationally and locally and were inconsistent between counties.
DISCUSSION
HAART became available for use in the United States in 1996.15 In every age and gender group for which reliable data were available, the disparity between pre-HAART (1990–1995) and post-HAART (1997–2002) mortality from HIV was higher for Blacks than for Whites. In addition to the HIV data, the stability of national pre- and post-HAART mortality for AIDS-defining conditions is consistent with the hypothesis that observed pre- and post-HAART changes in mortality rates were because of HAART. If something other than HAART had been responsible for the increased disparities in HIV-related post-HAART mortality, it is reasonable to expect that disparities in AIDS-defining conditions should have increased as well; however, this was not the case. Although these data are largely ecologic and descriptive and cannot test the hypothesis that HAART caused these increased disparities, the information is sufficiently suggestive to support further inquiry.
In these data, the plight of older persons and women is striking. People aged 65 and older experienced the greatest disparities in mortality, particularly after the introduction of HAART. Regarding women, Black women in all age groups had no less than a 13-times greater risk of dying from HIV compared with White women of the same age, and Black women aged 65 to 74 years had more than a 20-times greater risk than did White women of the same age. By contrast, in only 1 age group (those aged 75 to 84 years) was Black men’s relative risk more than 13 times that of White men.
More encouraging, however, is that neither pre-HAART nor post-HAART Black–White disparities in HIV-related mortality were universal among US men aged 25 years and older. Also, whether the outcome of interest was MRR or mortality rate, place (i.e., where a person lived) was important among Blacks, in part because places with lower inequality and lower rates before the introduction of HAART also tended to have correspondingly lower values after HAART’s introduction. Specifically, although county-level socioeconomic and demographic factors were important predictors of post-HAART disparities (i.e., MRRs) among Black men aged 25 years and older in the cross-sectional models (1 and 2), pre-HAART MRRs appeared to account for a greater proportion of the variance than any other variable in the model, in part because of the magnitude of unexplained heterogeneity in these cross-sectional models. After we controlled for pre-HAART MRRs, the protective racial/ethnic context within the county (evidenced by the lower MRRs associated with higher percentages of Blacks and Hispanics) was not significant for percentage of the population who were Black and of only borderline significance for percentage of the population who were Hispanic. Social inequality (represented by Black:White poverty rate ratio) also emerged as a borderline significant risk factor. By contrast, a higher socioeconomic index (indicating lower contextual socioeconomic status) was highly significant in all 3 models when the dependent variable was Black mortality, thereby reminding us that that Black mortality and Black:White MRRs for HIV may have different determinants.
Counties with anomalously high MRRs may be extreme examples of place effects. Two of these communities were contiguous (Delaware County, Pennsylvania, and New Castle County, Delaware) and 3 (Forsyth, Gaston, and Wayne Counties) were in North Carolina, raising the possibility of shared experiences.
Because identification of anomalous county characteristics significantly improved the socioeconomic model predicting disparity (i.e., Black : White MRRs) in these data, the results suggest that further characterization of these communities might lead to further strengthening of the model. In pursuing such inquiries, the high variability in outcome by place and the apparent complexity of the interplay between factors that increased risk and those that were protective should caution against studies of single communities contrasted with communities across the continuum of overall outcomes. Detection of dose–response group relationships might be especially enhanced by a multiple community approach.
Several hypotheses could be considered. Nakashima and Fleming,5 for example, suggest that slower declines in numbers of cases of HIV among Blacks may partly reflect the later appearance of epidemic peaks among heterosexuals and substance abusers, because Blacks with HIV are more likely to be heterosexuals and substance abusers than are Whites. Comparative analyses of HIV incidence and survival among heterosexuals and substance abusers in communities with and without evidence of overall Black–White equality in disease outcome could address this possibility. Another possibility is that diffusion of HAART itself (with diffusion defined as “the process in which an innovation is communicated through certain channels over time among the members of a social system”27) was different. A third possibility was suggested by Wallace et al.,28,29 who stated that inability to meet demands for acute medical service (“medical gridlock”) resulted from “increasing social disorganization of poor communities initiated and continued in considerable part by government policy.”28(p810) A fourth hypothesis—selective migration of the severely ill to medical centers after a diagnosis of AIDS, which leads to higher rates in the surrounding communities—has not received strong support30 and would seem to be contradicted by the advanced medical care centers available in most of the 140 communities. Selective migration to rural areas would not appear to be supported for similar reasons.31
With regard to unequal diffusion, Rogers32 points out that medical innovations may exacerbate existing problems, in part because of barriers faced by those in lower socioeconomic strata. If this hypotheses is valid for this study, the strong influence of pre-HAART outcomes on post-HAART rates and disparities, taken in the context of previous scientific publications, suggests that more is involved. Specifically, channels of communication involved in HAART diffusion likely involve the interface between the community and entry to the health care system (e.g., lack of health insurance33 and low levels of trust34–36), activities within the health care system (e.g., equality of care,37 differential referral to clinical trials,38 and differences in HAART regimes39), and the interface between initiation of HAART and the ability to adhere to medical recommendations.40
Limitations
There are several limitations to these data. First, the problem of ascertaining cause of death from death certificates is well known.41–43 Also, an extensive literature documents the underreporting of HIV as underlying cause of death, particularly among women44 and minority populations45; if such underreporting actually exists, the mortality rates reported in our data could be underestimates. It could also be true, however, that local practices leading to underreporting among Whites would artificially inflate the Black : White MRRs.
Second, HAART was introduced in 1996, just a few years before the transition from ICD-9 to ICD-10 in 1999. Because increases in deaths caused by HIV grew more rapidly among Whites than among Blacks after ICD-10 was implemented,46 disparities might have been overestimated before ICD-10. Although it is true that the widening of disparities as shown in the present data was well in place by 1998, the increases remained relatively stable after ICD-10 was implemented, making it difficult to discount widened post-HAART disparities as coding bias.
Third, the extent of declines in AIDS mortality following the introduction of HAART may be illusory; mortality among people with HIV could have been attributed to something else (e.g., drug overdose), and HIV-related mortality might actually have remained the same. Smith et al.,15 for example, who followed a prospective cohort of women with HIV as part of the HERS (HIV Epidemiology Research Study) project, noted that all-cause mortality was unchanged between the pre-HAART (1993–1996) and post-HAART (1997–1999) periods, probably because high levels of illicit drug use offset improvements in mortality from declining numbers of deaths from HIV; it is unclear, however, whether national trends mirrored those of this particular study. Fourth, the changing patterns of associated mortality47–49 make it increasingly difficult to use methods employed in past years50 to estimate the contribution of HIV to deaths attributed to other causes. Follow-up data from nationally representative case cohorts would be helpful.
Fifth, we used 10-year age groups in calculating almost all race-, age-, and gender-specific rates. Although this was the smallest age grouping available,8 it is possible that variations within still smaller age groups affected the comparability of rates. Sixth, the socioeconomic and demographic descriptors used for multivariate analysis were ecological and will ultimately need to be understood in conjunction with multilevel analyses that include individual information.51 Seventh, regarding identification of anomalous county characteristics, there are literally thousands of characteristics that could be considered, so the list of plausible factors we used could have missed important opportunities to improve the model. Identification of particular communities as anomalous in these models should be interpreted with caution, both because of the aforementioned possibility of missed opportunities and because of ongoing inquiry within the biostatistics community as to the best multivariable analyses to use for these purposes.18,19 This is a strong argument for primary qualitative and quantitative data collection within anomalous communities and other communities at opposite ends of the disparities spectrum.
Conclusions
These data show that Black–White risks increased after the introduction of HAART, that Black–White disparities in HIV-related mortality differ according to age and gender, that high pre-HAART disparities among women were raised to extraordinarily high post-HAART levels, and that communities had different vulnerabilities to disparity. Public health policymakers should consider epidemiological studies of existing hypotheses as well as the hypothesis of unequal diffusion of HAART in seeking to explain these patterns; they should also plan to identify places with unusually high disparities in mortality and not simply the risk-factor characteristics associated with individual vulnerability. Perhaps the most important observation, however, is that Black–White disparities were not inevitable in the United States, either before or after the introduction of HAART. Further study of relatively successful communities may improve public health theory and lead to increased national equity in outcomes, even as we reap the harvest already engendered by current innovations.
Acknowledgments
This project was supported in part by the Health Resources and Services Administration (grant 1 D72CS04177–01–00) and from the Morehouse School of Medicine.
Human Participant Protection No protocol approval was needed for this study, which was based entirely on public information from secondary data sets available through the Internet.
Peer Reviewed
Contributors R. S. Levine originated the study and supervised all aspects of its implementation, including interpretation of the data and writing the article. N. C. Briggs, B. J. Kilbourne, and P.T. Baltrus assisted with the design, analysis, interpretation of results, and writing of the article. W.D. King assisted with interpretation of results and writing the article. Y. Fry-Johnson, B. A. Husaini, and G. S. Rust assisted with origination and interpretation of results and writing the article.
References
- 1.Institute of Medicine. Unequal Treatment: Confronting Racial and Ethnic Disparities in Health Care. Washington, DC: National Academies Press; 2002. [PubMed]
- 2.Wong MD, Shapiro MF, Bascardin WI, et al. Contribution of major diseases to disparities in mortality. N Engl J Med. 2002;347:1585–1592. [DOI] [PubMed] [Google Scholar]
- 3.Health, United States, 2004, With Chartbook on Trends in the Health of Americans. Hyattsville, Md: National Center for Health Statistics; 2004. [PubMed]
- 4.US Centers for Disease Control and Prevention. Basic statistics. Available at: http://www.cdc.gov/hiv/stats.htm#aidsrace. Accessed June 17, 2007.
- 5.Nakashima AK, Fleming PL. HIV/AIDS surveillance in the United States, 1981–2001. J Acquir Immune Defic Syndr. 2003;32:S68–S85. [PubMed] [Google Scholar]
- 6.Blair JM, Fleming PL, Karon JM. Trends in AIDS incidence and survival among racial/ethnic minority men who have sex with men, United States, 1990–1999. J Acquir Immune Defic Syndr. 2002;31: 339–347. [DOI] [PubMed] [Google Scholar]
- 7.Karon JM, Fleming PL, Steketee RW, De Cock KM. HIV in the United States at the turn of the century: an epidemic in transition. Am J Public Health. 2001;91: 1060–1068. [DOI] [PMC free article] [PubMed] [Google Scholar]
- 8.US Centers for Disease Control and Prevention. CDC Wonder online database. Available at: http://wonder.cdc.gov. Accessed June 17, 2007.
- 9.Centers for Disease Control. Human immunodeficiency virus (HIV) infection codes: official authorized addendum ICD9-CM (Revision No. 9). Effective January 1, 1988. MMWR Morb Mortal Wkly Rep. 1987; 36:1–24. [Google Scholar]
- 10.International Classification of Diseases, Ninth Revision. Geneva, Switzerland: World Health Organization; 1980.
- 11.Hoyert DL, Kochanek MA, Murphy SL. Deaths: final data for 1997. Natl Vital Stat Rep. June 30, 1999; 47:1–105. [PubMed] [Google Scholar]
- 12.International Classification of Diseases, 10th Revision. Geneva, Switzerland: World Health Organization; 1980.
- 13.US Census Bureau. Short Form 3. Available at: http://www.census.gov. Accessed June 17, 2007.
- 14.Nielson F. Income inequality in US counties (Gini coefficients). Available at: http://www.unc.edu/~nielsen/data/data.htm. Accessed June 17, 2007.
- 15.Smith DK, Gardner LI, Phelps R, et al. Mortality rates and causes of death in a cohort of HIV-infected and uninfected women, 1993–1999. J Urban Health. 2003;80:676–688. [DOI] [PMC free article] [PubMed] [Google Scholar]
- 16.Steenland K, Halperin W, Hu S, Walker JT. Deaths due to injuries among employed adults: the effects of socioeconomic class. Epidemiology. 2003;14: 74–79. [DOI] [PubMed] [Google Scholar]
- 17.Allison PD. Multiple Regression. Thousand Oaks, Calif: Pine Forge Press; 1999.
- 18.Gardner W, Mulvey EP, Shaw EC. Regression analysis of counts and rates: Poisson, overdispersed Poisson, and negative binomial models. Psychol Bull. 1995;118:393–404. [DOI] [PubMed] [Google Scholar]
- 19.Osterman J, Sloan FA, Herndon L, Lee PP. Racial differences in glaucoma care: the longitudinal pattern of care. Arch Ophthalmol. 2005;123:1693–1698. [DOI] [PubMed] [Google Scholar]
- 20.Ludbrook J. Update: microcomputer statistics packages. A personal view. Clin Exp Pharmacol Physiol. 1997;24:294–296. [DOI] [PubMed] [Google Scholar]
- 21.SAS version 9 [computer program]. Cary, NC: SAS Institute Inc; 2002.
- 22.Pearce L. Integrating survey and ethnographic methods for systematic anomalous case analysis. Sociol Methods. 2003;32:103–132. [Google Scholar]
- 23.Efron B. The Jackknife, the Bootstrap, and Other Resampling Plans. Philadelphia, Pa: Society of Industrial and Applied Mathematics; 1982. CBMS-NSF Monograph 38.
- 24.Buchan IE. StatsDirect—statistical software for medical research in the 21st Century. BMJ. 2000;321: 1536. [Google Scholar]
- 25.Rosner B. Fundamentals of Biostatistics. 5th ed. Duxbury, Mass: Duxbury Press; 2000.
- 26.Dore GJ, Li Y, McDonald A, Ree H, Kaldor JM, National HIV Surveillance Committee. Impact of highly active antiretroviral therapy on individual AIDS-defining illness incidence and survival in Australia. J Acquir Immune Defic Syndr. 2002;29:388–395. [DOI] [PubMed] [Google Scholar]
- 27.Groeneveld PW, Laufer SB, Garber AM. Technology diffusion, hospital variation, and racial disparities among elderly Medicare beneficiaries 1989–2000. Med Care. 2005;43:320–329. [DOI] [PubMed] [Google Scholar]
- 28.Wallace R. Urban desertification, public health and public order: “planned shrinkage,” violent death, substance abuse, and AIDS in the Bronx. Soc Sci Med. 1990;31:801–813. [DOI] [PubMed] [Google Scholar]
- 29.Wallace D, Wallace R. Life and death in upper Manhattan and the Bronx: toward an evolutionary perspective on catastrophic social change. Environ Plann A. 2000;32:1245–1266. [Google Scholar]
- 30.Hogg RS, Whitehead J, Ricketts M, et al. Patterns of geographic mobility of persons with AIDS in Canada from time of AIDS index diagnosis to death. Clin Invest Med. 1997;20:77–83. [PubMed] [Google Scholar]
- 31.Buehler JW, Frey RL, Chu SY. The migration of persons with AIDS: data from 12 states, 1985 to 1992. AIDS Mortality Project Group. Am J Public Health. 1995; 85:1552–1555. [DOI] [PMC free article] [PubMed] [Google Scholar]
- 32.Rogers EM. Consequences of innovations. In: Rogers EM. Diffusion of Innovations. 5th ed. New York, NY: Free Press; 2003:436–471.
- 33.Goldstein RB, Rotheram-Borus MJ, Johnson MO, et al. Insurance coverage, usual source of care, and receipt of clinically indicated care for comorbid conditions among adults living with human immunodeficiency virus. Med Care. 2005;43:401–410. [DOI] [PubMed] [Google Scholar]
- 34.Klonoff A, Landrine H. Do blacks believe that HIV/AIDS is a government conspiracy against them? Prev Med. 1999;28:451–457. [DOI] [PubMed] [Google Scholar]
- 35.Bogart LM, Thorburn S. Are HIV/AIDS conspiracy beliefs a barrier to HIV prevention among African Americans? J Acquir Immune Defic Syndr. 2005;38: 213–218. [DOI] [PubMed] [Google Scholar]
- 36.Ross MS, Essien EJ, Torres I. Conspiracy beliefs about the origin of HIV/AIDS in four racial/ethnic groups. J Acquir Immune Defic Syndr. 2006;41: 342–344. [DOI] [PMC free article] [PubMed] [Google Scholar]
- 37.McGinnis KA, Fine MJ, Sharma RK, et al. Understanding racial disparities in HIV using data from the veterans aging cohort 3-site study and VA administrative data. Am J Public Health. 2003;93:1728–1733. [DOI] [PMC free article] [PubMed] [Google Scholar]
- 38.Cargill VA, Stone VE. HIV/AIDS: a minority health issue. Med Clin North Am. 2005;89:895–912. [DOI] [PubMed] [Google Scholar]
- 39.Harris M, Montaner JS. Clinical uses of non-nucleoside reverse transcriptase inhibitors. Rev Med Virol. 2000;10:217–229. [DOI] [PubMed] [Google Scholar]
- 40.King WD, Wong MD, Shapiro MR, et al. Does racial concordance between HIV-positive patients and their physicians affect time to receipt of protease inhibitors? J Gen Intern Med. 2004;19:1146–1153. [DOI] [PMC free article] [PubMed] [Google Scholar]
- 41.Lu TH, Shau WY, Shih TP, et al. Factors associated with errors in death certificate completion. J Clin Epidemiol. 2001;54:232–238. [DOI] [PubMed] [Google Scholar]
- 42.Johansson LA, Westerling R. Comparing hospital records with death certificates: can the differences be explained? J Epidemiol Community Health. 2002;56: 301–308. [DOI] [PMC free article] [PubMed] [Google Scholar]
- 43.Hennekens CH, Buring J. Epidemiology in Medicine. Boston, Mass: Little, Brown & Co; 1987.
- 44.Buehler JW, Hanson DL, Chu SY. The reporting of HIV/AIDS deaths in women. Am J Public Health. 1992;82:1500–1505. [DOI] [PMC free article] [PubMed] [Google Scholar]
- 45.Lindan CP, Hearst N, Singleton JA, et al. Underreporting of minority AIDS deaths in San Francisco Bay area, 1985–86. Pub Health Rep. 1990;105:400–404. [PMC free article] [PubMed] [Google Scholar]
- 46.Selik RM, Anderson RN, McKenna MT, Rosenberg HM. Increase in deaths caused by HIV infection due to changes in rules for selecting underlying cause of death. J Acquir Immune Defic Syndr. 2003;32:62–69. [DOI] [PubMed] [Google Scholar]
- 47.Bica I, McGovern B, Dhar R, et al. Increasing mortality due to end-stage liver disease in patients with human immunodeficiency virus infection. Clin Infect Dis. 2001;32:492–497. [DOI] [PubMed] [Google Scholar]
- 48.Valdez H, Chowdhry TK, Assaad R, et al. Changing spectrum of mortality due to human immunodeficiency virus: analysis of 260 deaths during 1995–1999. Clin Infect Dis. 2001;32:1487–1493. [DOI] [PubMed] [Google Scholar]
- 49.Cohen MH, French AL, Benning L, et al. Causes of death among women with human immunodeficiency virus infection in the era of combination antiretroviral therapy. Am J Med. 2002;113:91–98. [DOI] [PMC free article] [PubMed] [Google Scholar]
- 50.Wohl AR, Garland WH, Squires K, et al. The feasibility of a community-based, directly administered antiretroviral therapy program. Clin Infect Dis. 2004; 38(suppl 5):S388–S392. [DOI] [PubMed] [Google Scholar]
- 51.Kaplan GA, Everson SA, Lynch JW. The contribution of social and behavioral research to an understanding of the distribution of disease: a multilevel approach. In: Smedley BD, Syme SL, eds. Promoting Health: Intervention Strategies From Social and Behavioral Research. Washington, DC: National Academy Press; 2000:37–80.