

Abstract
The subtelomeric region of mouse chromosome (Chr) 4 harbors loci with effects on behavior, development, and disease susceptibility. Regions near the telomeres are more difficult to map and characterize than other areas because of the unique features of subtelomeric DNA. As a result of these problems, the available mapping information for this part of mouse Chr 4 was insufficient to pursue candidate gene evaluation. Therefore, we sought to characterize the area in greater detail by creating a comprehensive genetic, physical, and comparative map. We constructed a genetic map that contained 30 markers and covered 13.3 cM; then we created a 1.2-Mb sequence-ready BAC contig, representing a 5.1-cM area, and sequenced a 246-kb mouse BAC from this contig. The resulting sequence, as well as approximately 40 kb of previously deposited genomic sequence, yielded a total of 284 kb of sequence, which contained over 20 putative genes. These putative genes were confirmed by matching ESTs or cDNA in the public databases to the genomic sequence and/or by direct sequencing of cDNA. Comparative genome sequence analysis demonstrated conserved synteny between the mouse and the human genomes (1p36.3). DNA from two strains of mice (C57BL/6ByJ and 129P3/J) was sequenced to detect single nucleotide polymorphisms (SNPs). The frequency of SNPs in this region was more than threefold higher than the genome-wide average for comparable mouse strains (129/Sv and C57BL/6J). The resulting SNP map, in conjunction with the sequence annotation and with physical and genetic maps, provides a detailed description of this gene-rich region. These data will facilitate genetic and comparative mapping studies and identification of a large number of novel candidate genes for the trait loci mapped to this region.
The subtelomeric region of mouse Chr 4 harbors loci that cause alterations in development, behavior, and disease susceptibility (Table 1) but sparse physical and genetic mapping resources. Identification of candidate genes for these traits has been hampered because genetic and physical maps are difficult to construct accurately near the telomere (Riethman 1997). As a result, the quality of available mapping data is poor in this region. Examples of this include inconsistencies in marker and gene order, both in individual studies and composite maps, low marker density, poor YAC-coverage, lack of a sequence-ready BAC contig, and no available draft or finished genomic sequence.
Table 1.
Loci with developmental, behavioral, or disease susceptibility phenotypes mapped to the subtelomeric region of mouse Chr 4.
| Name | Symbol | cM | Reference |
|---|---|---|---|
| Friend virus susceptibility 1 | Fv1 | 76.5 | (Stoye et al. 1995) |
| Gastritis type A susceptibility locus 2 | Gasa2 | 77.5 | (Silveira et al. 1999) |
| Epistatic circling gene of C57L/J | ecl | 78.4 | (Taylor 1976) |
| Fluctuating asymmetry QTL 1 | Faq1 | 79.1 | (Leamy et al. 1997) |
| Beta-carboline-induced seizures 1 | Bis1 | 80.0 | (Martin et al. 1995) |
| Insulin-dependent diabetes susceptibility 9 | Idd9 | 82.0 | (Rodrigues et al. 1994) |
| Testis-determining autosomal 1 | tda1 | 82.0 | (Eicher et al. 1996) |
| Saccharin preference | Sac | 83.0 | (Fuller 1974) |
Gene names and symbols are from the Mouse Genome Database (MGD), maintained at The Jackson Laboratory. Distances from the centromere (cM) are from the integrated MGD map.
This region contains the saccharin preference locus (Sac), which affects the intake of sweeteners (Bachmanov et al. 1997). A Sac candidate gene in the area was identified (Tas1r1; Hoon et al., 1999), and then excluded (Li et al. 2001). Sac has effects on the peripheral sensitivity to sweeteners (Bachmanov et al. 1997; Inoue et al. 2001), and is allelic between the C57BL/6ByJ (B6; high sweetener preferring) and 129P3/J (129) and DBA/2 (low sweetener preferring) strains (Fuller 1974; Lush 1989; Belknap et al. 1992; Lush et al. 1995; Blizard et al. 1999). The Sac locus selectively affects sweet and alcohol intake; other taste stimuli, such as sour, salty, and bitter, are unaffected by Sac (Bachmanov et al. 1996a; 1996b).
To increase the resources available for the identification of Sac and other neighboring loci, a detailed characterization of this region was undertaken. First, a dense genetic map was constructed, with markers previously mapped to the region, and updated with new markers generated during the project. The B6 and 129 strains were chosen to create the genetic map because they are allelic for the Sac locus and are distantly related. The newly generated genetic map resulted in the construction of a physical map with overlapping BAC clones. A BAC clone covering the Sac critical region was sequenced and analyzed for the presence of genes. In addition, comparative mapping was conducted because previous work suggested that significant conserved synteny existed between the telomeric region of mouse Chr 4 and the telomeric region of the p-arm of human Chr 1.
Materials and methods
DNA markers and sequences
Markers on distal Chr 4 used for mouse genotyping and physical mapping were obtained from several sources. The locations of ESTs R75150, M134G01, M136B1, K01599, AA408705, M134C6, D4Xrf497, D4Xrf215, Al225779, and K00231 were found in the radiation hybrid databases of the Whitehead Institute for Biomedical Research/MIT Center for Genome Research (http://www-genome.wi.mit.edu/), the Medical Research Council (http://genex.hgu.mrc.ac.uk/), and the Mouse Genome Database (http://www.jax.org) maintained by The Jackson Laboratory. Markers based on BAC end sequences were obtained through The Institute for Genomic Research web site (http://www.tigr.org) or by direct sequencing, when necessary. Some STSs, e.g., R74924, D18402, and U37351 and genes, e.g., BG228522, Ski, Pkcz, Gnb1, Cdc212, DvI1, Tnfrsf4 and Agrn were available from public databases (National Center for Biotechnology Information [NCBI], Massachusetts Institute of Technology [MIT]). Additional markers, including all D4Mon markers, were designed using sequence from the RPCI-23 BAC 118E21.
Primers were purchased from Research Genetics (Huntsville, Ala.) or synthesized at Integrated DNA Technologies, Inc. (Coralville, Iowa). Most primer pairs and their PCR products were tested for polymorphisms between the B6 and 129 strains. Most polymorphic markers were used for genotyping the F2 mapping panel and to construct the genetic map. Markers located between D4Mit256 and K00231 were used to make the BAC contig. Details about markers and their associated primer sequences are given in Table 2.
Table 2.
Sequence-tagged sites (STS) in the subtelomeric region of mouse Chr 4.
| Locus | Accessiona | Forward primer 5′ → 3′ | Reverse primer 5′ → 3′ | Product size (bp)b | Polymorphic B6/129c | Detection methodd |
|---|---|---|---|---|---|---|
| D4Mit33 | MGI92868 | GGAGGTGTCAGGAGCCCT | CTCCTGACTGAGGTACCAAACC | 126 | Yes | SSLP |
| D4Mit190 | MGI92820 | CAGTGAAGCAAAAAGATTCGG | TTCCAGTCTTGGGAATGTATCC | 144 | Yes | SSLP |
| D4Mit42 | MGI92875 | CATGTTTGCCACCCTGAAAC | CCTCACTTAGGCAGGTGACTC | 100 | Yes | SSLP |
| Tas1r1 | AF301161 | GGAGTTGCAGCCTCTACAGC | CAGGAGAGGAAAATGGCAAA | 100 | Yes | SSCP |
| D4Mit254 | MGI100505 | AATACAATTATCATTTGCATTGTGG | TCGTGGTGGACCTTATCTCC | 135 | Yes | SSLP |
| Trp73 | AF138873 | TGAGATCTGGTGCCCTCTCT | GCCTGATCTAGGCTGGAAAA | 229 | Yes | Both |
| D4Mit209 | MGI92840 | CCTTGCTGGTTCTGGCTAAG | CTATCTCCTGAGTTGCTCTGAGC | 122 | Yes | SSLP |
| D4Mit256 | MGI100503 | CTGGAGAGTTAGAATGGGGTACC | ACAGAGGCGCTTCCTAAC | 132 | Yes | SSLP |
| R75150 | R75150 | ACAGGACAAATGCTGGGTTG | GTGGTAAAGAACGCTTGGCT | 217 | Un | NA |
| BG228522 | BE137821 | GCCGATCCTGGTGATGTACT | ACAATGGCTCAAAACCGTTC | 200 | Un | NA |
| M136B1 | AU042805 | TCCTTTATGTCCAACAGCCA | CATGGTCTGTGATGTGACCA | 164 | No | SSCP |
| K01599 | AA062172 | GGAAAAGGGAGTCGCCATA | GAGCCGCCTAACTCTCACAC | 166 | No | SSCP |
| D4Smh6b | X58261 | CTGTAGGCTGCTTTTATCTTTTG | TGCCCCTTCAGCACATGCCA | 102 | Yes | SSLP |
| AA408705 | TC87041 | GCTTCAGAAAATCGAGGCAC | GCATGGGCTATGATAGGTGG | 232 | No | SSCP |
| Ski | U14173 | ATCTCTTGTTTCGTGGTGGG | AGGATGCCCATGACTTTGAG | 173 | No | SSCP |
| 399I12-T7 | AZ052540 | TGGTGGTGTAATACTATTCCTTTG | TCTTTAATTTTTGGCTTTTTGATACA | 102 | No | SSCP |
| Pkcz | NM_008860 | ACACATTAAGCTGACGGACT | CAAACATAAGGACACCCAGT | 164 | Yes | SSCP |
| R74924 | R74924 | AGTGCCACCAACCTGGTAAG | AAGTGCCTGCAGGGATGC | 165 | No | SSCP |
| M134C6 | AI098070 | CAAAACCACATGGTTACCGA | GCCCTATTGCCAAATGACTT | 264 | No | SSCP |
| 438C18-SP6 | AZ077160 | CGGGACCTAAAACTGGACAA | TGGGGACAGTTACCAGGAAG | 254 | Yes | SSCP |
| 472O18-T7 | AZ114562 | CTTTCCATTCTCCACCCTCA | AGGTCCTAGGGAGAGGTCCA | 260 | No | SSCP |
| 399I12-SP6 | AZ052537 | CAGCTGTGTGCATGTTGACC | CATCATGAAGACTCAGGGCA | 106 | No | SSCP |
| 360M12-SP6 | AZ027787 | AATGATGAAGTGTCAGCCTCAG | CAACAGAACTCAAAGCCTGG | 100 | Yes | SSCP |
| 151E4-SP6 | AZ263331 | GACCTTCGGAAGAGCAGTTG | AGTGTGTGTCGCCATATCCA | 223 | No | SSCP |
| 147A15-T7 | AZ273113 | GTGGTTGCTGGGATTTGAAC | CAAGCAACCAAACAACCAAA | 101 | No | SSCP |
| 307E5-SP6 | AQ982924 | GCTAGTTGGGGAACAAACCA | ACTGCAAATGTCCAACTCCA | 149 | No | SSCP |
| Gnb1 | NM_008142 | GGGCATCTGGCAAAGATTTA | AGATAACCTGTGTGCCCGC | 281 | No | SSCP |
| 37D20-T7 | AZ088686 | GAAAACAATCGGGGAGAAGTC | TGAAATTATCACACGCCAGG | 109 | No | SSCP |
| 415A22-SP6 | AZ057087 | GTCCACACCTGGCTTTTGTT | CAGCACTCAGTGAGGTTCCA | 199 | Yes | SSCP |
| 415G24-SP6 | AZ059760 | ATGTAATGGAAGGGCTGCTG | CAGCACTCAGTGAGGTTCCA | 113 | No | SSCP |
| 34M15-SP6 | AZ238889 | CGCTACTTCGCTTTTATCCG | ATGATGACGTACGACGACGA | 150 | No | SSCP |
| Cdc2L2 | NM_00766 | GGCTTCAGCCTCAAGTTCTG | AAAACAACCAAGTTGCCCTG | 101 | No | SSCP |
| 436P10-T7 | NA | CACAGGCCAAGTTGTTGTTG | CAGGGGACCTTCTGAATGAT | 115 | Un | NA |
| D18402 | D18402 | GGAGTTCTCCTACCCTGGCT | GAGGCTCTGAGCAGTGTCAA | 167 | No | SSCP |
| 360M12-T7 | AZ027785 | CGGTCAGGAGTAGTGTGGGT | CAGCAGCTGATATTGAGGCA | 123 | No | SSCP |
| 138D7-T7 | AZ281648 | ACCTCTAGGGTTTACGGGGA | CCTCAGGTAGTGCAAGCTCC | 199 | No | SSCP |
| 151E4-T7 | AZ263335 | GTCCCAAAAGCTAGCACAGG | TCATGAGCCAACCATGTGATT | 240 | No | SSCP |
| 457N22-T7 | AZ089282 | CCGGAGGACCATAAATCTGA | CCTCAAAAACAAGCCTGAGC | 129 | No | SSCP |
| 37D20-SP6 | AZ088681 | GCTAGCCTTGAAGCCAACAC | TGAACAGCATGCTTACCCAG | 122 | No | SSCP |
| 147A15-SP6 | AZ273111 | TCCGGAGGACCATAAATCTG | CACAGTCCCAGTCATTCCCT | 249 | Yes | SSCP |
| D4Xrf497 | AA117049 | GCGAGACGAGTGGGTAGTTC | ACACTGAAACCTCGCTTGCT | 129 | No | SSCP |
| 280G12-T7 | AZ986251 | GGGCTGGGAATTGAACCTAT | TGAATCCCTTACAGCCTTGC | 420 | Yes | SSCP |
| 49O2-T7 | AZ253249 | TCCCTAGAGGCCTGTCTGTC | TCGTCTCGGAGCCTCTTCTA | 169 | Yes | SSCP |
| 34M15-T7 | AZ238896 | GGGTTTATGTGGCAAGCACT | ACTCCATTTGCCTTTTGTGG | 118 | No | SSCP |
| 118E21-SP6 | AZ274152 | GGGGCAGGTGGGTAATAAGT | CAAAAGCCCAACTCCTTGAG | 271 | Yes | SSCP |
| U37351 | U37351 | GTGGCTTGGTGCTATTGACA | GGGGCTATTAAGGCCATTTT | 160 | No | SSCP |
| 338N4-T7 | AQ998700 | AGTTACACAGCTGGGACGA | GCAAGAGCCTAGCAATCCAC | 245 | Yes | SSCP |
| 284D21-SP6 | AQ932576 | ACAGAAATCCCTCATGCGA | TCAGTGTGGACCAGAAAGTCC | 105 | No | SSCP |
| 387F5-SP6 | AQ998225 | CAGTTACACAGCTGGGACGA | GCAAGAGCCTAGCAATCCAC | 245 | Yes | SSCP |
| D4Mon7 | G67778 | CCCACTATGGTCCCAGAGAA | GCGCTGACATCCTCCTATGT | 187 | No | SSLP |
| M134G01 | AI31686 | CACATTAGCCATTGTCCTGG | GGCAGAAAGGAATCAGAAGC | 161 | Yes | SSCP |
| D4Mon4 | G67775 | ACATGCCTGCCTATCTTTGC | GGAACCTGTTTTCCATGGTG | 197 | No | SSLP |
| Dvl | NM_010091 | AAGTTCATGGGCCTCACCACCTGTG | TACTAGCTACCCTTCACATACC | 238 | No | SSLP |
| D4Mon6 | G67777 | TGAGTGTCCTCTGCCTGATG | CCATGGGAGACCAGAAGGTA | 206 | Un | SSLP |
| Tas1r3 | AF311386 | GCAACAGAGTCACAACTGCC | ACACACAGTACCAACCCCGT | 293 | Yes | SSCP |
| D4Mon3 | G67774 | GCTTACGATGGTCGTGAGGT | GCAAGCAACCTGAACATGAA | 188 | No | SSLP |
| D18346 | D18346 | ATGTCCAGGGTAGAGAGCCC | TGTCCGCAGTGTGGAAACTA | 165 | Yes | SSCP |
| D4Xrf215 | F07942 | TTCCAAGCTCACACATCAGC | GTGCTGCTCTGCATTGAGTG | 124 | No | SSCP |
| 350D2-T7 | AZ032147 | TGTAGGGAATGTTTCTGCACC | ACATGGAACAGGATTCTGGC | 295 | Yes | SSCP |
| D4Mon41 | G67754 | TGCATCACTATTAAGCCTCAACC | AAGAATTTGCAAAGACTGTGAGA | 260 | No | Both |
| D4Mon43 | G67755 | GGTGGCTCAAACCATCCATA | GAGGGCAATGAGCAAAATGT | 203 | Yes | SSCP |
| D4Mon44 | G67756 | GGTCCTGTCTCTGGTTCAGG | TAACACCCACATCAGGCAAC | 201 | Yes | Both |
| D4Mon48 | G67757 | CAGCAGGCAAGATGACCTC | GTCCCTCACCAGCCATGTTA | 205 | Yes | Both |
| D4Mon49 | G67758 | AGCCTGGGCTAAGTTGTGTG | TATGGGCCAATGTTGTTCCT | 204 | Yes | Both |
| D4Mon50 | G67759 | ATGGTGGCTCACAACCATCT | AT TTGTCCTCTGATTGCAGC | 193 | Yes | SSCP |
| D4Mon52 | G67760 | ATGCTCAGCCTGCTTTGTTT | GCTGATAGCCCTGGGTTCTA | 198 | No | Both |
| D4Mon53 | G67761 | TGTACGCACAAATTGACTTGC | GAATCCACATTGCAAAGCCTA | 222 | Yes | SSCP |
| D4Mon54 | G67762 | CACAGGCAAATGAAGGGAAG | CCAGACTTCTCCAGCTCTCC | 187 | Yes | Both |
| D4Mon31 | G67747 | CAGATTCTCCAGCTGTCAGG | CTGTGTTTCCGCACCAAGT | 229 | No | SSCP |
| D4Mon56 | G67763 | CCTGTGGTTGACTAGGCAGAA | GCCTGATAGCCTGGAATACA | 406 | Yes | SSCP |
| D4Mon5 | G67776 | ACCTTGTTCCTGGTGTGAGC | TAGCTGGGACGTGGTATGGT | 200 | No | SSLP |
| D4Mon58 | G67764 | TGCACTGACCGTGATAGAGG | CGGTGTAGCTCTGGCTGTCT | 200 | No | SSCP |
| D4Mon59 | G67765 | CATCTCACCAACTCGCACTT | TTTCTGGGAACAAAGAGGCTA | 418 | No | Both |
| D4Mon60 | G67766 | GAACCCAAGTGTTGGGGTAA | TGGAAGCCCATCTGTCTCTT | 222 | Yes | Both |
| D4Mon33 | G67748 | CAGCAGAGGTGATGGGTTCT | TTGTCACACAGTGGTTAAATGC | 203 | No | SSCP |
| D4Mon62 | G67767 | GGTGTGCACCACCATATTCA | GGGAATTATCAGCCAAAAAGC | 201 | Yes | Both |
| D4Mon34 | G67749 | TAGAACCGTGGCTGAGGACT | CCGTAAGATATGAAAGAACTTGGA | 201 | No | SSCP |
| D4Mon63 | G67768 | GCCCAACTGAAAGCTCAACT | GGAAGGGGGATAACAATTGAA | 263 | Yes | Both |
| D4Mon64 | G67769 | TGCTAATTTCAAGCACAGTGAGA | AGCTTGACACCTTGACAGCA | 369 | Yes | SSCP |
| D4Mon36 | G67750 | CCTTCCTCGTCTGAGCTGTT | TTGGGACGTGACCTGAGAAT | 232 | Yes | SSCP |
| D4Mon66 | G67770 | TTCAATTGAGTTTCTCTCCTCTGA | TGCAGGACCAAGAAGTAGGC | 200 | Yes | SSCP |
| D4Mon37 | G67751 | TATGTGTCTGGCCGTTGTTC | GATGTGGGTGCAGGTGAAG | 206 | No | SSCP |
| D4Mon39 | G67752 | GCTGAGCAGCCTCTAGCAA | ACCATGGCTTTTCCCAGTAA | 241 | No | SSCP |
| 139J18-T7 | AZ260477 | ACCACTTGGGGGCTACTTCT | GCTGATCCCCCTGTGATTTA | 232 | Yes | SSCP |
| D4Mon40 | G67753 | CTGTGCCTTTGGTGATCAGA | TGTGGCACTCTACGGCATAA | 261 | No | Both |
| D4Mon1 | G67772 | GCAGTGAGCTGCAGAGTTTG | AGGCCTACCCAAGGACATCT | 201 | Yes | SSCP |
| 417B22-SP6 | AZ061836 | AAACAGGCATGAAACTCAGGA | GGGTATCATTGTCACCTCCA | 116 | No | SSCP |
| 227G4-T7 | N/A | GGAAGCAAATGCTCCACTAAA | TATCCCTAGCCCCTTGTGTG | 243 | No | SSCP |
| D4Mon28 | G67746 | GACCTTTGGAAGAGCAGTCG | TGGCAGCTCACAATGTCTTT | 296 | No | SSLP |
| D4Mon27 | G67745 | TGCCTTTTTCTCACATTGTCTC | TTAGAAGCAGAGGCAGAGGC | 250 | No | SSLP |
| D4Mon26 | G67744 | TCAGACATCTCTGGCCTCCT | TTCACTAAGTTGCCCAGGCT | 160 | No | SSLP |
| 284D21-T7 | AQ977902 | GGTTTGGGAGTGTTAGGCAA | ACTCAGTTGGCCTCTCCTCA | 138 | No | SSCP |
| 280G12-SP6 | AZ001739 | GCCCCATAAAATCCACTCCT | GCTCCGGAAGGCTAGAAGAT | 233 | Yes | SSCP |
| 387F5-T7 | AQ998226 | GCCCCATAAAATCCACTCCT | TTGCCTAACACTCCCAAACC | 214 | Yes | SSCP |
| 49O2-SP6 | AZ253245 | GATAGTCCCTTAGCCAGCCC | GCCATAGCTCCTCACTGCTC | 218 | No | SSCP |
| 338N4-SP6 | AQ998697 | CAGTTTAGCACCCCACCCTA | TCTGCACCTCTGTTCACCTG | 115 | No | SSCP |
| 130A12-SP6 | AZ266745 | CAGTTAGCACCCCACCCTAA | TCTGCACCTCTGTTCACCTG | 114 | Yes | SSCP |
| D4Mon25 | G67743 | GTTTCACATGTTGTGGTGGC | GGGACCTTTGGGATAGCATT | 131 | No | SSLP |
| Tnfrsf4 | NM 011659 | AGGCAGAAAGCAGACAAGGA | CGACAGCACTTGTGACCACT | 138 | Yes | SSCP |
| D4Mon24 | G67742 | CAGCAGCAAATGACCTTTCA | GAGGCAGGCAGATTTCTGAG | 147 | No | SSLP |
| D4Mon22 | G67741 | GTTGGGGCTGCTCATAGAAA | GCTGTGGCTCTCTTGGAGTT | 422 | Yes | Both |
| D4Mon21 | G67740 | CAGTTCTTCCCGAAAACCAC | TTTCTGGGAACTGAGATGGC | 174 | No | Both |
| A1225779 | AI225779 | GCTGTTAGTGAGGTCAGGGC | CGTAGGTGGCACAGTTGAGA | 104 | Yes | SSCP |
| D4Mon20 | G67739 | TTAGCGTTAGGGTGAGGGTG | GGAGACTACGGACTTGTGGC | 150 | No | Both |
| D4Mon19 | G67738 | GGAAGGTAGGGCCTGGTAAT | GCTCCAAGATCTGTGCGATT | 277 | No | Both |
| D4Mon18 | G67737 | GCTCAGCCCCTGAATCAATA | GGGATCTGCCTGTCTTACCA | 111 | No | Both |
| D4Mon17 | G67736 | GCTCAAGGAAGGACACACCT | TGCTCTTAACATTTTGAGCCAT | 201 | No | SSLP |
| D4Mon16 | G67735 | ATCAGACAGCCCACAACCTC | TATGTGCCACCACACCTGTC | 206 | No | SSLP |
| D4Mon68 | G67771 | ACATGTCCACTGTGGCAAAA | TGTCATGAGTTTGAGGCCAG | 246 | No | SSLP |
| D4Mon2 | G67773 | TGATCTTTCCAAACGCATAAGA | AGACACCCTAGGTCCTGCTG | 151 | No | SSLP |
| D4Mon15 | G67734 | TGTTCCTGAGTTCACAACGC | ATTCCCAGCAACTACATGGC | 269 | No | SSLP |
| D4Mon9 | G67779 | GGACAGGTAGCTCACCCAAC | CCAAGAGTCAGCCTTGGAGT | 200 | No | SSLP |
| D4Mon14 | G67733 | TACTTCCCCTTTCCCGAACT | TCCTTGGTGCTTACCCTCAC | 232 | Yes | SSLP |
| D4Mon13 | G67732 | CTAGGGGACTCTGCCAAGTG | CAAGACACCCAGTCCCAACT | 195 | No | SSLP |
| D4Mon12 | G67781 | GCAAGTTTCAGGAGCTAGGG | CCCCAGAACCAGAGACCATA | 166 | Yes | SSLP |
| D4Mon11 | G67780 | AGCCAGGGCTACACAGAGAA | ACCCTGCTACAACGCAGACT | 153 | No | SSLP |
| 118E21-T7 | AZ274183 | CCCAGAACTCCATCCTCAAA | CCCAACCTGTGGTCAGCTAT | 185 | No | SSCP |
| 382A8-SP6 | AZ018016 | AGCAGGCACAGGTCTCTTGT | AAGAACAGGACAGTGGTGGG | 202 | No | SSCP |
| 139J18-T7 | AZ260480 | TCAGTTACCAAGGGTTTCGG | ATAGGTTGTCACAGGCCAGG | 122 | Yes | SSCP |
| Agrn | M92654 | TGTGACTTCCTCTTCCCCAC | TGAGCCACTCCAGATGTCAG | 156 | No | SSCP |
| 28.MMHAP7FLB4.seq | M92657 | CACTAGAGCTGCCACCTTCC | CCCTCAGCACCACTTTTTGT | 162 | No | SSCP |
| K00231 | AA410003 | GTGCTCTGCAGACAAACCAA | GAGCCATTTTGACCCTTAAA | 154 | Yes | SSCP |
| V2r2 | AF053986 | CAATTGAGGAATGGCTACCAA | TGGCTTCATGTCCATTGTGT | 170 | Yes | SSCP |
| 238O5-T7 | NA | TATAAGCAGCCCCTCATTGG | CAGGCCAGACACTGCTTACA | 244 | Yes | SSCP |
| D4Ertd296e | C80036 | AGGCATATTGTATAATAAATTTGTAGT | CCGGATGACTCTACTTGAC | 201 | Yes | SSCP |
Accession numbers beginning with MGI are from the Mouse Genome Database and all other Accession numbers are from GenBank.
Product size is obtained from B6 genomic DNA.
Un = Unknown, not attempted.
N/A = not available.
Methods of detection: SSLP = simple sequence length polymorphisms; SSCP = single-strand conformation polymorphisms. Several markers were within known genes, e.g., R74924 (Pkcz); D18402 (Mmp23); U37351 (Pcee) and 28.MMHAP7FLB4.seq (Agrn). The STSs are ordered from the centromeric end to the telomeric end.
Genetic mapping and linkage analysis
Mouse genomic DNA was purified from tails by NaOH/Tris (Truett et al. 2000), or phenol/chloroform extraction. Markers that differed in length of the PCR product (simple sequence length polymorphism; SSLP) were tested by using a standard protocol (Dietrich et al. 1992), with minor modifications (Bachmanov et al. 1997; Li et al. 2001). Other markers were tested by using a single-strand conformation polymorphism (SSCP) protocol (Orita et al. 1989), or by sequencing the PCR products of B6 and 129 DNA, to detect single nucleotide or small insertion/deletion polymorphisms. Linkage analysis and construction of the genetic map were conducted by using MAPMAKER/EXP 1.1 (Lander et al. 1987).
Construction of a BAC contig
The RPCI-23 female (C57BL/6J) mouse BAC library (Osoegawa et al. 2000) was used for library screening. All probes were radioactively labeled by the random hexa-nucleotide method (Feinberg and Vogelstein 1983). Hybridization and washing of membranes followed standard protocols (Church and Gilbert 1984). The library was screened twice, first with a probe generated from YAC 178B3, and second, with pooled probes of markers on the distal end of Chr 4.
To determine the BAC clones corresponding to each probe, positive clones identified by the initial screenings were picked into 384-well microtiter plates and regridded onto 8 × 12 cm Hybond-N+ membranes (Amersham Pharmacia Biotech, Piscataway, NJ) by using a Biogrid robot (Biorobotics, Haslingfield, Cambridge, UK). Each filter was then hybridized against individual probes, under the same conditions as the primary screening. The secondary screening results were confirmed by PCR STS-content mapping, using overnight cell suspension as templates. BAC end STS markers were used to confirm the BAC physical map and identify polymorphisms.
To determine the size of individual BAC clones, we extracted the DNA using a modified alkaline lysis procedure (Sambrook et al. 1989) and analyzed after digestion with NotI (New England Biolabs, Beverley, Mass.) by pulse-field gel electrophoresis (PFG), performed on a Chef Mapper (Bio-Rad, Hercules, Calif.). Samples were run for 16 h on 1% agarose gels using 0.5× TBE buffer, at 14°C; the settings were 200 V (6V/cm) and a linear pulse time ramp from 0.3 to 33 s with a pulse angle of 120°. The gels were subsequently stained with ethidium bromide for photography. Approximate insert fragment sizes were determined by comparison with the low-range PFG size markers (New England Biolabs). Finally, the BAC contig was assembled by using SEGMAP, version 3.48 (University of Washington, Seattle, Wash.).
BAC ends sequencing and STS development
BAC DNA for sequencing was prepared from 200-ml overnight cultures, according to the modified protocol for BACs by using P100 midi-prep columns (Qiagen, Inc., Valencia, Calif.). Unique sequences from BAC ends were identified by analysis with Repeatmasker (Smit and Green 2000), and used to design PCR primers for genotyping F2 animals and to screen BAC clones to refine STS content mappling.
BAC DNA sequencing and analysis
BAC 118E21 was isolated by using an alkaline lysis protocol, followed by CsCl density gradient centrifugation. Following ethanol precipitation, the CsCl-purified DNA was resuspended at 15 ng/μl in TE. Two hundred microliter of this solution was sonicated for 2 s, with a Misonix XL2015 ultrasonicator (Farmingdale, New York). The sheared DNA was end-filled with T4 DNA polymerase, cloned into pUC18, and cut with SmaI. Twenty-five hundred transformants were grown, plasmid DNA was isolated, sequenced forward and reverse with Big Dye Terminators (PE Biosystems, Foster City, Calif.), and data were collected on an ABI3700 DNA sequencer. Sequence data were processed and assembled with the Phred, Phrap, and Consed package of programs on an SGI 02 workstation.
After BAC 118E21 was sequenced, the STS content of this BAC and overlapping BACs was confirmed by aligning the STS and BAC end sequences with the 118E21 sequence (Sequencher, Gene Codes Corporation, Ann Arbor, Mich.). Another genomic clone, AF185591, overlapped with 118E21, and their sequences were assembled by Sequencher. Repeat sequences were identified with RepeatMasker. Genscan (Burge and Karlin 1998) was used to predict gene content and intron/exon organization. The predicted proteins were submitted to a tBLASTn search through the nr and the mouse EST database at NCBI.
For identifying genes through their similarity to ESTs or gene sequences, portions of the 284-kb genomic sequence were submitted to iterative BLAST searches to find matching genes and ESTs, and the cDNAs were aligned with genomic sequence to identify intron/exon organization.
Analysis of gene expression and detection of SNPs
Primers were designed to span intron/exon junctions suggested by Genscan (Tables 4 and 5) and were used to amplify genomic and tongue cDNA. Genomic DNA was either extracted as described above or purchased from The Jackson Laboratory. Tongue cDNA was prepared as follows: total RNA was extracted by using TRIZol Reagent (Life Technologies Inc., Rockville, Md.) from enzymatically separated mouse lingual epithelium (Ruiz et al. 1995; Spielman and Brand 1995), which included fungiform, foliate, and circumvallate taste papillae. The RNA was reverse-transcribed (Superscript reverse transcriptase, Life Technologies). The cDNA samples were amplified by using AmpliTaq DNA Polymerase with GeneAmp (Perkin Elmer Corporation, Branchburg, N.J.). Single bands of expected sizes were excised from the gel, purified, and sequenced to determine the intron/exon junctions. The resulting sequence was used to confirm that the product was from the expected sequence, and to find polymorphism between strains. Sequences were aligned and polymorphisms were identified with Sequencher.
Table 4.
EST or cDNA matches and exon/intron junctions of genes in the distal region of Chr 4.
| Gene/EST Exon/CD | Exon Position Begin-End | Exon length (bp) | Detected by Genscan | Intron length (bp) | Acceptor site (intron/EXON) | Donor site (EXON/intron) |
|---|---|---|---|---|---|---|
| BG176077 | ||||||
| E1 | 22670–23413 | 744 | No | N/A | N/A | N/A |
| AA546397 | ||||||
| E1 | 23756–24249 | 494 | No | N/A | N/A | N/A |
| AI428898 | ||||||
| E1 | 26304–26696 | 393 | No | N/A | N/A | N/A |
| Pcee | ||||||
| E1a | 26817–26832 | 16 | No | N/A | N/A | N/A |
| E1b (CD1) | 26833–27114 | 282 | No | N/A | N/A | CTGCCGCAGgtaagggcc |
| E2 (CD2) | 27460–27534 | 75 | Yes | 345 | tgtccctagGTGGCCATG | TCCATGGAGgtaggcttc |
| E3 (CD3) | 27750–27859 | 110 | Yes | 215 | acatttcagCATGTGTCC | AGAGAAAAAgtgagtcct |
| E4 (CD4) | 29533–29653 | 121 | Yes | 1673 | tccctgcagGAAGCCTGT | CCTCACAAGgtgggtttg |
| E5 (CD5) | 32160–32224 | 65 | Yes | 2506 | atcttccagATAATCGTT | GACTGCATGgtgagttga |
| E6 (CD6) | 34565–34664 | 100 | Yes | 2340 | tggtttcagGAACTACAT | ACACTGGAGgtaagtatg |
| E7 (CD7) | 35017–35121 | 105 | No | 352 | tgttcccagATCCCTTTA | CGGAAAAAGgttcttttg |
| E8 (CD8) | 35206–35347 | 142 | Yes | 84 | ggttctcagGTTGATTTG | CCAAGCTGGgtgagtgtc |
| E9 (CD9) | 36039–36159 | 121 | No | 691 | gattcagtaGAATCCCCA | TGTAAATGGgtaaggtgc |
| E10 (CD10) | 36243–36336 | 94 | No | 83 | ctgtttgcaGCTTGCTGA | AAAGAGAAGgtctgtgtc |
| E11a (CD11) | 37631–37985 | 355 | No | 1294 | tctctacagGAAAAGTGA | 33UTR after stop codon |
| E11b | 37986–38638 | 653 | No | N/A | 33UTR | 33UTR |
| NM 025338 | ||||||
| E1 | 45939–46028 | 90 | No | N/A | N/A | GTCTGTTTGgtgcgtgcg |
| E2a | 46276–46308 | 33 | No | 247 | gtgttctagCTTTGAGCG | N/A |
| E2b (CD1) | 46309–46363 | 55 | No | N/A | N/A | CCTGGGCAGgtaagacgc |
| E3 (CD2) | 46645–47090 | 446 | Yes | 281 | tttccccagGTTTCAGTC | AAGAAGCAGgtgaatatg |
| E4 (DC3) | 47184–47350 | 167 | No | 93 | cccttgcagATCAAATTT | N/A |
| AK004732 | ||||||
| E1a | 54090–54134 | 45 | No | N/A | N/A | N/A |
| E1b (CD1) | 54135–54283 | 149 | Yes | N/A | N/A | TTCTTCAGAgtgagtgtg |
| E2 (CD2) | 55071–55091 | 21 | Yes | 787 | ttcttccagGCTCTGCAG | TGTCCTCAGgtcagtatc |
| E3 (CD3) | 55199–55501 | 303 | Yes | 107 | cccgacaagGGCCTTCAG | TCATTCGCGgtacactgt |
| E4 (CD4) | 55738–55839 | 102 | Yes | 236 | gccaagcagCTGTGGACA | CAGAGGATCgtgagtgtg |
| E5 (CD5) | 55955–56425 | 471 | Yes | 115 | catccgcagCCCTATTAA | CTAGCCCAGgtgtgtgtg |
| E6 (CD6) | 56846–57004 | 159 | Yes | 420 | tacatctagATCCCACCC | ACAGCGGAGgtgaggctg |
| E7 (CD7) | 57082–57121 | 40 | Yes | 77 | tcttcacagGATGCAAGA | GTCAAAGGGgtgagtttg |
| E8 (CD8) | 57194–57270 | 77 | Yes | 72 | tccctttagGAAGGATGT | TCCAGCTAGgtaggggtg |
| E9 (CD9) | 57348–57428 | 81 | Yes | 77 | cccaaccagATTACAAAA | TGGATAAAGgtgagcact |
| E10a (CD10) | 57594–57619 | 26 | No | 165 | ggcttccagAGTTCAGGA | 33UTR after stop codon |
| E10b | 57620–58382 | 763 | No | N/A | 33UTR | 33UTR |
| Dvl | ||||||
| Promoter | 59138–59177 | 40 | No | N/A | N/A | N/A |
| E1 (CD1) | 62060–62229 | 170 | No | N/A | N/A | GGACTTCGGgtcagtggg |
| E2 (CD2) | 67743–67812 | 70 | Yes | 5513 | tgaccacagGGTGGTGAA | GTTTCCTGGgtgagtcta |
| E3 (CD3) | 67962–68083 | 122 | Yes | 149 | ccttcacagCTGGTCCTG | CTCCTTCCAgtaaggccc |
| E4 (CD4) | 68308–68411 | 104 | Yes | 224 | tctatgcagTCCAAATG | GCGATGAGGgtactatgg |
| E5 (CD5) | 68655–68793 | 139 | Yes | 243 | tccccacagCTGCCCGG | TACGAGCCGgtgggtgac |
| E6 (CD6) | 68891–68984 | 94 | Yes | 97 | ctgcctcagGCTGAGCAG | ACAGACCGGgtaggcagc |
| E7 (CD7) | 69056–69125 | 70 | Yes | 71 | cctccgcagGCATCCTCC | CTCTCAACAtgggtgagg |
| E8 (CD8) | 69231–69350 | 120 | Yes | 105 | ctcctgcagAGAGGCACC | TTGCTGCAGgtgggagcc |
| E9 (CD9) | 69429–69505 | 77 | Yes | 78 | accccgtagGTGAACGAT | CCAGACAGGgtgaggtgg |
| E10 (CD10) | 69597–69664 | 68 | Yes | 91 | actctgtagGCCCATCAG | TCCCAAGGGgtgagttac |
| E11 (CD11) | 69804–69944 | 141 | Yes | 139 | cccacacagCAGCACTGA | GCGCCCCACgtaagtggc |
| E12 (CD12) | 70457–70588 | 132 | Yes | 512 | gctctgcagAGCTTGAGG | CTGTCATTGgtgagtccc |
| E13 (CD13) | 70687–70854 | 168 | Yes | 98 | tgtgcccagGGGCGGATG | TGTGCAGTAgtgagtagg |
| E14 (CD14) | 70939–71145 | 207 | Yes | 84 | tcctgccagACCTCGCAT | AGAGTGAAGgtgagaggt |
| E15 (CD15) | 72318–72691 | 374 | Yes | 1172 | tccccctagGGAGCAAGA | 33UTR after stop codon |
| Tas1r3 | ||||||
| CD1 | 77659–77469 | 191 | Yes | UN | 53UTR | GTGCAACAG/gtatggagg |
| CD2 | 77360–77060 | 301 | Yes | 108 | tggcctcag/GTTCTCACC | ATGCCACAG/gtgagccca |
| CD3 | 76979–76176 | 804 | Yes | 80 | tcaccacag/GTCAGCATA | CCCTGGCAG/gtaagggta |
| CD4 | 76064–75867 | 198 | Yes | 111 | actccacag/CTCCTGGAG | GGCAACCAG/gtaaggaca |
| CD5 | 75768–75648 | 121 | Yes | 98 | catgtacag/GTGCCAGTC | AGCATCCAG/gtgaaccgt |
| CD6 | 75472–74511 | 962 | No | 175 | tcactacag/ATGACTTCA | 33UTR after stop codon |
| NM_024472 | ||||||
| E1a | 81628–81560 | 69 | No | N/A | N/A | N/A |
| E1b (CD1) | 81628–81438 | 122 | Yes | N/A | N/A | ACTTGTCAGgtgcgtcta |
| CD2 | 81210–79608 | 1603 | No | 227 | ctttcgcagGTTTCTAAA | N/A |
| AK010425 | ||||||
| E1a | 83931–84017 | 87 | No | N/A | N/A | N/A |
| E1b (CD1) | 84018–84045 | 28 | No | N/A | N/A | CTCCCTTGGgtgagtccg |
| E2 (CD2) | 86487–86584 | 98 | Yes | 2421 | tttgagtagGGGCTGGCC | CAATGATGACgtgagtact |
| E3 (CD3) | 87210–87283 | 74 | Yes | 625 | tctcatcagAGGCGCTTT | GATCATCAGgtaggttgt |
| E4 (CD4) | 89498–89726 | 229 | Yes | 2214 | ttcccccagCCACTTCCA | ACAGTTCAGgtcaggatc |
| E5 (CD5) | 99458–99556 | 99 | No | 9731 | cctctgcagGTGGATGAT | GTCTACACGgtcagtgga |
| E6 (CD6) | 99647–99681 | 35 | No | 90 | tttggccagGGTGACTAT | GCATTTGGGgtaagtagg |
| E7 (CD7) | 99925–100063 | 139 | Yes | 243 | ctgttctagGGCTGCGTG | GGAGGAAAGgtattgact |
| E8 (CD8) | 100452–100516 | 65 | Yes | 388 | cgctcccagGTGCTGATT | GACCTTCTGgtaggtgca |
| E9 (CD9) | 101158–101347 | 190 | Yes | 641 | gacacacagGGAGCGCAT | GGTCCCATGgtaaggccc |
| E10 (CD10) | 101476–101559 | 84 | Yes | 128 | accctgcagGTTGTGTTT | AAGAACATGgtaagggtt |
| E11 (CD11) | 101792–101881 | 90 | Yes | 232 | tgcttgcagGTCATCATG | CGCCAGATGgtgagtgcc |
| E12 (CD12) | 101965–102127 | 163 | Yes | 83 | atgccacagCTGGAGGTA | AGGAATTCCgtaggcagc |
| E13 (CD13) | 102215–102322 | 108 | Yes | 87 | tttcctcagGGGTCAGCT | TGGTGCAGGgtatgaagg |
| E14 (CD14) | 102408–102469 | 62 | Yes | 85 | tcctcacagGACTGTTGC | AAAGACAGTgtaagtgta |
| E15 (CD15) | 102544–102686 | 143 | No | 74 | gccccacagAATTTCCGG | TCTCAAGAGgtgcgccct |
| E16 (CD16) | 102756–102885 | 130 | Yes | 69 | tctccttagCACCCTCAA | ACTTACCAGgtaaggagc |
| E17a (CD17) | 102980–103045 | 66 | No | 94 | tccttacagGATGAAGAG | 33UTR after stop codon |
| E17b | 103046–103228 | 183 | No | N/A | 33UTR | 33UTR |
| AA435261 | ||||||
| E1 | 105481–105412 | 70 | No | N/A | N/A | GGCCATTCGgtgagcccg |
| E2 | 105262–105113 | 150 | Yes | 149 | ttgccacagTGTACTGAA | CAGATCTGCgtgagctaa |
| E3 | 105029–104802 | 228 | No | 83 | gctctgcagGTACCTGGA | N/A |
| KIAA1716-like | ||||||
| E1 (CD1) | 110459–110528 | 70 | No | N/A | N/A | CTGGACAAGgtaagagac |
| E2 (CD2) | 110927–111046 | 120 | Yes | 398 | cacttgtagCTGGTCAAA | GTCATCTCGgtgaggcac |
| E3 (CD3) | 111244–111297 | 54 | Yes | 197 | tttcttaagGAATGTCTG | TATCACACGgtgagcccc |
| E4 (CD4) | 113735–113793 | 59 | Yes | 2437 | ctatcccagATCCTGTTT | GTCAAAGAgtaagtgac |
| E5 (CD5) | 114281–114464 | 184 | Yes | 487 | ggcacccagGGATGTGCG | GTGCTGCAGgtcagctgc |
| E6 (CD6) | 114823–114867 | 45 | Yes | 358 | ctctggcagATCAATGTC | TTAGATTCTgtgagtgct |
| E7 (CD7) | 114953–115048 | 96 | Yes | 85 | cactcgcagATGCTGTCC | GCAGCTGAGgtgagtcta |
| E8 (CD8) | 115151–115225 | 75 | Yes | 102 | tccccacagTTGGACCAG | CAGCAACGGgtgaggccc |
| E9 (CD9) | 116539–116651 | 113 | Yes | 1313 | cttcctcagGACTTTTCC | ATGGAACCGgtaagggcc |
| E10 (CD10) | 116740–116791 | 52 | Yes | 88 | ctcactcagACGGTGGTT | AAACTCAAGgtattctgg |
| E11 (CD11) | 116996–117096 | 101 | Yes | 204 | tgcccacagGATGCACTC | ACCTACCAAgtgaggagg |
| E12 (CD12) | 117169–117280 | 112 | Yes | 72 | tccctacagGAGCTGTAT | TACAGTGAGgtgcactgc |
| E13 (CD13) | 117522–117730 | 209 | Yes | 241 | atccaccagAGGCTGGAC | CATCCACAGgtagtcagt |
| E14 (CD14) | 117824–117893 | 70 | Yes | 93 | gtctaggagCTTGGGCGT | CTGCTAAAGgtgtgtgag |
| E15 (CD15) | 118003–118097 | 95 | Yes | 109 | gccccgcagCTGATGTGT | CAGTTCCAGgtgaggttg |
| E16 (CD16) | 118175–118377 | 203 | Yes | 77 | ctggtccagGCAGGACAA | TGTCCTCAGgtgggaggg |
| E17 (CD17) | 118615–118722 | 108 | Yes | 237 | cccttgcagCTGCTACTA | GTCCACGCAgtgagtgct |
| E18 (CD18) | 119877–120097 | 221 | Yes | 1154 | ctcccacagAGGGTGCCG | GTACTAGGGgtgagcaca |
| E19 (CD19) | 120274–120383 | 110 | No | 176 | gctgtccagGGTTCCTTG | CCGTACCGGgtgagttct |
| E20 (CD20) | 120476–120582 | 107 | Yes | 92 | cccagccagGTCTGTCTG | TGTCACATTgtgagtctg |
| E21a (CD21) | 120677–120825 | 149 | No | 94 | caaccccagGCTTCGCCT | 33UTR after stop codon |
| E21b | 120826–120847 | 22 | No | N/A | 33UTR | 33UTR |
| AA967911 | ||||||
| E1 | 116539–116651 | 113 | Yes | N/A | N/A | ATGGAACCGgtaagggcc |
| E2 | 116740–116791 | 52 | Yes | 88 | ctcactcagACGGTGGTT | AAACTCAAGgtattctgg |
| E3 | 116996–117096 | 101 | Yes | 204 | tgcccacagGATGCACTC | ACCTACCAAgtgaggagg |
| E4 | 117169–117280 | 112 | Yes | 72 | tccctacagGAGCTGTAT | N/A |
| BG243209 | ||||||
| E1 | 116996–117096 | 101 | Yes | N/A | N/A | ACCTACCAAgtgaggagg |
| E2 | 117169–117280 | 112 | Yes | 72 | tccctacagGAGCTGTAT | TACAGTGAGgtgcactgc |
| E3 | 117522–117730 | 209 | Yes | 241 | atccaccagAGGCTGGAC | CATCCACAGgtagtcagt |
| E4 | 117824–117893 | 70 | Yes | 93 | gtctaggagCTTGGGCGT | CTGCTAAAGgtgtgtgag |
| E5 | 118003–118097 | 95 | Yes | 109 | gccccgcagCTGATGTGT | N/A |
| BF181401 | ||||||
| E1 | 117824–117893 | 70 | Yes | N/A | N/A | CTGCTAAAGgtgtgtgag |
| E2 | 118003–118097 | 95 | Yes | 109 | gccccgcagCTGATGTGT | CAGTTCCAGgtgaggttg |
| E3 | 118175–118377 | 203 | Yes | 77 | ctggtccagGCAGGACAA | TGTCCTCAGgtgggaggg |
| E4 | 118615–118722 | 108 | Yes | 237 | cccttgcagCTGCTACTA | GTCCACGCAgtgagtgct |
| E5 | 119692–119782 | 91 | No | 969 | gtcctacagGTCTAAGCA | N/A |
| BF120370 | ||||||
| E1 | 120274–120383 | 110 | No | N/A | N/A | CCGTACCGGgtgagttct |
| E2 | 120476–120582 | 107 | Yes | 92 | cccagccagGTCTGTCTG | TGTCACATTgtgagtctg |
| E3 | 120677–121189 | 513 | No | 94 | caaccccagGCTTCGCCT | 33UTR after stop codon |
| AA547414 | ||||||
| E1 | 126572–127112 | 541 | No | N/A | N/A | N/A |
| BG085299 | ||||||
| E1 | 127208–127796 | 589 | No | N/A | N/A | N/A |
| AI550648 | ||||||
| E1 | 127744–128382 | 639 | No | N/A | N/A | N/A |
| BG070843 | ||||||
| E1 | 129539–128723 | 817 | No | N/A | N/A | N/A |
| AA763221 | ||||||
| E1 | 129440–130032 | 593 | No | N/A | N/A | N/A |
| AA218417 | ||||||
| E1 | 131044–130398 | 647 | No | N/A | N/A | N/A |
| BG066449 | ||||||
| E1 | 136781–135944 | 838 | No | N/A | N/A | N/A |
| AA199518 | ||||||
| E1 | 136706–137369 | 664 | No | N/A | N/A | N/A |
| BF140854 | ||||||
| E1 | 139653–140275 | 623 | No | N/A | N/A | N/A |
| AA823914 | ||||||
| E1 | 141472–142259 | 788 | No | N/A | N/A | N/A |
| BE956856 | ||||||
| E1 | 158678–159251 | 574 | No | N/A | N/A | N/A |
| AI530700 | ||||||
| E1 | 160031–159473 | 559 | No | N/A | N/A | N/A |
| Ubc6p | ||||||
| E1 (CD1) | 163829–163959 | 131 | Yes | N/A | N/A | TCTTGAATGgtaagacta |
| E2 (CD2) | 166294–166334 | 41 | Yes | 2334 | ctccgttagGCATTATGT | CTTATGAAGgttagtaga |
| E3 (CD3) | 170056–170158 | 103 | Yes | 3721 | ttggtgtagGTGGCTATT | CAACACAAGgtaagcttc |
| E4 (CD4) | 170244–170382 | 139 | Yes | 85 | ttctttcagGCTGTGTCT | GACTTCACGgtgaggtgt |
| E5 (CD5) | 171190–171270 | 81 | Yes | 807 | tcttcctagAAAAAACAG | GTTGTGGAGgtaagaagg |
| E6a (CD6) | 171903–172187 | 285 | Yes | 632 | ttctctcagGAAATTAAA | 33UTR after stop codon |
| E6b | 172188–172454 | 267 | No | N/A | 33UTR | 33UTR |
| NM_026125 | ||||||
| E1a | 177140–177400 | 261 | No | N/A | N/A | N/A |
| E1b (CD1) | 177401–177559 | 159 | Yes | N/A | N/A | TCCGTCAAGgtaggcaga |
| E2 (CD2) | 179365–179481 | 117 | Yes | 1805 | acttttcagCCCCCGGAA | AAGAAGTCGgtaaggccc |
| E3 (CD3) | 179590–179710 | 121 | Yes | 108 | ctcttttagCGAGGCCTC | TACTGAAAGgtaagattg |
| E4 (CD4) | 179802–179953 | 152 | Yes | 91 | tctccacagAGGCCACAG | TTCCAAGCTgtgagtggg |
| E5 (CD5) | 180416–180524 | 109 | Yes | 462 | tttccacagCCTACTACT | TGCACGTGGgtgagccag |
| E6 (CD6) | 180688–180778 | 91 | Yes | 163 | tacccgtagACCACAGTG | TCGTCATACgtgagtccc |
| E7 (CD7) | 180904–180982 | 79 | Yes | 125 | tatgcccagGTCCCTGGA | CATCTACAGgtaagcaac |
| E8a (CD8) | 181226–181334 | 109 | No | 243 | tgtctttagTCTGGACAG | 33UTR after stop codon |
| E8b | 181335–181451 | 117 | No | N/A | 33UTR | 33UTR |
| AW743506 | ||||||
| E1 | 206936–206461 | 476 | No | N/A | N/A | N/A |
| Cab45a | ||||||
| E1 | 207908–208231 | 324 | No | N/A | N/A | GAAGCCGGGgtgagtgag |
| E2 (CD1) | 211086–211415 | 330 | No | 2854 | accttgcagGAGTCCCAT | CTTTTCCAAgtaagtgtc |
| E3 (CD2) | 214029–214165 | 137 | Yes | 2613 | tgctactagGGTAGACGT | ACGGTGACGgtacagtgg |
| E4 (CD3) | 215301–215414 | 114 | Yes | 1135 | tctttttagGCCATGTTT | ATGAGGAGAgtgagtgct |
| E5 (CD4) | 223418–223576 | 159 | Yes | 8003 | ctcttgcagCACAGGAAG | GGGACTTGGgtaagacct |
| E6 (CD5) | 223775–223950 | 176 | Yes | 198 | ttatctgcagATCAGGATG | GAGCTAGAGgtgagcaag |
| E7a (CD6) | 224405–224581 | 177 | Yes | 454 | gtctcacagAACTACATG | 33UTR after stop codon |
| E7b | 224582–225468 | 887 | No | 33UTR | 33UTR | |
| Tnfrsf4 | ||||||
| E1a | 228399–228577 | 179 | No | N/A | N/A | N/A |
| E1b (CD1) | 228578–228710 | 133 | Yes | N/A | N/A | GCCAGCCAGgtgagtagc |
| E2 (CD2) | 228932–229054 | 123 | Yes | 221 | ccactacagGCCATGGTA | GCAACCATCgtgagtcc |
| E3 (CD3) | 229606–229713 | 108 | Yes | 551 | cttccctagGAAGTGGAA | TTGGAGTTGgtgagcctc |
| E4 (CD4) | 230090–230156 | 67 | No | 376 | ttgctgcagACTGTGTTC | CTGGACCAAgtgagtact |
| E5 (CD5) | 230582–230778 | 197 | Yes | 425 | gtcccacagTTGTACCTT | CTCCTGAGGgtaagggac |
| E6 (CD6) | 230858–230977 | 120 | No | 79 | tcctcatagGCCCTGCAT | AACCTTGTTgtgagtatc |
| E7a (CD7) | 231066–231136 | 71 | Yes | 88 | ttctcttagGGGGAAACA | 33UTR after stop codon |
| E7b | 231137–231293 | 157 | No | N/A | 33UTR | 33UTR |
| AW544835 | ||||||
| E1 | 235140–235698 | 559 | No | N/A | N/A | N/A |
| Tnfrsf18 | ||||||
| E1a | 241046–241090 | 45 | No | N/A | N/A | N/A |
| E1b (CD1) | 241091–241241 | 151 | Yes | N/A | N/A | ATGCTCCAGgtaaggcaa |
| E2 (CD2) | 242020–242142 | 123 | Yes | 778 | cttgtccagGCAAGGAGG | AGTCTCAAGgtatgttcc |
| E3 (CD3) | 242666–242753 | 88 | Yes | 523 | tatccacagGGGATATTG | TTGGACCAAgtaagtcct |
| E4 (CD4) | 242925–243127 | 203 | Yes | 171 | gtgtcccagCTGTTCTCA | GTCCTCGAGgtcagttgt |
| E5a (CD5) | 243199–243320 | 122 | Yes | 71 | ttactacagAGACCCAGC | 33UTR after stop codon |
| E5b | 243321–243593 | 273 | No | N/A | 33UTR | 33UTR |
| AI225779 | ||||||
| E1 | 248278–247905 | 374 | No | N/A | N/A | N/A |
| BF319334 | ||||||
| E1 | 249905–249544 | 362 | No | N/A | N/A | N/A |
| AI132502 | ||||||
| E1 | 259999–259859 | 141 | No | N/A | N/A | ACCAATCAGgtaagaacc |
| E2 | 259420–259280 | 141 | Yes | 438 | gtgttgtagTTCATGCAG | ACCTTCACGgtcagtcga |
| E3 | 252725–252550 | 176 | No | 6554 | attttacagGGCTGGTGA | N/A |
| AI595135 | ||||||
| E1 | 264205–264135 | 71 | No | N/A | N/A | TTCCTACTGgtaaggagg |
| E2 | 263876–263796 | 81 | Yes | 256 | ggtcttcagGCTGGACCC | AAGATGCAGgtggggctt |
| E3 | 263715–263583 | 133 | Yes | 80 | tatccacagACGACCTGG | AGCATCAATgtgagtaga |
| E4 | 263438–263320 | 119 | Yes | 144 | accctgcagAATCAGCAA | TTCGGGAAGgtaggagac |
| E5 | 263243–263020 | 224 | No | 76 | tctgcccagGCCAGCAGT | CCAAACCAAgtgagccca |
| E6 | 261643–261605 | 39 | No | 1376 | tctcccaagGCTGGACCC | N/A |
| AK014686 | ||||||
| E1 | 275577–275229 | 349 | No | N/A | N/A | GCCTCAGAGgtggggtgca |
| E2 | 266501–266434 | 68 | No | 8727 | cttcttcagGTTTAAACG | TCTGATCAGgtaaacatg |
| E3 | 264937–264525 | 413 | No | 1496 | tctttgcagCAGACACAG | AGGTGCCAGgtgaatgca |
| E4 | 263715–263583 | 133 | Yes | 809 | tatccacagACGACCTGG | AGCATCAATgtgagtaga |
| E5 | 263438–263320 | 119 | Yes | 144 | accctgcagAATCAGCAA | TTCGGGAAGgtaggagac |
| E6 | 263243–263117 | 127 | Yes | 76 | tctcgccagGCCAGCAGT | CCAAACCAAgtgagccca |
| E7 | 261643–261558 | 86 | Yes | 1473 | tctcccaagGCTGGACCC | AAGATGCAGgtgagaagc |
| E8 | 259420–258537 | 884 | No | 2137 | gtgttgtagTTCATGCAG | N/A |
| AI425800 | ||||||
| E1 | 275441–275352 | 90 | No | N/A | N/A | TTAGAGCAGgtgggttca |
| E2 | 266501–266434 | 68 | No | 8850 | cttcttcagGTTTAAACG | TCTGATCAGgtaaacatg |
| E3 | 264937–264618 | 320 | No | 1496 | tctttgcagCAGACACAG | GTCCAAGATgtccaagat |
| E4 | 260993–260952 | 42 | No | 3624 | taccgcaagATGCCCTTC | GGTGCAGAGgtgtgggcg |
| E5 | 260030–259995 | 36 | No | 921 | accccctagATATGTCCA | N/A |
| AW987045 | ||||||
| E1 | 270132–269542 | 591 | No | N/A | N/A | N/A |
Positions are given from the start of the 284-kb sequence, with the first base pair = +1. E = Exon, CD = Coding region, UN = Unknown, N/A = Not Applicable. The region of 1–40143 bp is from a genomic sequence identified as Cyclin ania 6b (Accession #AF185591), but because only a small part of mRNA for Cyclin ania 6b is known (Accession #AF246633), and because AF246633 is almost fully overlapped by Pcee, we denote this sequence as Pcee. For most of the KIAA1716-like gene, no mouse EST or cDNA was available, but the human sequence was a close match to the mouse genomic DNA, so the intron-exon structure of the human KIAA1716 was used to show the intron-exon structure in its mouse ortholog. This was true for all but the first exon, which was not available in human, but there was a mouse EST, which was used to predict the boundary. When there was a Unigene cluster associated with a given EST, the longest EST within the cluster was used to align genomic and cNDA sequence (BG176077 = Mm.23825, AI428898 = Mm.23492, AK004732 = Mm.28978, BF 140854 = Mm.172945, AW544835 = Mm.102764, AI595135 = Mm.159514). Several ESTs, shown above, group with Unigene clusters and therefore are likely to represent the same gene. These instances are as follows: AA547414, BG085299 and AI550648 are part of Unigene cluster Mm.56803; BG070843, AA823914 and AA763221 are part of Mm.182484; BG066449 and AA199518 are part of Mm.133906; BE956856 and AI530700 are part of Mm.322248, and AI132502, AK014686 and AI425800 are part of Mm.42006. Gene and cNDA names follow the rules outlined in Figs. 2 and 3.
Table 5.
Polymorphisms between the 129 and B6 strains for genes on mouse distal Chr 4
| Gene or EST | Source | P# | Forward Primer | Reverse Primer | Sizea (bp) | Pos (bp) | Nt B6 | Nt 129 | AA B6 | AA 129 |
|---|---|---|---|---|---|---|---|---|---|---|
| Pcee | CDNA | 1 | GCCTCACCGATCGCTATT | GGGCCTTCGTACACTTAACG | 132 | N/A | Iden | Iden | Iden | Iden |
| Pcee | CDNA | 2 | TACAGCTGCCTCCCAGGAAC | ACCTTCAGGCTCCTTTCCAT | 205 | 66 | A | A or G | Q | Q or R |
| Pcee | CDNA | 2 | TACAGCTGCCTCCCAGGAAC | ACCTTCAGGCTCCTTTCCAT | 205 | 69 | T | T or C | V | V or A |
| Pcee | CDNA | 2 | TACAGCTGCCTCCCAGGAAC | ACCTTCAGGCTCCTTTCCAT | 205 | 77 | A | A or G | N | N or D |
| Pcee | Gen | 3 | ATCGGCGACAGGCTCTACT | CTCCATGGAATGTTTCACGA | 577 | 103 | A | A or C | N/A | N/A |
| Pcee | Gen | 3 | ATCGGCGACAGGCTCTACT | CTCCATGGAATGTTTCACGA | 577 | 179 | A or G | A | N/A | N/A |
| Pcee | Gen | 3 | ATCGGCGACAGGCTCTACT | CTCCATGGAATGTTTCACGA | 577 | 428 | A or DEL | A or DEL | N/A | N/A |
| NM_025338 | CDNA | 1 | GGGGTGATTGGCAGCTATG | GGTAGATCTTCGGGGTCTGC | 508 | 95 | C | T | S | L |
| NM_025338 | CDNA | 1 | GGGGTGATTGGCAGCTATG | GGTAGATCTTCGGGGTCTGC | 508 | 344 | A | A or G | H | H or R |
| NM_025338 | CDNA | 1 | GGGGTGATTGGCAGCTATG | GGTAGATCTTCGGGGTCTGC | 508 | 392 | T or A | T | D or V | V |
| AK004732 | CDNA | 1 | GCCGAGTCTTCCACCTACAG | CAGCAAGATGAAGAGCAGCA | 215 | 127 | T | T or C | I | I or T |
| AK004732 | CDNA | 1 | GCCGAGTCTTCCACCTACAG | CAGCAAGATGAAGAGCAGCA | 215 | 182 | T | C | Y | Y |
| Dvl1 | CDNA | 1 | GATGTGGTGGACTGGCTGTA | GAAGCCAGGGTCCTGGTAAG | 330 | 73 | A | A or G | S | S or G |
| Dvl1 | CDNA | 1 | GATGTGGTGGACTGGCTGTA | GAAGCCAGGGTCCTGGTAAG | 330 | 306 | G | A | P | P |
| Tas1r3 | Gen | 1 | CACCCATTGTTAGTGCTGGA | ACGGGGTTGGTACTGTGTGT | 553 | 169 | A | G | S | S |
| Tas1r3 | Gen | 1 | CACCCATTGTTAGTGCTGGA | ACGGGGTTGGTACTGTGTGT | 553 | 197 | A | A or G | T | T or A |
| Tas1r3 | Gen | 1 | CACCCATTGTTAGTGCTGGA | ACGGGGTTGGTACTGTGTGT | 553 | 213 | T | C | I | T |
| Tas1r3 | Gen | 1 | CACCCATTGTTAGTGCTGGA | ACGGGGTTGGTACTGTGTGT | 553 | 216 | C | T | P | L |
| Tas1r3 | Gen | 2 | CGGCTGGGCTATGACCTAT | TGCATTGGCCAGACTAGAAA | 476 | 265 | T | C | N/A | N/A |
| Tas1r3 | Gen | 2 | CGGCTGGGCTATGACCTAT | TGCATTGGCCAGACTAGAAA | 476 | 306 | T | C | S | S |
| Tas1r3 | Gen | 3 | GGCAGTTGTGACTCTGTTGC | CACTCCTCCTGCTGCTTTG | 1018 | 589 | A | C | N/A | N/A |
| NM_024472 | CDNA | 1 | GGATGACTCAGAGAAAGATTTCAA | GGTCTAGCAGGGAATGCTCA | 641 | 142 | C | T | A | A |
| NM_024472 | CDNA | 1 | GGATGACTCAGAGAAAGATTTCAA | GGTCTAGCAGGGAATGCTCA | 641 | 227 | G | A | A | T |
| NM_024472 | CDNA | 1 | GGATGACTCAGAGAAAGATTTCAA | GGTCTAGCAGGGAATGCTCA | 641 | 373 | C | T | D | D |
| NM_024472 | CDNA | 1 | GGATGACTCAGAGAAAGATTTCAA | GGTCTAGCAGGGAATGCTCA | 641 | 379 | G | A | L | L |
| AK010425 | CDNA | 1 | AGGTGGATGATGAGCTGGAA | CTCTCTGCAGCGTTTGGAAT | 228 | N/A | Iden | Iden | Iden | Iden |
| AK010425 | Gen | 1 | AGGTGGATGATGAGCTGGAA | CTCTCTGCAGCGTTTGGAAT | 560 | 174 | T | G | N/A | N/A |
| AK010425 | Gen | 1 | AGGTGGATGATGAGCTGGAA | CTCTCTGCAGCGTTTGGAAT | 560 | 177 | TTT | DEL | N/A | N/A |
| AK010425 | Gen | 1 | AGGTGGATGATGAGCTGGAA | CTCTCTGCAGCGTTTGGAAT | 560 | 180 | A | DEL | N/A | N/A |
| AK010425 | Gen | 1 | AGGTGGATGATGAGCTGGAA | CTCTCTGCAGCGTTTGGAAT | 560 | 181 | TTTT | DEL | N/A | N/A |
| AK010425 | Gen | 1 | AGGTGGATGATGAGCTGGAA | CTCTCTGCAGCGTTTGGAAT | 560 | 490 | A or G | G | V | V |
| AK010425 | Gen | 2 | AACTTCGCTTCACCTGTCGT | TCCACAGTCACAGAGCCATC | 208 | N/A | Iden | Iden | Iden | Iden |
| AK010425 | CDNA | 2 | AACTTCGCTTCACCTGTCGT | TCCACAGTCACAGAGCCATC | 137 | N/A | Iden | Iden | Iden | Iden |
| AA435261 | Gen | 1 | AAATCATGTGTCCCGAGGAG | CTGCTCCTGGCCTAATCAAC | 206 | N/A | Iden | Iden | Iden | Iden |
| KIAA1716-like | Gen | 1 | CATGTGAGGACATTGAACGG | GAGTCAGCCTGCAGCATACA | 148 | N/A | Iden | Iden | Iden | Iden |
| NM_026125 | CDNA | 1 | TACTACTCAGGGCGCCTTCC | CGTATGACGATGACACAAGGA | 198 | N/A | Iden | Iden | Iden | Iden |
Gen = genomic DNA. Pos = the nucleotide number, where the first nucleotide of the Forward primer is considered nucleotide 1. Iden = B6 and 129 DNA do not differ. N/A = not applicable; because nucleotide substitution is within an intron, there is no amino acid substitution. The 129 strain has many within strain polymorphism, e.g. A to A or G, means that the nucleotide is A for the B6 strain, and it is polymorphic (A or G) within the 129 strain.
Size in cDNA is the size suggested by aligning an EST with genomic DNA; where no EST was available, the Genscan prediction was used.
P = primer pair.
Comparative analysis of mouse and human sequences
To compare the mouse and human sequences over the entire contig, we used BLAST searches to identify conserved genes between mouse and human. Homologous human genes were identified and used as queries against the human htgs and gss databases. BAC or PAC clones positive for these human sequences were scanned by electronic PCR (http://www.ncbi.nlm.nih.gov/genome/sts/epcr.cgi) to determine the map location. Those BACs or PACs that mapped to human Chr 1p36 were identified and then were assembled by overlapping BLAST alignment to determine a minimum tiling path (Fig. 2).
Fig. 2.
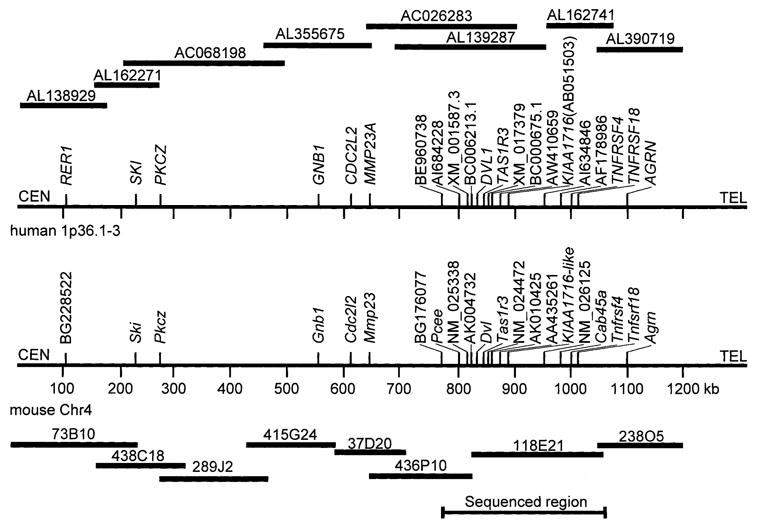
Mouse and human comparative 1.2-Mb map. The minimum tiling paths of the human BACs (upper) and mouse BACs (lower) are shown. Human BACs are identified by Accession number, and mouse BACs are identified by clone name. Mouse and human genes are denoted by approved gene symbols, if available. If no approved symbol was available in either species, Accession numbers were given. If no Accession number was found, but there was a sequence identity (see Fig. 3) the “like” suffix was added to the human gene name (KIAA1716-like).
From the minimum tiling path of ~1.2 Mb of human DNA, the sequence which corresponded to the 284-kb mouse sequence was extracted. A computer algorithm, Pipmaker (http://nog.cse.psu.edu/pipmaker), was used to analyze the sequenced mouse and human region (284 kb). The intron/exon organization used as input to Pipmaker was produced from alignment of the identified cDNAs and genes with genomic DNA (Table 4). In an initial analysis, all mouse cDNA from Table 4 was included; however, for ease of presentation, only those sequences with human–mouse similarity were retained in the final analysis.
Results and Discussion
Creation of a high-resolution linkage map
A genetic map of the subtelomeric region of mouse Chr 4 was produced by using an F2 generation of mice (N = 628) originating from the C57BL/6ByJ (B6) and 129P3/J (formerly 129/J; abbreviated here as 129) strains (Bachmanov et al. 1997). Thirty markers, which were polymorphic between the 129 and B6 strains, were genotyped, and the constructed genetic map spanned a 13.3-cM region from D4Mit33 (proximal) to D4Ertd296e (distal; Fig. 1a). Marker details are provided in Table 2.
Fig. 1.

(A) Linkage map of the distal part of mouse Chr 4. Distances between markers were estimated in cM based on data from the B6 × 129 F2 intercross (n = 628). The genetic interval from D4Mit33 to D4Ertd296e is 13.3 cM. Thick line indicates region that was physically mapped. (B) Physical map and the BAC contig of the subtelomeric region of mouse Chr 4 between D4Mit256 and K00231. BAC sizes (kb) are shown in parentheses. Dots indicate the presence of markers detected by hybridization and PCR, and in some cases, by direct sequencing.
Construction of a BAC contig
The RPCI-23 BAC library (Osoegawa et al. 2000) was screened twice to identify BAC clones covering the Sac locus. A probe prepared from a YAC clone (178B3) was used for the first screening. This YAC was mapped to the subtelomeric region of Chr 4, and it appeared to be nonchimeric. Pooled probes including all markers mapped to the subtelomeric region of Chr 4 were used for the second round of screening. To determine the BAC clones positive for each probe, we arrayed all putative clones identified from both screenings to prepare small high-density filters. Each small filter was then hybridized against individual probes. Only positive clones confirmed by both hybridization and PCR were used to construct a contig. The BAC end sequences were either obtained from databases or generated by direct sequencing. Consequently, STS markers were designed from the unique sequences of BAC ends and used to perform STS content mapping against all positive clones.
The BAC-insert sizes were determined by pulse-field gel electrophoresis. Analysis of the 42 BAC clones was conducted with the SEGMAP computer program (Green et al. 1991) and resulted in the assembly of an estimated ~1.2-Mb sequence-ready map representing a 5.1-cM region between D4Mit256 and K00231 (Fig. 1b). Since BAC clone 118E21 was the largest (246 kb) clone located within the Sac critical region, we chose it to prepare shotgun clones to generate a sequence contig with 5–6 × coverage (Accession #AF389853). Consequently, we generated 50 new STS markers (Table 2), fourteen (28%) of which were polymorphic between 129 and B6 mouse strains. These new markers were developed to fill gaps between previously described polymorphic markers, and were selected to amplify simple repeats where possible (Table 3).
Table 3.
Marker positions within the 284-kb sequenced region of distal Chr 4.
| Gene/Marker | Beginning | End |
|---|---|---|
| 280G12-T7 | 11715 | 11858 |
| 49O2-T7 | 27642 | 27810 |
| 118E21-SP6 | 29363 | 29633 |
| U37351 | 38244 | 38403 |
| 34M15-T7 | 44601 | 44218 |
| 338N4-T7 | 44905 | 45148 |
| 387F5-SP6 | 44904 | 45148 |
| 284D21-SP6 | 45018 | 45122 |
| D4Mon7 | 53569 | 53755 |
| M134G01 | 58000 | 58160 |
| D4Mon4 | 58522 | 58718 |
| D4Mon6 | 73982 | 74187 |
| D4Mon3 | 84280 | 84467 |
| D18346 | 103341 | 103506 |
| D4Xrf215 | 117690 | 118021 |
| 350D2-T7 | 143131 | 143431 |
| D4Mon41 | 144063 | 144322 |
| D4Mon43 | 144734 | 144936 |
| D4Mon44 | 145429 | 145629 |
| D4Mon48 | 151165 | 151369 |
| D4Mon49 | 151468 | 151671 |
| D4Mon50 | 153730 | 153925 |
| D4Mon52 | 155679 | 155876 |
| D4Mon53 | 155857 | 157434 |
| D4Mon54 | 157579 | 157765 |
| D4Mon31 | 157787 | 158016 |
| D4Mon56 | 160305 | 160710 |
| D4Mon5 | 161128 | 161327 |
| D4Mon58 | 164439 | 164638 |
| D4Mon59 | 165441 | 165858 |
| D4Mon60 | 167377 | 167598 |
| D4Mon33 | 167809 | 168011 |
| D4Mon62 | 171062 | 171262 |
| D4Mon34 | 172821 | 173022 |
| D4Mon63 | 173883 | 174145 |
| D4Mon64 | 175196 | 175564 |
| D4Mon36 | 182757 | 182988 |
| D4Mon66 | 183512 | 183711 |
| D4Mon37 | 187705 | 187955 |
| D4Mon39 | 197739 | 197979 |
| 139J18-SP6 | 199176 | 199407 |
| D4Mon40 | 202605 | 202865 |
| D4Mon1 | 206251 | 206451 |
| 417B22-SP6 | 213552 | 213669 |
| 227G4-T7 | 214230 | 214473 |
| D4Mon28 | 221574 | 221869 |
| D4Mon27 | 225540 | 225789 |
| D4Mon26 | 227773 | 227932 |
| 284D21-T7 | 230924 | 231061 |
| 280G12-SP6 | 231023 | 231255 |
| 387F5-T7 | 231042 | 231255 |
| 49O2-SP6 | 231113 | 231331 |
| 338N4-SP6 | 231321 | 231436 |
| 130A12-SP6 | 231328 | 231443 |
| D4Mon25 | 231647 | 231777 |
| D4Mon24 | 240095 | 240241 |
| D4Mon22 | 244624 | 245045 |
| D4Mon21 | 246689 | 246862 |
| AI225779 | 247955 | 248055 |
| D4Mon20 | 250004 | 250153 |
| D4Mon19 | 252161 | 252437 |
| D4Mon18 | 253757 | 253867 |
| D4Mon17 | 254169 | 254369 |
| D4Mon16 | 254415 | 254620 |
| D4Mon68 | 255365 | 255610 |
| D4Mon2 | 256018 | 256168 |
| D4Mon15 | 267313 | 267581 |
| D4Mon9 | 268606 | 268805 |
| D4Mon14 | 273253 | 273484 |
| D4Mon13 | 273608 | 273802 |
| D4Mon12 | 276854 | 277019 |
| D4Mon11 | 279935 | 228277 |
| 118E21-T7 | 282595 | 282779 |
Annotation of raw sequence
BLAST searches using all STSs in the region were conducted to identify any other large genomic clones that overlapped with the sequenced BAC 118E21, but only one was found (Accession #AF185591). These two clones were assembled and yielded a total sequence of 284 kb. After the sequence of the 284 kb was complete, exact STS positions within the region were identified (Table 3).
Two methods were used to identify genes within the 284-kb sequence: predicting genes by computer algorithm (the ab initio method), and by the examination of sequence similarly with other genes and ESTs. Initially, the 284-kb sequence was analyzed by masking the repetitive elements, and a computer algorithm (Gen-scan) was used to predict genes. These predicted genes and the raw sequences were submitted to iterative BLAST searches to determine their similarity to known genes or ESTs. For a predicted gene or genomic sequence to be considered an exact match to a gene or EST deposited in GenBank, the sequence similarity had to be >92% for at least 50% of the sequence (Venter et al. 2001). This degree of similarity allowed for sequencing errors or stain differences, but minimized the possibility that closely related genes were misidentified as exact matches or that alternatively spliced forms were discarded inadvertently.
Of the genes in this region, seven had locus designations and were considered known genes (Fig. 2 and 3): dishevelled, Drosphila dsh homolog (Dvl, GenBank Accession number NM_010091), Paneth cell enhanced expression gene (Pcee, Accession #NM_018856), sweet taste receptor family 1 member 3 gene (Tas1r3, Accession #AF311386), calcium-binding protein (Cab45a, Accession #U45977), a mammalian homolog of yeast UBC7 (Ubc6p, Accession #U93242), and two members of the tumor necrosis factor receptor superfamily, Tnfrsf4 (Accession #X85214; aliases Txgp1 and ox40) and Tnfrsf18 (Accession #NM_009400). Dishevelled (Dvl) is one of the best-characterized genes in the region. It was originally discovered because it is an ortholog of the Drosophila dishevelled (dsh) gene, a gene that influences the development of the fly body plan. In the mouse, Dvl influences complex social and sensorimotor behavior (Lijam et al. 1997; Lee et al. 1999). Several Dvl homologs are located on other mouse chromosomes. The tumor necrosis factor receptors Tnfrsf4 and Tnfrsf18 are involved in immune function and cancer biology. Ubc6p is a homolog of the ubiquitin-conjugating enzyme, but to the best of our knowledge, functional studies with this gene and associated enzyme have not been conducted. The calcium-binding protein Cab45a is present in the lumen of the Golgi apparatus (Scherer et al. 1996). Tas1r3 belongs to a small family of taste receptors (Hoon et al. 1999), is expressed in taste receptor cells, and has been suggested as a candidate gene for the Sac locus (Bachmanov et al. 2001; Kitagawa et al. 2001; Max et al. 2001; Montmayeur et al. 2001; Nelson et al. 2001; Sainz et al. 2001).
Fig. 3.
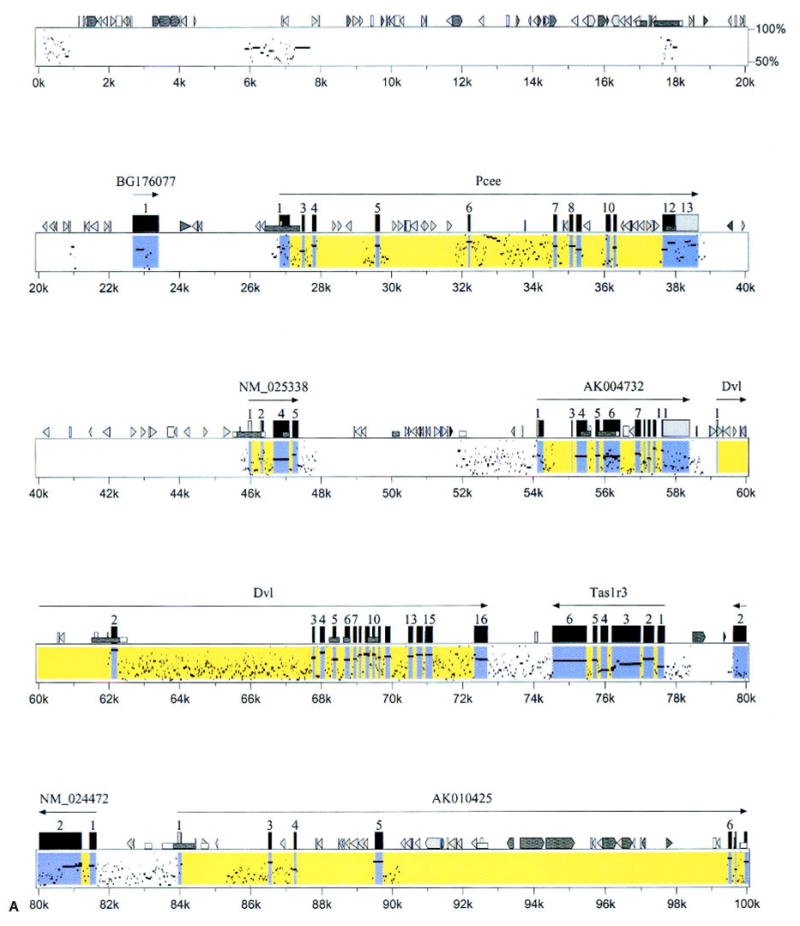
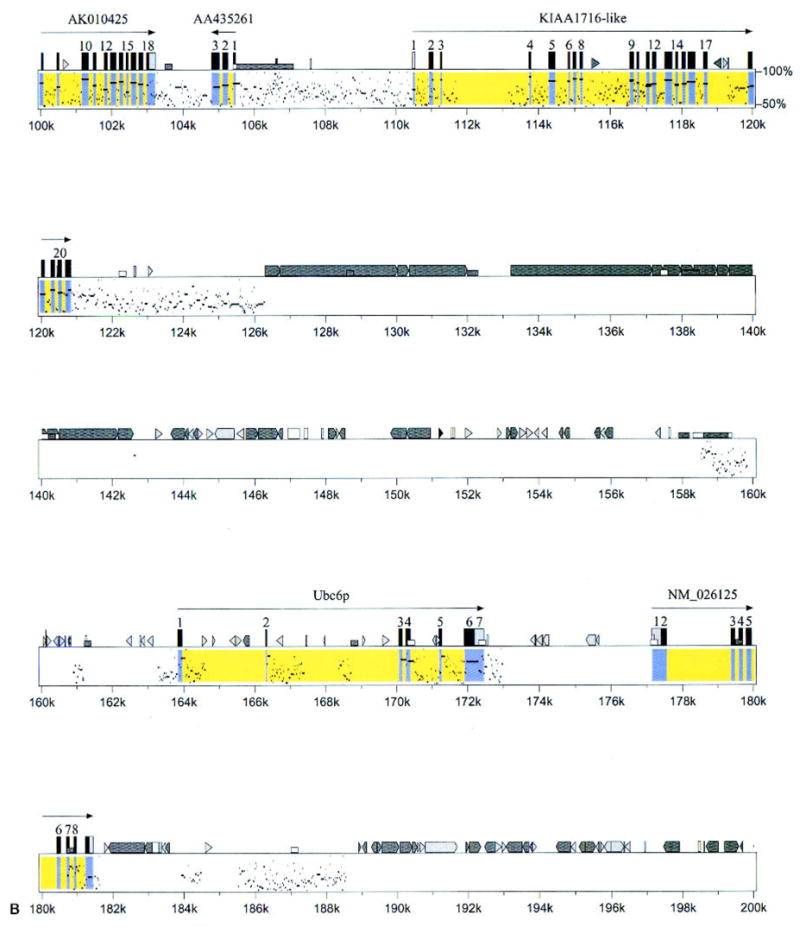
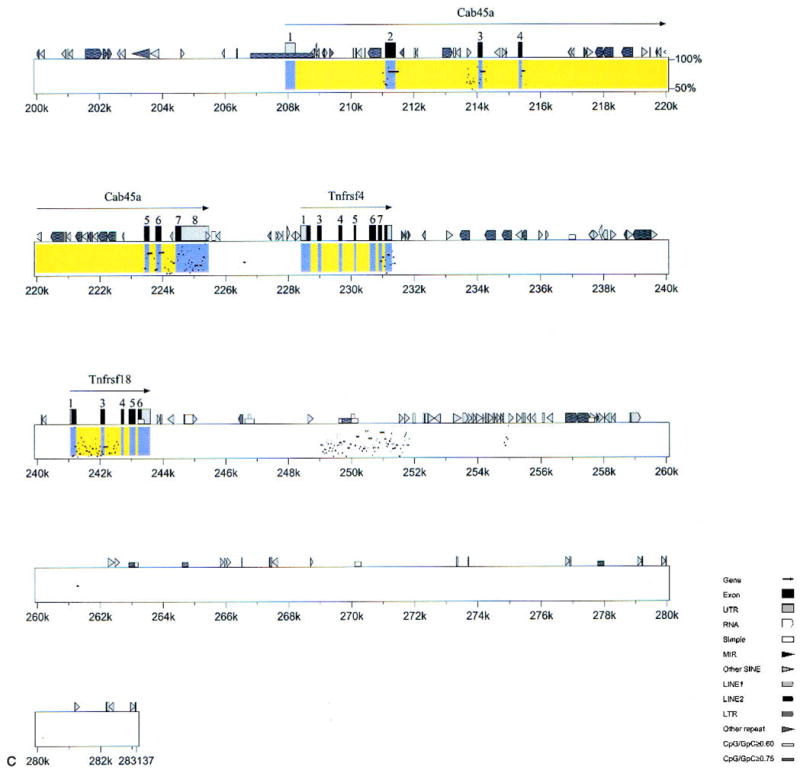
Percentage identity plot-based comparative map of mouse and human genomes. The mouse genomic sequence is upper, and the human genomic draft sequence is lower, assembled from three overlapping human BAC clones (Accession # AC026283, AL139287, and AL162741). Both the mouse and human sequences are oriented from the centromere (left) to telomere (right), and the percentage identity is shown on the vertical axis (50–100%). The portions of the figure corresponding to exons with exact matches to known genes are yellow; those with exact matches to cDNAs are blue. Mouse cDNA sequences with no homology to human genomic sequence are not included. Mouse genes are denoted as described in Fig. 2.
In addition to the known genes, other putative genes were identified because sequences within this region matched 15 existing EST clusters (Mm.23825, Mm.23492, NM_025338, Mm.28978, NM_024472, Mm.22021, Mm.56803, Mm.182484, Mm.133906, Mm.172945, Mm.32248, NM_026125, Mm.102764, Mm.42006, and Mm.159514) and 11 single cDNA clones (AA546397, AA435261, AA967911, BG243209, BF181401, BF120370, AA218417, AW743506, AI225779, BF319334, AW987045; Table 4). The function of these genes, other than that suggested by expression patterns inferred from tissue libraries from which they were derived, are unknown.
To further confirm that putative genes were actual genes, the EST sequences were aligned with genomic DNA and the intron/exon junctions identified (Table 4). The location of each exon for each gene or EST was determined, as well as the acceptor and donor sites. If we assume that all exons identified by alignment of cDNA with genomic DNA are true exons, then Genscan accurately predicted 58% of the exons. If we assume that all EST clusters or single, non-overlapping ESTs are genes, Genscan predicted at least one exon correctly for 41% of genes.
Characterization of genes within this region
Several genes were selected for further study because they were located within a critical region for the taste-related QTL, Sac (Bachmanov et al. 2001). The intron/exon structure of these genes was determined by PCR amplification of genomic and tongue cDNA, using primers that spanned intronic sequence. The PCR experiments were designed to confirm that the predicted genes were present as mRNA, to assess the accuracy of predicted intron/exon junctions, and to determine whether these genes were expressed in tongue. Tongue is an un-derrepresented tissue as a source of template for publicly available EST sequencing data.
Of the seven genes tested, all were expressed in mouse tongue (primers are given in Table 5; results are given in Tables 4 and 5). Of the 16 intron/exon junctions tested by PCR, two junctions predicted by the computer algorithm did not match the junction obtained from sequencing of the cDNA (12.5%; Table 5). The results of this experiment confirm gene expression in tongue cDNA.
Analysis of single nucleotide polymorphisms within genomic and cDNA
Genes within the critical Sac region were sequenced by using genomic and cDNA derived from the B6 and 129 strains. The purpose of this experiment was two-fold: to discover allelic genes that could be considered candidate genes for the Sac locus, and to identify single nucleotide polymorphisms (SNPs) useful for genetic mapping.
SNPs were detected, on average, every 100–200 bp. Most genes were polymorphic between the two strains, and the frequency of nucleotide variants did not differ appreciably from gene to gene. In addition to nucleotide substitutions, small insertions and deletions were a frequent source of polymorphisms between strains. All sequence variants detected in coding regions were either silent or missense mutations (Table 5); no nonsense or frameshift mutations were found, nor were any variants detected that would alter an intron/exon splice junction.
There were several sequence variants within the 129 strain. The possibility that these variants were due to sequencing artifacts was excluded by re-sequencing of the areas, which confirmed the heterozygosity of the 129 strain in all cases.
Comparative map between mouse and human
To construct a human–mouse comparative map (Fig. 2), the sequences in the human that align with the 1.2-Mb mouse contig were identified. To do this, mouse genes were submitted to multiple BLAST searches of the human nr, est, htgs, and gss databases. For comparative mapping, we used human sequences that fit all three of the following criteria: (1) they were highly homologous to mouse genes; (2) they were located on human Chr 1p36; and (3) they were contained within a BAC or PAC clone.
The selected positive human BACs were then assembled, a minimum tiling path was selected, and the mouse genes and their human homologs were aligned (Fig. 2). This human sequence was compared with the mouse sequence, by using the PIP algorithm that plots percentage identity between two sequences (Schwartz et al. 2000). Almost all named genes in mouse were present in the human sequence, and they were arranged in the same order on the chromosome (Fig. 3). In many areas outside of the predicted exons, there were highly conserved sequences between mouse and humans (e.g., 6–8 kb, 121–126 kb; Fig. 3). These highly conserved regions may represent undetected exons or important and highly conserved regulatory elements.
Conclusions
We have described the genetic and physical map of the subtelomeric region of mouse Chr 4, and a comparative map of the region of conserved synteny in humans. Several interesting features of this region were found. First, gene densities near the mouse and human telomeres are high. More than 20 genes were confirmed within the 284-kb sequence in the mouse. High gene density of the human telomeric region has been demonstrated (Saccone et al. 1992), and the current report suggests this is true in mice, to the extent that Chr 4 is representative.
Second, the human-mouse conservation between gene order and number was strong. Almost all named genes were present in both mouse and human, and in the same order along the chromosome. There is, however, a caveat to the interpretation of the mouse-human conserved synteny map: the human BAC clones were derived from the htgs database, and are unfinished. Although the PIP algorithm we used takes into account the possibility of broken clones and creates the most likely alignment, some adjustment of gene order may occur as finished sequence is available. The region of strict conserved synteny extends over at least 1.2 Mb (the size of the mouse–human contig and homology map). Mapping data from other sources indicate that the homology may extend as far as 1p31 (http://genome.ucsc.edu).
Third, the recombination frequency in this region was very high. The 1.2-Mb region represented in the BAC contig corresponded to a genetic distance of over 5 cM as measured in an F2 mapping panel. This high rate of recombination has been observed in mouse telomeric regions (de Boer and Groen 1974). This terminal map expansion is fortunate for those mapping quantitative traits or genes, because more informative meioses are obtained than in less recombinogenic regions of the genome. The high rate of recombination, and its beneficial effects on gene mapping, partially offset the difficulties encountered in sequencing telomeric regions.
The rate of polymorphisms detected between the two mouse strains, B6 and 129, suggests that many of the genes may have altered function because of numerous amino acid substitutions. The B6 and 129 strains are only distantly related, and the large number of polymorphisms makes these strains good choices for gene mapping studies. Compared with data collected in a large-scale effort to map SNPs among mouse strains (Lindblad-Toh et al. 2000), the frequency of SNPs in distal Chr 4 was more than threefold higher than elsewhere in the mouse genome for comparable strains.
Polymophisms between substrains of the 129 strains have been well characterized (Simpson et al. 1997), but the rate of heterozygosity within the 129P3/J strain was surprising: inbred strains are supposed to be homozygous at all loci. This finding is consistent with our observations during genotyping with microsatellite markers, which identified some polymorphisms within the 129P3/J substrain (Bachmanov et al., unpublished observations). The rate of within substrain polymorphisms could account for some of the phenotypical within-strain variation of the 129 substrain, such as variable agenesis of the corpus callosum (Wahlsten 1982). Several explanations are possible for this variability within this inbred strain. The 129P3/J substrain is maintained using a forced heterozygosity mating scheme: in each generation, heterozygotes at the albino locus Tyrc/Tyrc-ch are mated with homozygotes, Tyrc/Tyrc. This mating scheme has been conducted at The Jackson Laboratory since 1948 (Withham 1990). The forced heterozygosity may account for variation in the albino region on Chr7, but should not increase the level of heterozygosity of other regions. Alternatively, the increased heterozygosity might be due to the later initiation of inbreeding of the 129P3/J strain compared with other inbred strains. Another possibility might be that the strains could have been contaminated, like other substrains of the 129 strain (Simpson et al. 1997). Finally, the 129P3/J strain could be unusually prone to de novo mutations. Further study of the heterogeneity of the 129P3/J strain should be conducted, because this heterozygosity could have impact upon QTL mapping or other phenotypic studies.
There are two ways to detect genes within genomic DNA sequence: prediction of genes using computer algorithms, and similarity searches. Both work well at identifying most genes, but neither method identifies all genes with certainty. Ab initio methods, implemented with Genscan, detected more than half of the genes in our study, but the genes detected were not necessarily assembled with the same intron/exon boundaries found in the cDNA. These Genscan assemblies could be errors, or they could reflect alternatively spliced forms of a gene that are undetected because they are expressed in tissues not represented in cDNA libraries, or have a low abundance. Comparisons of the genomic sequence using sequence similarity methods also provided additional information about the presence of genes and their structures, many of which were not identified through the Genscan analysis. Still, other genes could exist in this region, and the regions of high sequence similarity identified through the PIP analysis would be good candidates for the undetected genes. The publicly available human draft sequence was poorly annotated in this region and reflected less than half of the gene content of the current analysis (http://genome.ucsc.edu/). Therefore, it is still important for investigators to annotate genomic regions rather than to rely on the annotation available through public and private databases.
Annotation of genomic sequence and predicting genes through areas of conserved synteny with other species should be approached cautiously. For example, regions of high human–mouse homology existed, and in some cases the sequence encompassed a known gene in one species, but not in the other species, and no cDNAs in the other species were found. A case in point is the Ubc6p gene in the mouse: there is a high sequence homology between mouse and human genomic sequence, but without the presence of human cDNAs, further work would be needed to name the human sequence appropriately. Another challenge was the large number of orphan mouse cDNAs in the region; many of these cDNAs could represent novel genes, but it was difficult to determine this accurately without additional work.
Examination of this region led to the identification of many genes that were polymorphic between B6 and 129 mice, near the peak linkage interval for Sac, and that were expressed in the tongue. Of these genes, Tas1r3 is the best candidate for the Sac locus (Bachmanov et al. 2001; Kitagawa et al. 2001; Max et al. 2001; Montmayeur et al. 2001; Nelson et al. 2001; Sainz et al. 2001).
The detailed genetic, physical, and comparative maps created here will assist in identification of loci that influence development, behavior, and disease susceptibility, and the sequence-ready BAC contig will be useful for the public Mouse Sequencing consortium. While drafts of the homologous regions are now available from human DNA (Human Genome Sequencing Consortium 2001; Venter et al. 2001), comparison of the maps described herein with the recently released human draft suggests that gaps still remain in the human sequence, particularly in areas closest to the telomere. Identification of all genes in human and mouse subtelomeric regions and the closing of telomeric gaps will involve more effort than that taken to close gaps in other regions of the genome.
Acknowledgments
We thank Tim Wiltshire and Maja Bucán for advice about physical mapping, and R. Arlen Price for help with initial genotyping of F2 hybrids. We also thank Joe Catanese, Dulce San Juan, and Al Cairo for help with the physical mapping. The excellent technical support of Sarah Tobias and Pfizer Global Research and Development-Alameda genotyping and sequencing core is acknowledged. This work was supported by National Institutes of Health grants R01DC00882 (G.K. Beauchamp), R03DC03509, R01DC04188 and R01DK55853 (D.R. Reed), R01AA11028 (M.G. Tordoff) and R03DC03853 (A.A. Bachmanov), and by a special grant from the Ambrose Monell Foundation.
Footnotes
The nucleotide sequence data reported in this paper have been submitted to GenBank and have been assigned the accession numbers: G67732–G67781 (STS D4Mon1-D4Mon68), AF311386 (Tas1r3 gene) and AF389853 (BAC RPCI-23-118E21).
References
- Bachmanov AA, Reed DR, Tordoff MG, Price RA, Beauchamp GK. Intake of ethanol, sodium chloride, sucrose, citric acid, and quinine hydrochloride solutions by mice: a genetic analysis. Behav Genet. 1996a;26:563–573. doi: 10.1007/BF02361229. [DOI] [PMC free article] [PubMed] [Google Scholar]
- Bachmanov AA, Tordoff MG, Beauchamp GK. Ethanol consumption and taste preferences in C57BL/6ByJ and 129/J mice. Alcohol Clin Exp Res. 1996b;20:201–206. doi: 10.1111/j.1530-0277.1996.tb01630.x. [DOI] [PMC free article] [PubMed] [Google Scholar]
- Bachmanov AA, Reed DR, Ninomiya Y, Inoue M, Tordoff MG, et al. Sucrose consumption in mice: major influence of two genetic loci affecting peripheral sensory responses. Mamm Genome. 1997;8:545–548. doi: 10.1007/s003359900500. [DOI] [PMC free article] [PubMed] [Google Scholar]
- Bachmanov AA, Li X, Reed DR, Ohmen JD, Li S, et al. Positional cloning of the mouse saccharin preference (Sac) locus. Chem Senses. 2001;26:925–933. doi: 10.1093/chemse/26.7.925. [DOI] [PMC free article] [PubMed] [Google Scholar]
- Belknap JK, Crabbe JC, Plomin R, McClearn GE, Sampson KE, et al. Single-locus control of saccharin intake in BXD/Ty recombinant inbred (RI) mice: some methodological implications for RI strain analysis. Behav Genet. 1992;22:81–100. doi: 10.1007/BF01066794. [DOI] [PubMed] [Google Scholar]
- Blizard DA, Kotlus B, Frank ME. Quantitative trait loci associated with short-term intake of sucrose, saccharin and quinine solutions in laboratory mice. Chem Senses. 1999;24:373–385. doi: 10.1093/chemse/24.4.373. [DOI] [PubMed] [Google Scholar]
- Burge CB, Karlin S. Finding the genes in genomic DNA. Curr Opin Struct Biol. 1998;8:346–354. doi: 10.1016/s0959-440x(98)80069-9. [DOI] [PubMed] [Google Scholar]
- Church G, Gilbert W. Genomic sequencing. Proc Natl Acad Sci USA. 1984;81:1991–1995. doi: 10.1073/pnas.81.7.1991. [DOI] [PMC free article] [PubMed] [Google Scholar]
- de Boer P, Groen A. Fertility and meiotic behavior of male T70H tertiary trisomics of the mouse (Mus musculus) Cytogenet Cell Genet. 1974;13:489–510. doi: 10.1159/000130303. [DOI] [PubMed] [Google Scholar]
- Dietrich W, Katz H, Lincoln SE, Shin H-S, Friedman J, et al. A genetic map of the mouse suitable for typing intraspecific crosses. Genetics. 1992;131:423–447. doi: 10.1093/genetics/131.2.423. [DOI] [PMC free article] [PubMed] [Google Scholar]
- Eicher EM, Washburn LL, Schork NJ, Lee BK, Shown EP, et al. Sex-determining genes on mouse autosomes identified by linkage analysis of C57BL/6J-YPOS sex reversal. Nat Genet. 1996;14:206–209. doi: 10.1038/ng1096-206. [DOI] [PubMed] [Google Scholar]
- Feinberg AP, Vogelstein B. A technique for radiolabeling DNA restriction endonuclease fragments to high specific activity. Anal Biochem. 1983;132:6–13. doi: 10.1016/0003-2697(83)90418-9. [DOI] [PubMed] [Google Scholar]
- Fuller JL. Single-locus control of saccharin preference in mice. J Hered. 1974;65:33–36. doi: 10.1093/oxfordjournals.jhered.a108452. [DOI] [PubMed] [Google Scholar]
- Green ED, Mohr RM, Idol JR, Jones M, Buckingham JM, et al. Systematic generation of sequence-tagged sites for physical mapping of human chromosomes: application to the mapping of human chromosome 7 using yeast artificial chromosomes. Genomics. 1991;11:548–564. doi: 10.1016/0888-7543(91)90062-j. [DOI] [PubMed] [Google Scholar]
- Hoon MA, Adler E, Lindemeier J, Battey JF, Ryba NJ, et al. Putative mammalian taste receptors: a class of taste-specific GPCRs with distinct topographic selectivity. Cell. 1999;96:541–551. doi: 10.1016/s0092-8674(00)80658-3. [DOI] [PubMed] [Google Scholar]
- Inoue M, McCaughey S, Bachmanov AA, Beauchamp GK. Whole nerve chorda tympani responses to sweeteners in C57BL6/ByJ and 129P3/J mice. Chem Senses. 2001;26:915–923. doi: 10.1093/chemse/26.7.915. [DOI] [PMC free article] [PubMed] [Google Scholar]
- International Human Genome Sequencing Consortium. Initial sequencing and analysis of the human genome. Nature. 2001;409:860–921. doi: 10.1038/35057062. [DOI] [PubMed] [Google Scholar]
- Kitagawa M, Kusakabe Y, Miura H, Ninomiya Y, Hino A. Molecular genetic identification of a candidate receptor gene for sweet taste. Biochem Biophys Res Commun. 2001;283:236–242. doi: 10.1006/bbrc.2001.4760. [DOI] [PubMed] [Google Scholar]
- Lander E, Green P, Abrahamson J, Barlow A, Daley M, et al. MAPMAKER: An interactive complex package for constructing primary linkage maps of experimental and natural populations. Genomics. 1987;1:174–181. doi: 10.1016/0888-7543(87)90010-3. [DOI] [PubMed] [Google Scholar]
- Leamy L, Routman E, Cheverud J. A search for quantitative trait loci affecting asymmetry of mandibular characters in mice. Evolution. 1997;51:957–969. doi: 10.1111/j.1558-5646.1997.tb03676.x. [DOI] [PubMed] [Google Scholar]
- Lee JS, Ishimoto A, Yanagawa S. Characterization of mouse dishevelled (Dvl) proteins in Wnt/Wingless signaling pathway. J Biol Chem. 1999;274:21464–21470. doi: 10.1074/jbc.274.30.21464. [DOI] [PubMed] [Google Scholar]
- Li X, Inoue M, Reed DR, Huque T, Puchalski RB, et al. High-resolution genetic mapping of the saccharin preference locus (Sac) and the putative sweet taste receptor (T1R1) gene (Gpr70) to mouse distal Chromosome 4. Mamm Genome. 2001;12:13–16. doi: 10.1007/s003350010236. [DOI] [PMC free article] [PubMed] [Google Scholar]
- Lijam N, Paylor R, McDonald MP, Crawley JN, Deng CX, et al. Social interaction and sensorimotor gating abnormalities in mice lacking DvI1. Cell. 1997;90:895–905. doi: 10.1016/s0092-8674(00)80354-2. [DOI] [PubMed] [Google Scholar]
- Lindblad-Toh K, Winchester E, Daly MJ, Wang DG, Hirschhorn JN, et al. Large-scale discovery and genotyping of single-nucleotide polymorphisms in the mouse. Nat Genet. 2000;24:381–386. doi: 10.1038/74215. [DOI] [PubMed] [Google Scholar]
- Lush IE. The genetics of tasting in mice. VI. Saccharin, acesulfame, dulcin and sucrose. Genet Res. 1989;53:95–99. doi: 10.1017/s0016672300027968. [DOI] [PubMed] [Google Scholar]
- Lush IE, Hornigold N, King P, Stoye JP. The genetics of tasting in mice. VII. Glycine revisted, and the chromosomal location of Sac and Soa. Genet Res. 1995;66:167–174. doi: 10.1017/s0016672300034510. [DOI] [PubMed] [Google Scholar]
- Martin B, Clement Y, Venault P, Chapouthier G. Mouse chromosomes 4 and 13 are involved in beta-carboline-induced seizures. J Hered. 1995;86:274–279. doi: 10.1093/oxfordjournals.jhered.a111581. [DOI] [PubMed] [Google Scholar]
- Max M, Shanker YG, Huang L, Rong M, Liu Z, et al. Tas1r3, encoding a new candidate taste receptor, is allelic to the sweet responsiveness locus Sac. Nat Genet. 2001;28:58–63. doi: 10.1038/ng0501-58. [DOI] [PubMed] [Google Scholar]
- Montmayeur JP, Liberles SD, Matsunami H, Buck LB. A candidate taste receptor gene near a sweet taste locus. Nat Neurosci. 2001;4:492–498. doi: 10.1038/87440. [DOI] [PubMed] [Google Scholar]
- Nelson G, Hoon MA, Chandrashekar J, Zhang Y, Ryba NJ, et al. Mammalian sweet taste receptors. Cell. 2001;106:381–390. doi: 10.1016/s0092-8674(01)00451-2. [DOI] [PubMed] [Google Scholar]
- Orita M, Iwahana H, Kanazawa H, Hayashi K, Sekiya T. Detection of polymorphisms of human DNA by gel electrophoresis as single-strand conformation polymorphism. Proc Natl Acad Sci USA. 1989;86:2766–2770. doi: 10.1073/pnas.86.8.2766. [DOI] [PMC free article] [PubMed] [Google Scholar]
- Osoegawa K, Tateno M, Woon PY, Frengen E, Mammoser AG, et al. Bacterial artificial chromosome libraries for mouse sequencing and functional analysis. Genome Res. 2000;10:116–128. [PMC free article] [PubMed] [Google Scholar]
- Riethman H. Closing in on telomeric closure. Genome Res. 1997;7:853–855. doi: 10.1101/gr.7.9.853. [DOI] [PubMed] [Google Scholar]
- Rodrigues NR, Cornall RJ, Chandler P, Simpson E, Wicker LS, et al. Mapping of an insulin-dependent diabetes locus, Idd9, in NOD mice to chromosome 4. Mamm Genome. 1994;5:167–170. doi: 10.1007/BF00352349. [DOI] [PubMed] [Google Scholar]
- Ruiz C, McPheeters M, Kinnamon S. Tissue culture of rat taste buds. In: Brand J, editor. Experimental and Cell Biology of Taste and Olfaction: Current Techniques and Protocols. Boca Raton: CRC Press, Inc; 1995. pp. 79–84. [Google Scholar]
- Saccone S, De Sario A, Della Valle G, Bernardi G. The highest gene concentrations in the human genome are in telomeric bands of meta-phase chromosomes. Proc Natl Acad Sci USA. 1992;89:4913–4917. doi: 10.1073/pnas.89.11.4913. [DOI] [PMC free article] [PubMed] [Google Scholar]
- Sainz E, Korley JN, Battey JF, Sullivan SL. Identification of a novel member of the T1R family of putative taste receptors. J Neurochem. 2001;77:896–903. doi: 10.1046/j.1471-4159.2001.00292.x. [DOI] [PubMed] [Google Scholar]
- Sambrook J, Fritsch E, Maniatis T. Molecular Cloning: A Laboratory Manual. Cold Spring Harbor, N.Y.: Cold Spring Harbor University Press; 1989. [Google Scholar]
- Scherer PE, Lederkremer GZ, Williams S, Fogliano M, Baldini G, et al. Cab45, a novel (Ca2+)-binding protein localized to the Golgi lumen. J Cell Biol. 1996;133:257–268. doi: 10.1083/jcb.133.2.257. [DOI] [PMC free article] [PubMed] [Google Scholar]
- Schwartz S, Zhang Z, Frazer KA, Smit A, Riemer C, et al. Pip-Maker—a web server for aligning two genomic DNA sequences. Genome Res. 2000;10:577–586. doi: 10.1101/gr.10.4.577. [DOI] [PMC free article] [PubMed] [Google Scholar]
- Silveira PA, Baxter AG, Cain WE, van Driel IR. A major linkage region on distal chromosome 4 confers susceptibility to mouse autoimmune gastritis. J Immunol. 1999;162:5106–5111. [PubMed] [Google Scholar]
- Simpson EM, Linder CC, Sargent EE, Davisson MT, Mobraaten LE, et al. Genetic variation among 129 substrains and its importance for targeted mutagenesis in mice. Nat Genet. 1997;16:19–27. doi: 10.1038/ng0597-19. [DOI] [PubMed] [Google Scholar]
- Smit F, Green P. Repeatmasker. 2000 http://ftp.genome.washington.edu/cgi-bin/RepeatMasker, Computer program.
- Spielman A, Brand J. Collection of taste tissue from mammals. In: Brand JG, editor. Experimental Cell Biology of Taste and Olfaction: Current Techniques and Protocols. Boca Raton: CRC Press, Inc; 1995. pp. 25–32. [Google Scholar]
- Stoye JP, Kaushik N, Jeremiah S, Best S. Genetic map of the region surrounding the retrovirus restriction locus, Fv1, on mouse chromosome 4. Mamm Genome. 1995;6:31–36. doi: 10.1007/BF00350890. [DOI] [PubMed] [Google Scholar]
- Taylor B. Epistatic circling gene of C57L/J. Mouse News Lett. 1976;55:17. [Google Scholar]
- Truett GE, Heeger P, Mynatt RL, Truett AA, Walker JA, et al. Preparation of PCR-quality mouse genomic DNA with hot sodium hydroxide and tris (HotSHOT) Biotechniques. 2000;29:52–54. doi: 10.2144/00291bm09. [DOI] [PubMed] [Google Scholar]
- Venter JC, Adams MD, Myers EW, Li PW, Mural RJ, et al. The sequence of the human genome. Science. 2001;291:1304–1351. doi: 10.1126/science.1058040. [DOI] [PubMed] [Google Scholar]
- Wahlsten D. Deficiency of corpus callosum varies with strain and supplier of the mice. Brain Res. 1982;239:329–347. doi: 10.1016/0006-8993(82)90513-3. [DOI] [PubMed] [Google Scholar]
- Withham B (1990) Coat colors of sublines of 129 mice: JAX notes, no. 441