

Abstract
Despite its biological importance, our knowledge of active site structure and relevance of critical amino acids in CYP2E1 catalytic processes remain limited. In this study, we identified CYP2E1 active site residues using photoaffinity labeling with 7-azido-4-methylcoumarin (AzMC) coupled with a CYP2E1 homology model. In the absence of light, AzMC was an effective competitor against substrate p-nitrophenol oxidation by CYP2E1. Photoactivation of AzMC led to a concentration-dependent loss in CYP2E1 activity and structural integrity resulting from the modification of both heme and protein. The photolabeling reaction degraded heme and produced a possible heme adduct. Probe incorporation into the protein occurred at multiple sites within substrate recognition sequence 5 (SRS-5). Based on a CYP2E1 homology model, we hypothesize AzMC labels SRS-5 residues, Leu363, Val364 and Leu368, in the active site. In addition, we propose a series of phenylalanines, especially Phe106, mediate contacts with the coumarin.
Keywords: cytochrome, P450 2E1, CYP2E1, photoaffinity, labeling, modeling, active site, azido
Introduction
Microsomal cytochrome P450 (CYP)1 enzymes (EC 1.14.14.1) are major catalysts in the oxidative transformation of a structurally diverse class of compounds including steroids, fatty acids, hormones, antibiotics, and a wide variety of artificially produced chemicals in Phase I metabolism of xenobiotic compounds, e.g. drugs, food additives, and environmental contaminants (1). CYPs convert lipid-soluble molecules to more water-soluble forms and in effect, modulate transport and other chemical properties. To accommodate a wide array of compounds, typical CYP catalysts have evolved low specificity and activity toward substrates, making interpreting and predicting catalytic properties difficult. An important step forward in the field of xenobiotic metabolism would be a deeper understanding of the structure of the active site mediating substrate recognition and product profile for theses compounds.
In common with other members of the CYP1-3 families, CYP2E1 has broad substrate specificity. More than 70 different chemicals with diverse structures have been identified as substrates for CYP2E1 (2, 3); nevertheless, these molecules are typical small (molecular weight <100) and hydrophobic in character. Among the substrates are alcohols/ketones/aldehydes (e.g. ethanol), nitrosamines, alkanes, halogenated alkanes, and anaesthetics. CYP2E1 also recognizes some molecules possessing one or two rings including benzene, caffeine, acetaminophen, isoniazid, and resveratrol with p-nitrophenol (pNP) (4) and chlorzoxazone (5) being considered typical marker substrates. In addition to xenobiotic metabolism, growing evidence supports an important physiological role for CYP2E1 in gluconeogenesis (3). CYP2E1 is regulated similarly to enzymes contributing to gluconeogenesis in relation to starvation and diabetes and in fact, recognizes precursors to gluconeogenesis, acetone, acetol (1-hydroxyacetone), and fatty acids (6) as substrates. Taken together, these findings implicate a degree of selectivity for the CYP2E1 activity through a restrictive active site.
Although great strides have been made to determine the X-ray crystallographic structure of several microsomal CYPs (7–9), not all enzymes are amenable to this approach resulting in a continued challenge to define the structure of CYP active sites. Through the alignment of sequences from known members of the CYP2 family, Gotoh (10) assigned possible substrate recognition sites (SRS), which have formed the basis of studies by other groups. Based on those types of analyses, several groups have used site-directed mutagenesis to explore the role of functional residues (11–13). An alternative technique utilizes the catalytic ability of the enzyme to convert a bound substrate to a reactive product capable of modifying the active site protein or heme (14, 15). Analysis of the site of labeling implicates residues in contact with the substrate or the accessibility of the heme to the substrate. Similarly, the use of photoactivatible substrate analogs provides a methodology to modify the CYP active site following exposure of the bound complex to light. Photoaffinity labeling of CYP1A2 (16) and CYP2B4 (17) have provided valuable information toward their respective substrate binding sites. In contrast, our knowledge concerning active site structure and the relevance of critical amino acids in CYP2E1 catalytic processes remain limited.
In the absence of a known structure for CYP2E1, we employed 7-azido-4-methylcoumarin (AzMC) as a probe for identifying active site residues that participate in the recognition of the relatively large two-ringed CYP2E1 substrates, e.g. chlorzoxazone (5), quinoline (18), and coumarin (19). This photoaffinity probe has been used successfully to characterize the active sites of the Phase II xenobiotic-metabolizing enzymes, SULT1A1 (20) and UGT1A6 (21). To demonstrate the specificity of AzMC for rabbit CYP2E1, we assayed the ability of the reagent to compete with p-nitrophenol (pNP) during the oxidation of pNP to p-nitrocatechol (pNC). Photoactivation of AzMC led to the breakdown of the azido group of AzMC to form N2 and the reactive 7-nitrene-4-methylcoumarin (nMC), which can insert into organic molecules, e.g. CYP2E1 protein and heme. The effect of incorporation on CYP2E1 structural integrity was determined by measuring the reduced CO spectra for CYP2E1, a hallmark for competent CYP enzymes, and the presence of intact heme by HPLC. To identify site of incorporation in the CYP2E1 protein, we digested the modified protein and subjected the fragments to MALDI-MS analysis. As a complement to this approach, we generated a CYP2E1 homology model to confirm the location of active site residues identified by photoaffinity labeling and provide insights to other potential active site residues.
Materials and Methods
Reagents
C41 (DE3) cells used in CYP2E1 expression were purchased from Avidis (France). Topp3 cells, which are no longer commercially available, were propagated in the laboratory. Terrific broth modified for genomics was bought from US Biological (Swampscott, MA). Protein purification resins, 2’, 5’ -ADP-agarose and Reactive Red 120 Type 3000-CL, were obtained from Sigma-Aldrich (St. Louis, MO). SP-sepharose was purchased from GE Healthcare Life Sciences (Piscataway, NJ). Components of the NADPH regenerating system (NADP+, glucose 6-phosphate, torula yeast glucose 6-phosphate dehydrogenase) were purchased from Sigma-Aldrich. In addition, dilauroyl-L-α-phosphatidylcholine, p-nitrophenol, p-nitrocatechol, 2-nitroresorcinol, bovine erythrocyte superoxide dismutase, catalase, and sodium dithionite (hydrosulfite) were obtained from Sigma-Aldrich. In addition to HPLC grade acetonitrile (CH3CN) and trifluoroacetic acid, ampicillin, isopropyl-β-D-thiogalactopyranoside, lysozyme, diethylaminoethyl cellulose (DEAE), dithiothreitol (DTT), protease inhibitors, and other basic chemicals were purchased from Fisher Scientific (Houston, TX). The photoaffinity probe, 7-azido-4-methylcoumarin (AzMC) was synthesized as described previously (21). Purified rabbit liver cytochrome b5 was provided as a generous gift from Wayne L. Backes (LSU Health Science Center, New Orleans).
Construction and expression of rabbit CPR-K56Q
A proteolytically-resistant mutant form of rabbit CPR-K56Q was prepared by site-directed mutagenesis and then expressed in Topp3 Escherichia coli cells (Stratagene). The pSC-WT (gift from Lucy Waskell, Univ. of Michigan Medical School) expression vector was used for site-directed mutagenesis using QuickChange (Stratagene, La Jolla, CA) protocol. Oligonucleotide primers used in the generation of CPR-K56Q were as follows (mismatch indicated by the underlined base): rabCPR-K56Q-For 5′-CCCGAGTTCACCCAGATCCAGGCCCCGACG-3′; rabCPR-K56Q-Rev 5′-CGGGGCCTGGATCTGGGTGAACTCGGGCAC-3′. Expression of pSC-rabCPR-K56Q vector was carried out using a slight modification of the procedure described by Hanna et al (22, 23). In brief, CPR eluted from 2’,5’-ADP agarose column was loaded on to a pre-equilibrated DEAE column and washed extensively (40 column volumes) with buffer containing 20 mM potassium phosphate pH 7.6, 1 mM EDTA and 20 % glycerol to remove residual amounts of detergents from the protein sample. Bound CPR was eluted with buffer containing 50 mM potassium phosphate pH 7.6, 300 mM KCl, 1 mM EDTA and 20 % glycerol. CPR elutes in a small volume which was then applied on Zeba desalting spin column (Pierce Biotechnology, Rockford, IL) pre-equilibrated with 50 mM potassium phosphate pH 7.4, 1 mM EDTA and 20 % glycerol. The flow through from the desalting column was quantitated spectrophotometrically using the extinction coefficient for difference in absorbance between 456 nm and 690 nm (baseline) (ε = 21 mM−1 cm−1) (24). Protein was then aliquoted into 2 mL screw-capped tubes and stored at −80°C. Apart from using protease inhibitor cocktail, 0.4 KIU/mL aprotinin was included in all buffers used throughout the purification protocol to prevent N-terminal degradation of CPR.
Preparation of CYP2E1 protein
Rabbit CYP2E1 was expressed in E. coli C41 (DE3) (Avidis, France) strain transformed with the pLW01/2E1 expression plasmid (gift from WL Backes, LSU, NO) using a modification of the procedure described by Cheng D et al. (25). Transformed cells were grown in special terrific broth (US biological TB-modified for genomics) and induced with isopropyl-β-D-thiogalactopyranoside for protein expression similar to the published protocol. The published purification strategy was followed exactly until loading the solubilized CYP2E1 onto DEAE column. The DEAE column flow through containing CYP2E1 was subjected to ultra-centrifugation to pellet down any precipitant. The solubilized supernatant was then loaded on a CL-120 Reactive Red 3000 (high substitution) column (2.5 × 12 cm), which was equilibrated with 10 mM potassium phosphate pH 7.4, 0.5 % Tergitol NP-10, 0.1 mM EDTA, 30 μM 4-methylpyrazole and 20 % glycerol (Buffer A). The reactive red column was then rinsed with buffer A containing total of 20 mM potassium phosphate (buffer B) until no color came off in the flow through. 250 ml of Buffer B containing 50 mM NaCl was used to rinse the column to remove contaminating proteins from the column. CYP2E1 was then eluted with buffer B containing 400 mM NaCl and fractions were collected. Fractions containing CYP2E1 were pooled and dialyzed against 10 mM potassium phosphate, 0.3 % Tergitol NP-10 and 20 % glycerol to reduce the ionic strength of the pooled fraction. After 3 dialysis changes (4 hr each), 0.2 % cholate was added to the dialyzed CYP2E1 and loaded on a strong cation exchanger, SP sepharose fast flow (sulpho propyl), which was equilibrated with the dialysis buffer containing 0.2 % cholate. Tightly bound CYP2E1 was washed with 10 mM potassium phosphate pH 7.4, 0.2 % cholate, 20 % glycerol (buffer C) followed by an extensive wash with buffer C with no cholate to remove detergent as monitored by absorbance at 280nm. CYP2E1 was then eluted with buffer C with no detergent and 400 mM potassium phosphate. After elution of CYP2E1 from SP-sepharose column, the protein was dialyzed against storage buffer containing 100 mM potassium phosphate buffer, pH 7.4, 0.1 mM EDTA, and 20 % glycerol. Protein was then concentrated using Macrosep Centrifugal Devices (Pall Life Sciences) with a MWCO of 10 KDa and then quantitated spectrophotometrically by the reduced CO spectrum difference spectrum using the extinction coefficient of 91 mM−1cm−1 (26). Protein homogeneity was confirmed by SDS-PAGE analysis. Aliquots of the protein were transferred to 2 mL screw-capped tubes and stored at −80°C.
Photoaffinity labeling of CYP2E1 with 7-azido-4-methylcoumarin
The photo-labeling reaction was carried out following a previously published protocol (27). The specific conditions for our photo-labeling reaction included CYP2E1, DLPC, and phosphate buffer, which resembled typical conditions for catalytic studies. A final concentration of 1 μM CYP2E1 was added to 100 mM potassium phosphate pH 7.4 and 20 μM dilauroyl-L-α-phosphatidylcholine in an amber screw-capped microfuge tube. To this solution was added the 7-azido-4-methylcoumarin (AzMC) prepared as a stock solution in DMSO. The dilution of the compound into the reaction resulted in a final concentration 1 % DMSO in the reaction. Once all components were added, the reaction solution was incubated at room temperature for 5 min and then placed on ice. Samples were exposed to a handheld UV light (366 nm; UVP-21 Ultraviolet Products, Inc. San Gabriel, CA) for 30 min except for one control reaction. Following the labeling reaction, Tris•HCl pH 8.0 was added to the solution to a final concentration of 100 mM. The Tris buffer served as a scavenger of any remaining or future activated forms of AzMC due to the vast excess of AzMC relative to the concentration of CYP2E1 and the high reactivity of the Tris amine group. To demonstrate the dependence of the reaction on AzMC concentration, the labeling reaction was carried at 25, 50, 100, 250, and 500 μM AzMC. As negative controls, only DMSO was added to one reaction, while 500 μM AMC was added to another reaction, which was not exposed to light. To demonstrate AzMC specificity for the active site, one reaction contained 250 μM AzMC in the presence of 250 μM pNP.
CYP2E1 integrity
To assess the effects of labeling on the structure of CYP2E1 active, the reduced CO spectrum for all samples were measured to quantitate properly folded CYP2E1, as described (28). Modifications of the protein that severed the heme-thiolate bond would eliminate the characteristic 450 nm spectrum for the reduced CYP2E1 with CO bond at the active site. Due to the small volume of the labeling reactions, 25 μL of the reaction was transferred to a microcuvette containing 100 μL 100 mM potassium phosphate pH 7.4, 20 % glycerol. A tip of a spatula of sodium dithionite was added to the cuvette, mixed, and then sealed. Using a Jasco V-550 spectrophotometer (Jasco Inc., Easton, MD), a background scan was taken of the sample from 400 to 500 nm. CO was blown over the solution for 2 min, resealed, and shaken gently to ensure saturation. The absorbance of the reduced CO complex was then taken over the same wavelength range and converted to concentration using the extinction coefficient 91 mM−1 cm−1 (28).
For sensitivity and resolution of reaction components, we employed an HPLC method to quantitate residual heme for the samples. A fresh heme stock was made by resuspending hemin in 20 mM NaOH and boiled for 3 min. After cooling on ice for 5 min, the solution was centrifuged to remove insoluble particulates and the supernatant transferred to a fresh tube. The concentration of the heme solution was determined spectrophotometrically in 0.1 N NaOH using the extinction coefficient 58.4 mM−1 cm−1 at 385 nm (29). Heme standards prepared in 100 mM potassium phosphate pH 7.4 and labeled samples were boiled 3 min, placed on ice 5 min to cool, and then centrifuged 10 min at 15,000 rpm to pellet denatured protein. The supernatant was transferred to low volume HPLC vial and injected onto a Waters Symmetry C18 3.5 μm 4.6 x 75 mm column with a gradient from 75:25 to 25:75 0.1 % trifluoroacetic acid/H2O:CH3CN mobile phase over 10 min at a flow rate of 1 mL min−1. The elution of heme was monitored at 405 nm. Heme content of reaction samples were determined based on a heme standard curve using the software program GraphPad Prism (San Diego, CA).
CYP2E1 activity
To measure residual activity and AzMC competition for the CYP2E1 active site, we measured the activity toward p-nitrophenol by CYP2E1 following the addition of obligate redox partners at 37 ºC. Rabbit CYP2E1 was diluted 40-fold to a final concentration of 25 nM in a reaction containing 100 nM CPR-K56Q and 50 nM cyt b5. The reaction contained also 250 μM pNP, 100 mM potassium phosphate pH 7.4, 20 μM dilauroyl-α-L-phosphatidylcholine (DLPC), 2 U μL−1 catalase, 0.04 μg μL−1 superoxide dismutase, and an NADPH regenerating system [2 μU μL−1 glucose 6-phosphate dehydrogenase, 10 mM glucose 6-phosphate, 2 mM MgCl2, 1 mM NADP+] and incubated for 5 min at 37 ºC. Prior to use, catalase was dialyzed against 20 mM potassium phosphate buffer pH 7.4, 10 % glycerol to remove the thymol preservative. The CYP2E1 reaction was initiated upon addition of NADP+. At three time points, an aliquot was taken from the reaction and quenched with CH3CN containing 2-nitroresorcinol (internal standard). After three time points were obtained, the samples were centrifuged. The supernatant was transferred to low volume HPLC vial and injected onto a Waters Symmetry C18 3.5 μm 4.6 x 75 mm column with a 75:25 0.1 % trifluoroacetic acid/H2O:CH3CN mobile phase at a flow rate of 2 mL min−1. The elution of pNC, the internal standard, and pNP were monitored at 320 nm. pNC production during the reaction was quantitated based on the analysis of pNC standard. The corresponding concentrations were plotted as a function of time and the initial rate determined by linear regression with the software program GraphPad Prism (San Diego, CA). All initial rate determinations were performed in at least duplicate.
We performed a series of pNP assays at different AzMC concentrations to assess the ability of AzMC to compete with pNP and inactivate CYP2E1 in the absence of light. Reactions were prepared with 0, 0.5, 5, 15, and 50 μM AzMC present, but no pNP. The reconstituted system consisted of 25 nM CYP2E1, 100 nM CPR-K56Q, 50 nM cyt b5, and other necessary reaction components. The reactions were initiated upon addition of NADP+, and at 3 min time intervals, pNP was added to a final concentration of 250 μM. The oxidation of pNP was then measured as described previously. The natural log of the resulting initial rates at each AzMC concentration was plotted as a function of pre-reaction time relative to pNP oxidation. These data were fit to Equation 1 describing the loss of enzyme activity:
| (1) |
whereby ν, kobs, and b represent activity at time t, t = 0 (maximal activity), and t = ∞ (minimal activity), respectively. The least squares fit of the kobs values as a function of AzMC concentration to Equation 2 yielded values for Ki and kinact.
| (2) |
To measure residual activity, an aliquot of the labeling reaction was diluted 40-fold into the reaction solution containing 250 μM pNP, and treated CYP2E1 was reconstituted with redox partners to yield 25 nM CYP2E1, 100 nM CPR-K56Q, and 50 nM cyt b5. The corresponding initial reaction rates were normalized to the negative DMSO only control (100 % activity) and plotted as a function of AzMC concentration.
Mass spectrometric identification of AzMC-modified CYP2E1
A sample of 0.6 μg of photoaffinity-labeled CYP2E1 was subjected to proteolysis with 75 ng of trypsin (Roche). The resulting peptides were concentrated on a C18 ZipTip (Millipore) and spotted in 2,5-dihydroxybenzoic acid for MALDI mass spectrometric analysis (30). Accurate and sensitive mass analysis was performed with a MALDI prOTOF mass spectrometer (PerkinElmerSciex) to identify the site(s) of 7-nitrene-4-methylcoumarin incorporation, the photoactivated product of AzMC. Tandem mass analysis was performed on a vMALDI-LTQ ion trap mass spectrometer (Thermo). The same sample was analyzed on each machine via a custom, interchangeable sample stage.
Homology modeling
Because no three-dimensional structure is available for rabbit CYP2E1, we created a molecular model to visualize the sites of labeling by AzMC. The sites of labeling also provided a test for the model since other studies will demonstrate the specificity of AzMC toward the CYP2E1 active site. The construction of the CYP2E1 model was made using the rabbit CYP2C5 crystal structure (PDB entry 1dt6) (7) as a template. The CYP2E1 sequence was aligned with that of CYP2C5 using the SIM program (31). The CYP2E1 sequence used for modeling was truncated prior to Pro33 due to the lack of any structural information for the membrane-binding N-terminus. The model coordinates were obtained using the software ProModII from the Swiss Institute of Bioinformatics (http://swissmodel.expasy.org). Energy minimization was performed using the GROMOS96 program (BIOMOS). Molecular graphics were generated by PYMOL (http://pymol.sourceforge.net).
Results
Establishing conditions for assessing labeling of CYP2E1
Due to the structural similarity to AzMC, we chose initially to assay CYP2E1 activity using 7-ethoxy-4-trifluoromethylcoumarin (7EFC). This substrate undergoes hydroxylation at the alpha position of the ethoxy group to form a hemiacetal. The unstable product decomposes to yield highly fluorescent 7-hydroxy-4-trifluoromethylcoumarin, which can be readily quantitated relative to standards. Numerous groups have reported success using this substrate as a marker reaction for CYPs (32), including CYP2E1 (13). Nevertheless, we observed weak activity toward 7EFC by CYP2E1 (data not shown), as reported by others (33). Based on this observation, we switched to using the oxidation of p-nitrophenol (pNP) as a marker reaction for CYP2E1 activity. Although AzMC possesses a different functional group at the 7-position than 7EFC, we were concerned about the ability of AzMC to effectively interact with CYP2E1 and provide useful active site information. Thus, demonstrating the specificity of AzMC for CYP2E1 was an important goal in this study.
In addition, we discovered CYP2E1 was unstable in HEPES buffer in the absence of bound ligand or the presence of CPR-K56Q. Initial efforts to label CYP2E1 with AzMC in 100 mM HEPES pH 7.5 resulted in the complete loss of activity even in the absence of AzMC. To ensure reactions conditions preserved active CYP2E1 (unless modified by the label), we conducted mock reactions varying reaction conditions and then measured residual CYP2E1 activity toward pNP. For these studies AzMC was omitted or substituted with 250 μM the isosteric molecule 7-hydroxy-4-methylcoumarin (7HC). The control conditions were HEPES at pH 7.5. Two of the reactions contained either 20 % glycerol or 1 μM CPR-K56Q (1 equivalent) in HEPES. For another reaction we substituted HEPES with 100 mM potassium phosphate pH 7.4. Glycerol and potassium phosphate are often used in storage buffer for CYP2E1 and thus stabilize the enzyme. CPR-K56Q may trap CYP2E1 in a conformation poised to turnover substrate rather than adopting a pathway to inactivation.
Following the mock labeling reaction in HEPES buffer, no activity was measured toward pNP (Table 1). Both glycerol and potassium phosphate buffer stabilized CYP2E1 equally but not completely. Under these conditions, 28 % of the activity was lost during the manipulation of the samples. The presence of CPR-K56Q resulted in fully active CYP2E1. The inclusion of ligand (7HC) resulted in complete retention of activity in the presence of glycerol, CPR-K56Q, and potassium phosphate buffer, but not in the sample with only HEPES buffer indicating that all of the CYP2E1 was rapidly inactivated within the first five min of incubation at room temperature. The ability of ligands to stabilize CYP2E1 is well documented (3), but the inactivation of the enzyme at a relatively high concentration of protein (1 μM) in a common assay buffer was surprising. Based on these observations, potassium phosphate was used in the labeling reactions and efforts were made to minimize diluting CYP2E1 in the absence of ligand or CPR-K56Q.
Table 1.
Percent activity following mock labeling reactionsa
| Ligand presence | Mock labeling reaction conditions | |||
|---|---|---|---|---|
| 100 mM HEPES pH 7.5 | 100 mM HEPES pH 7.5, 20 % glycerol | 100 mM HEPES pH 7.5, 1 μM CPR-K56Q | 100 mM potassium phosphate, pH 7.4 | |
| None | < 18 | 72 ± 6 | 120 ± 10 | 72 ± 6 |
| + 200 μM 7HC | < 18 | 100 ± 13 | 105 ± 18 | 79 ± 3 |
Experiments were performed in 100 mM potassium phosphate pH 7.4, 20 μM dilauroyl-α-L-phosphatidylcholine, 2 U μL−1 catalase, and 0.04 μg μL−1 superoxide dismutase, with 250 M pNP and a NADPH-regenerating system [2 μU μL−1 glucose 6-phosphate dehydrogenase, 10 mM glucose 6-phosphate, 2 mM MgCl2, 1 mM NADP+]. The final enzyme concentrations were 25 nM CYP2E1, 100 nM CPR-K56Q, and 50 nM cyt b5. The reported values reflect the results from average of 2–3 experiments including the standard deviation from the mean.
AzMC as a substrate competitor and inactivator of CYP2E1
A key requirement for the utility of photoaffinity labeling is the ability to demonstrate the specificity of the reagent for the target or active site in our case. “Surprisingly, in the absence of light, AzMC not only inhibited CYP2E1 activity but, inactivated CYP2E1 in a time and concentration dependent manner, as shown in Figure 1.” Longer incubation times for the reaction in the absence of pNP lead to lower observed rates for the turnover of this substrate. An increase in AzMC concentration to 50 μM demonstrated a gradual increase in the loss of activity as a function of time. Based on a double reciprocal plot of the data (Figure 1, inset), AzMC proved to be an effective competitor for the CYP2E1-catalyzed reaction demonstrating a Ki value of 0.45 ± 0.15 μM under steady-state conditions. Despite the absence of light for these experiments, AzMC also proved to be an effective inactivator of CYP2E1 displaying a rate of inactivation of 0.165 ± 0.025 min−1. Little is known about the CYP-mediated metabolism of compounds containing an azido with the exception of zidovudine (AZT). In the absence of molecular oxygen, AZT undergoes a one electron reduction to yield an amino product (34). If this reaction were to occur for CYP2E1, this product would likely be a competitive inhibitor for the enzyme, but not an inactivator. Nevertheless, the mechanism for this inactivation is beyond the scope of this study. The competitive inhibition and inactivation of CYP2E1 activity by AzMC supports the conclusion that AzMC binds to the CYP2E1 active site.
Fig. 1.

Inhibition and inactivation of CYP2E1 by non-photoactivated AzMC. Time dependent loss of pNP activity is plotted as a function of time and [AzMC], i.e. 0 (○), 0.5 (■), 5 (▲), 15 (●), and 50 (▼) μM AzMC. Inset figure shows the linear regression analysis of the reciprocal plot for the rate of loss in activity versus [AzMC]. Experiments were performed as described in Methods with 250 μM pNP at final enzyme concentrations of 25 nM CYP2E1, 100 nM CPR-K56Q, and 50 nM cyt b5. The reported values reflect the results from average of 2–3 experiments including the standard deviation from the mean.
Residual activity toward pNP following AzMC incorporation
If AzMC binds to the active site and labels CYP2E1, then the activity for the enzyme would be expected to gradually be lost at higher AzMC concentrations as saturation of the active site leads to higher incorporation of the label. In accordance with this prediction, Figure 2 indicates that increasing AzMC concentration in the reaction led to a sharp drop in activity reaching a plateau value of ~10 % the rate of pNP turnover in the absence of AzMC. The curvature of the loss in activity is strikingly similar to the expected trend for the formation of a complex between CYP2E1 and a titrant, or in this case, AzMC. A fit of the data to a simple binding hyperbola yielded an apparent Kd value of 12 ± 2 μM. The lack of complete inactivation of the enzyme indicates a small population of CYP2E1 is protected from the inactivation event. One possible explanation is that a subpopulation of CYP2E1 exists with AzMC bound in a nonproductive orientation for modification of the enzyme, although such a prospect would require further study. The inclusion of pNP in the labeling reaction offered measurable but limited protection. Ultimately, the ability for pNP to protect CYP2E1 from covalent modification of the active site by AzMC is dependent on the dissociation constants for pNP and AzMC, respectively. The tighter CYP2E1 binds AzMC over pNP, the weaker protective effect pNP will have for CYP2E1. Evidence for this possibility is suggested by the data for the reactions with 500 μM AzMC. Exposure of the sample to light and subsequent labeling of CYP2E1 was not necessary to decrease activity by ~90 %, which is likely due to the capacity of AzMC to inhibit turnover based on a Ki of 0.45 μM. The integrity of the negative control reaction was confirmed by retention of properly folded protein as discussed in the following section.
Fig. 2.
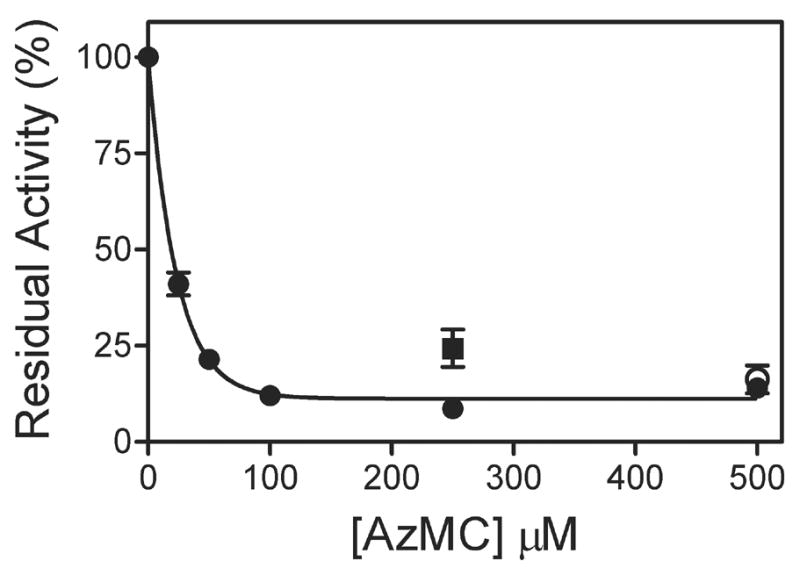
Residual activity following photoactivation of AzMC. The loss of activity as a function of [AzMC] is shown (●), as well as the effect of the presence of 250 μM pNP (■) or the absence of light (○). Experiments were performed as described in Methods with 250 μM pNP at final enzyme concentrations of 25 nM CYP2E1, 100 nM CPR-K56Q, and 50 nM cyt b5. The reported values reflect the results from average of 2–3 experiments including the standard deviation from the mean.
Effects of labeling on CYP2E1 structure
The reactive nitrene formed from photoactivated AzMC is capable of inserting into any adjacent organic molecule including both the protein scaffold and heme in the active site. A hallmark of properly folded CYPs is the formation of a chromophore at 450 nm following reduction in the presence of CO. A loss of CO-reactive hemoprotein may reflect a perturbation of CYP2E1 structure due to the incorporation of the photoaffinity probe. As shown in Table 2, AzMC induced a concentration-dependent decrease in native CYP2E1 to < 20 %, the limit of detection for the assay. This process was partially blocked by the presence of pNP (25 ± 3 %), although effect was modest as observed for the protective effect on residual activity (Figure 2). The absence of light in the negative control resulted in complete retention of the CYP2E1 conformation (99 ± 3 %). The DMSO control indicated almost a fourth of the protein became unfolded (73 ± 3 %), which is consistent with the lower stability of the protein in the absence of bound ligand, e.g. AzMC, as discussed previously.
Table 2.
Percent retention of native CYP2E1 propertiesa.
| [AzMC] μM | ||||||||
|---|---|---|---|---|---|---|---|---|
| 0 | 25 | 50 | 100 | 250 | 250 + 250 μM pNP | 500 | 500, no light | |
| Percent native CYP2E1 | 73 ± 3 | 52 ± 3 | < 20 | < 20 | < 20 | 25 ± 3 | < 20 | 99 ± 3 |
Final conditions for quantitation of CYP2E1 by reduced CO spectra were 0.1 μM CYP2E1 in 100 mM potassium phosphate pH 7.4, 20 % glycerol. The reported values reflect the results from average of two experiments including the standard deviation from the mean.
Chromatographic analysis of the heme content of the reactions revealed the loss of heme and formation of a product in a process dependent on bound AzMC and light. The resolution of reaction components absorbing at 405 nm is shown in Figure 3. Heme eluted at 8.33 min (Peak 3) with traces of porphyrin sometimes observed eluting at 7.13 min (Peak 2). Peak 5 at 10.53 min proved to be the AzMC reagent, which was light sensitive. The addition of AzMC also introduced some contaminants that increased with AzMC concentration and were not affected by the exposure of the reaction to light (Peaks 1 and 6). Peak 4 at 10.17 min appeared only in the presence of CYP2E1 and exposure of the sample to light indicating the compound is likely a product of the photoactivation of AzMC with CYP2E1. Generation of the product was inhibited by the presence of the substrate pNP. In addition, photoactivation of AzMC in the presence of free heme did not yield this product. These observations suggest the photolabeling reaction could have modified the active site heme to form a more hydrophobic product leading to the loss of native heme
Fig. 3.
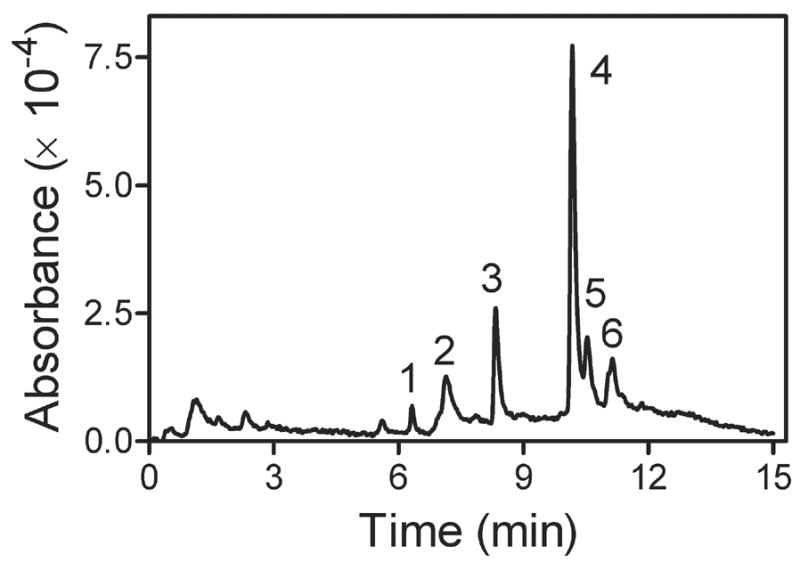
Chromatogram of heme and other reaction components. Chromatographic resolution of the reaction components accomplished by HPLC using a gradient from 75:25 to 25:75 0.1 % trifluoroacetic acid/H2O:CH3CN mobile phase over 10 min at a flow rate of 1 mL min−1 and monitoring eluents at 405 nm. Based on controls, the identity of the peaks are as follows: 1, contaminant derived from AzMC; 2, porphyrin; 3, heme (iron-porphyrin); 4, possible heme-nMC adduct; 5, AzMC; 6, contaminant derived from AzMC.
As observed by the reduced CO spectra, the native state of CYP2E1 was compromised by photoactivation of AzMC. The quantitation of heme from the reaction samples indicated a decrease in heme content at higher AzMC concentrations to ~5 % of the original total (Figure 4, Panel A). The hyperbolic trend of the data is similar to what would be predicted by a binding event between CYP2E1 and AzMC such that saturation of the binding site leads to maximal labeling of CYP2E1. A fit of the data to a binding hyperbola yielded a Kd of 37 ± 7 μM, which is higher than that observed for the residual activity studies. The higher apparent Kd from the heme loss data is partially due to heat-catalyzed heme degradation in the presence of AzMC (and possible derivatives), because ~50 % loss of the heme was lost in the negative control samples (500 μM AzMC, no light) (Figure 4, Panel A) despite no change in reduced CO spectra (Table 2). The samples containing higher concentrations of AzMC would then undergo more heme degradation leading to an overestimation of heme loss and a shallower curve, hence larger apparent Kd. The increase in the compound at Peak 4 provided a complement to the loss in heme including the protective effects of pNP and the absence of light (Figure 4, Panel B). Both reduced CO spectra and heme analysis measure the ability of photoactivated AzMC to compromise CYP2E1 function and structure, respectively, which likely involve different mechanisms of interaction.
Fig. 4.
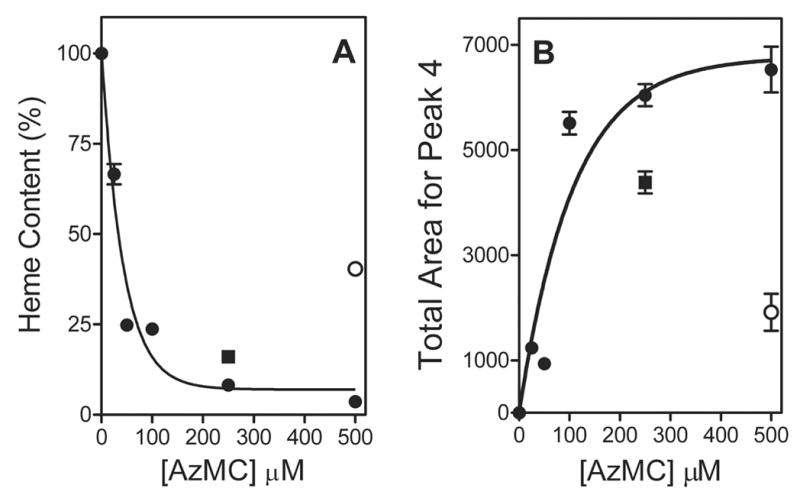
Analysis of reaction components resolved by HPLC. The reported values reflect the results from average of 2–3 experiments including the standard deviation from the mean. (A) Heme loss as a function of [AzMC] relative to the control reaction (●), as well as the effect of the presence of 250 μM pNP (■) or the absence of light (○). (B) Increase in area corresponding to Peak 4, a possible heme-nMC adduct, as well as the effect of the presence of 250 μM pNP (■) or the absence of light (○).
Identifying the site of labeling by MALDI mass spectrometry
The exposure of the reagent to light leads to the generation of a highly reactive nitrene product, which incorporates into any adjacent organic molecules, e.g. the CYP2E1 heme or protein scaffold. The modification leads to a characteristic mass increase detectable by mass spectral analysis. In this study, we digested modified CYP2E1 with trypsin and the resulting peptides were measured by MALDI mass spectrometry. We observed 85% tryptic peptide sequence coverage for CYP2E1. Only one peptide was identified that had a mass addition (173 Da) consistent with insertion of 7-nitrene-4-methylcoumarin on tryptic peptide F360-R374 (Figure 5, Panel A). The 1881 Da peptide was of low signal to noise ratio, but readily distinguishable from the background. The modified peptide was subjected to tandem mass analysis in order to confirm the modification (Figure 5, Panel B). Numerous b- and y-ions were observed to be both modified as well as unmodified, which confirmed that the F360-R374 peptide was modified by the AzMC reagent. The modified F360-R374 peptide was the only modified protein fragment identified in two independent analyses. Moreover, we identified the same peptide when the labeling was performed in HEPES buffer, even though the buffer led to inactivation of CYP2E1 (data not shown). The observation demonstrated the reproducibility and specificity of the labeling reaction. We were able to identify heme by MALDI-MS, although the signal to noise ratio was quite low, likely due to inefficient ionization of the molecule (data not shown). Not surprisingly, despite attempts, we were not able to identify any modified heme products, which could also be due to inefficient ionization of the labeled products.
Fig. 5.
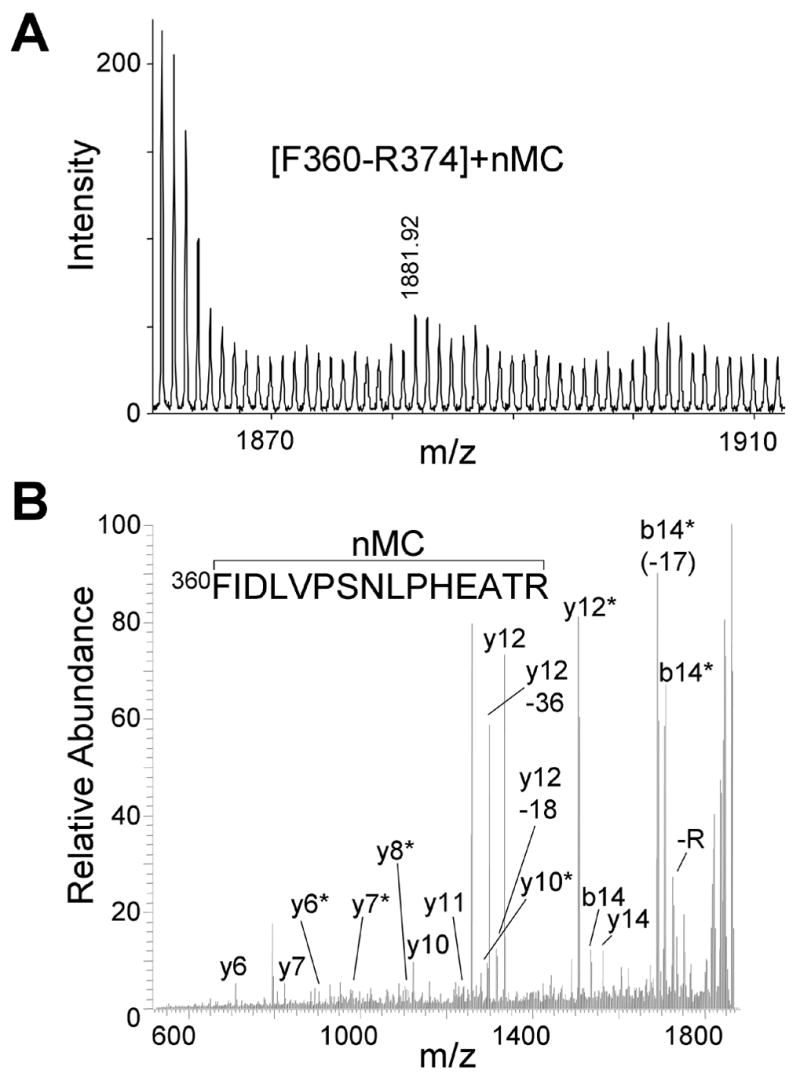
CYP2E1 is nMC-modified on peptide F360-R374. (A) Mass spectrum showing the only nMC-modified peptide from a tryptic digest of nMC-modified CYP2E1. (B) Tandem mass spectrum of the 1881.92 Da peptide from Panel A. Fragments retaining the nMC are indicated with asterisks.
Homology model of CYP2E1
Due to the absence of a three-dimensional structure for CYP2E1, we created a molecular model to visualize the sites of labeling by AzMC. The X-ray crystallographic structures of several of the members of the CYP2 family have been reported, and thus serve as suitable templates to build a homology structure for rabbit CYP2E1. Of these, rabbit CYP2C5 displayed the highest identity (57 %) to CYP2E1 based on a sequence alignment using the SIM program (31). The CYP2E1 sequence used for modeling was truncated prior to Pro33 due to the lack of any structural information for the membrane-binding N-terminus. The construction of the CYP2E1 model was made using the CYP2C5 crystal structure (PDB entry 1dt6) (7) as a template. The ProModII software from the Swiss Institute of Bioinformatics provided the coordinates for the CYP2E1 homology model. Energy minimization was performed using the GROMOS96 program (BIOMOS) resulting in the final structure shown in Figure 6, which includes an enhanced view of the predicted active site. Molecular graphics were generated by PYMOL (http://pymol.sourceforge.net).
Fig. 6.
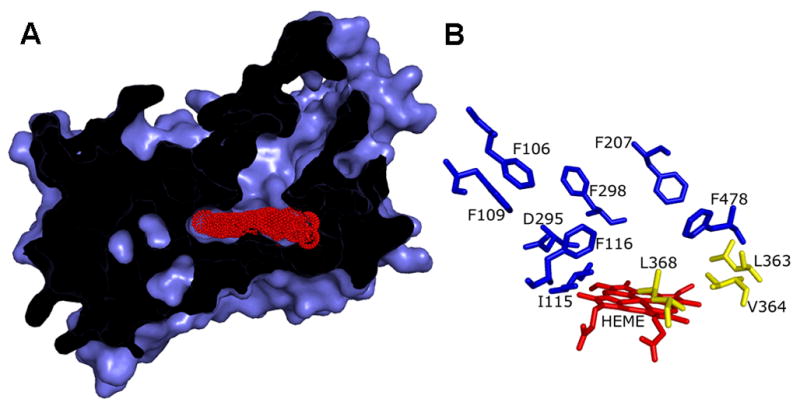
CYP2E1 homology model. (A) View shows the narrow channel leading from the solvent to the small active site. Access to the heme (red) by the substrate is partially occluded by the structure of the protein. (B) Diagram indicates CYP2E1 residues, which may interact with AzMC based on the alignment with CYP2A6 amino acids binding coumarin (Table 3). Residues lining the active site proximal to the heme and were potential targets for nMC incorporation are colored yellow. Molecular graphics were generated by PYMOL (http://pymol.sourceforge.net).
Discussion
The evolutionary pressure to accommodate broad substrate specificity for cytochromes P450 (CYP) creates a significant challenge for interpreting and predicting the metabolism of many endogenous and xenobiotic compounds by CYPs. CYP2E1 metabolizes more than 70 different chemicals (2, 3); nevertheless, these molecules are typically small (molecular weight <100) and hydrophobic in character, e.g. ethanol, nitrosamines, benzene, acetaminophen, isoniazid, and chlorzoxazone (5). To further our understanding of the role of CYP2E1 structure in xenobiotic metabolism, we combined the biophysical approach of photoaffinity labeling with an active site probe, AzMC, and the computational approach of homology modeling. The success of this strategy was made possible by demonstrating the specificity of AzMC for the CYP2E1 active site (see Results).
Although photoactivation of AzMC can lead to simple degradation of the reagent, we observed evidence consistent with nMC reacting with both the active site heme and protein scaffold of CYP2E1. These types of modifications provide possible explanations for the loss in residual activity (Figure 2) and native conformation for CYP2E1 (Table 2). The heme moiety for CYP2E1 generates the oxidant in the CYP2E1–catalyzed reaction, and thus lies in the active site as a suitable target for the reactive nitrene. The exposure of the active site heme to AzMC is consistent with the observed loss in heme content and formation of a possible heme adduct as a function of AzMC concentration (Figure 4). Heme loss could explain the decrease in the presence of native CYP2E1 as determined by the reduced CO spectrum for this enzyme (Table 2) and in the residual activity for CYP2E1 toward pNP oxidation (Figure 2). The reaction of the nitrene with heme could lead to fragmentation of the heme or incorporation of the nMC group. We were able to identify heme by MALDI-MS, although the sensitivity was very poor likely due to inefficient ionization of the molecule (data not shown). Not surprisingly, despite attempts, we were not able to identify any modified heme products, which could also be due to the possible small size of the labeled products.
Despite 85 % sequence coverage, only one peptide was identified that had a mass addition (173 Da) consistent with insertion of nMC on tryptic peptide F360-R374 (Figure 5, Panel A). The remaining unobserved sequence corresponded to the hydrophobic stretch of amino acids believed to comprise a transmembrane anchor for CYP2E1. We confirmed the modification of the peptide by tandem mass analysis (Figure 5, Panel B). Numerous b- and y-ions were observed to be both modified as well as unmodified. A reason for this observation could be modification was labile in MS2 analysis and therefore prevented site-specific localization. However, the likelihood for a labile adduct is remote, because the nitrene would incorporate into neighboring amino acid side chains to produce a stable nitrogen-carbon bond. Alternatively, the 7-nitrene-4-methylcoumarin modification was contained within the F360-R374 peptide, but there were a heterogeneous population of this peptide containing the modification on numerous amino acids. In other words, alternate binding modes for AzMC led to the incorporation of nMC into more than one residue lining the active site. Moreover, the modified F360-R374 peptide was the only modified protein fragment identified in two independent analyses. We identified the same peptide when the labeling was performed in HEPES buffer, even though the buffer led to inactivation of CYP2E1 (see Results). This observation demonstrated the reproducibility and specificity of the labeling reaction.
From a basic sequence analysis, we can infer the role of the labeled region in substrate binding. Table 3 shows an alignment of the peptide identified by MALDI-MS as the site of modification against other rabbit enzymes, CYPs 2B4, 2C5, and 2G1, as well as human CYP2A6. All of these enzymes display very different substrate specificities; however, the region identified in our study is highly conserved among them. This observation suggests the region may serve a common role in forming the active site for these enzymes, but not in substrate discrimination. An earlier pioneering study of the sequences of CYP2 members by Gotoh (10) provides support for the role of this peptide in mediating substrate contacts. Prior to any reported structures for microsomal CYPs, Gotoh (10) employed group-to-group alignments to propose the existence of six substrate recognition sequences (SRSs) within the CYP2 family. The labeled peptide from our study includes SRS-5 (underlined in Table 3), which comprises the C-terminal end of α helix K and β sheet 3. Indicative the importance of this region in substrate recognition, substitutions of residues in SRS-5 have altered substrate specificities for CYP2B6 (35), CYP2C8 (36), and CYP3A9 (37).
Table 3.
| Protein | Residues of interest | |||||||
|---|---|---|---|---|---|---|---|---|
| CYP2A6 | 107F | 111F | 117VF | 209F | 297N | 300I | 362FGDVIPMSLARRVKK376 | 480F |
| CYP2B4 | 104V | 108F | 114IF | 206F | 294S | 297F | 358LGDLIPFGVPHTVTK372 | 477V |
| CYP2C5 | 103L | 106V | 113AF | 205V | 290D | 292F | 355FIDLLPTNLPHAVTR369 | 473F |
| CYP2E1 | 106F | 109F | 115IF | 207F | 295D | 298F | 360FIDLVPSNLPHEATR374c | 478F |
| CYP2G1 | 107V | 111F | 117AL | 209F | 297N | 300F | 362LTDIVPMGVPHNVIR376 | 480F |
References for genes include human CYP2A6 (45), rabbit CYP2B4 (46), rabbit CYP2C5 (47), rabbit CYP2E1 (48), and CYP2G1 (49).
Sequence alignment generated using LALIGN (30).
Underline denotes SRS-5 (10).
Bold denotes residues implicated in recognizing bound coumarin based on X-ray crystallographic structure for CYP2A6
Peptide identified by MALDI-MS in this study
Because the structure of CYP2E1 is unknown, a useful strategy to analyze the structure-function issues for this enzyme is to generate a homology model based on the known structure of other CYPs. Earlier homology models for CYP2E1 were based on the X-ray crystal structure of the P450 domain of the prokaryotic P450 BM-3 (38, 39). These models provided insight into possible residues defining the active site, as well as the residues lining the access channel between the active site and the aqueous environment. The report of the X-ray crystal structure for CYP2C5 was a significant advance in the field by providing the first reported structure for a microsomal CYP enzyme (40). Although few details were reported, the coordinates for the CYP2C5 structure provided the basis for a second homology model of CYP2E1 (41). Similarly, we generated a homology model for CYP2E1 based on the structure of CYP2C5 to provide a context for analyzing the effects of our modifications on CYP2E1 structure and function. Although more microsomal structures are available today, we chose CYP2C5 as the template for our efforts due to the high sequence identity (57 %) between the enzymes. Our homology model revealed several similarities and differences between the respective models for CYP2E1.
Similar to reported structures for CYPs, our model predicts CYP2E1 possesses a hydrophobic channel from the solvent leading to small binding pocket bordered by three structural elements (Figure 6, Panel A). The path from the surface of CYP2E1 leads through an opening ringed by the C-terminus of Helix F (SRS-2, residues N204-S211) and the middle of Sheet 5 (SRS-6, residues V476-G479). This region of Helix F was predicted by an earlier CYP2E1 homology model to play a role in the substrate access channel (38), but the significance of SRS-6 was not. This channel leads ultimately to a small substrate-binding pocket on the distal side of the heme. One wall of this internal cavity is created by Helix B’ containing SRS-1 (residues G113-F116). The middle of the Helix I (residues F298-T306) overlaps SRS-4 and forms a second wall. The lack of complete agreement with the predicted SRS-4 may reflect a more accurate prediction of the substrate recognition sequence by our homology model over that predicted on sequence alone. Further studies would have to confirm this possibility. The third wall of the active site is formed by Sheet 3 (residues L363-L368), which includes SRS-5. These same structural elements occlude access to the heme, such that only pyrrole rings A and D are accessible to the substrate (Figure 6, Panel A). The same exposed area of the heme was indicated by the analysis of phenyl hydrazine suicide substrates (42). The reaction between CYP2E1 and these compounds led to modifications of only pyrrole rings A and D indicating the reactive intermediate could not access pyrrole rings B and C. In our study, we observed heme loss and likely adduct formation, which would require similar accessibility of the photoactivated AzMC to the heme.
Despite the rigidity of the enzymatic active site in models, the ability to dock molecules into structures has the potential to yield insights toward the role of specific residues in recognizing substrates and inhibitor. Based on an early CYP2E1 model, the docking of nitroso-dimethylamine indicated residues Ile115, Ala299, Thr303, Val364, and possibly Ile469 likely mediate contacts with the CYP2E1 substrate (38). Likewise, our homology model predicts the presence of these residues in the CYP2E1 active site. Another group used their own CYP2E1 homology model based on the P450 domain of P450 BM-3 to dock pNP and chlorzoxazone (CHZ) into the active site (39). For pNP-bound complex, the nitro group interacted with Arg76, the hydroxyl group hydrogen bonded to Thr303, and the aromatic ring π-stacked with Phe181. Although no details were provided, the authors speculated the same residues participated in contacts with the larger CHZ substrate. In our homology model, Arg75 and Arg76 are both solvent-exposed on the exterior of the enzyme, while Phe181 is distal from the active site. In effect, none of these residues are predicted to mediate substrate contacts in our model. Following the report of the CYP2C5 structure (40), Lewis, DF et al (41) generated a CYP2E1 homology model based on this enzyme and discovered changes in amino acids predicted to play a role in substrate recognition based on docking studies. In the pNP-bound complex, Asn204 interacts with the nitro group rather than Arg75 or Arg76, and Phe207 and Phe298 form a pi stacking complex with pNP not Phe181 as predicted previously (39). These amino acids were also speculated to play a role in binding other substrates, e.g. CHZ. In our homology model, Asn204 and Phe207 reside at the entrance to the active site and could conceivably contribute to substrate interactions. Phe298 and Thr303 are observed within the active site itself and thus likely to interact with substrates. Although none of the docking studies with aromatic compounds binding CYP2E1 implicated SRS-5, the analysis of a homology model for CYP6B1 did suggest SRS-5 was critical in the recognition of furanocoumarins (43). Taken together, these different docking solutions for CYP2E1 reflect the uncertainty inherent with homology models and therefore justify other techniques, such as our labeling efforts, to complement and further refine the modeling of interactions between molecules and proteins.
The recently reported coumarin-bound structure for CYP2A6 (9) may provide a more valid assessment of which residues play a role in binding large, ringed molecules, e.g. coumarin, by CYP2E1. CYP2A6 and CYP2E1 share 49 % identity including most of the residues critical in coumarin binding, as shown in Table 3. All of these CYP2E1 residues reside in SRS regions: Phe106, Phe109, Ile115, and Phe116 in SRS-1; Phe207 in SRS-2; Asp295 and Phe298 in SRS-3; Val364 and Leu368 in SRS-5; and Phe478 in SRS-6 and are shown in Figure 6, Panel B. Most of these residues are predicted by our CYP2E1 homology model to form the substrate channel and active site. The hydrophobic amino acids forming the coumarin binding site for CYP2A6 are either identical or similar between the two enzymes suggesting an analogous functional role for CYP2E1 residues. For example, the π electron system of the CYP2A6 residue Phe107 makes favorable contacts with the aromatic hydrogens of coumarin. The corresponding Phe106 residue of CYP2E1 may perform a similar role in binding coumarin derivatives as well as interactions with substrates such as CHZ. The absence of this residue in the active site may reflect an induced fit mechanism of triggered upon substrate binding. In addition, the CYP2A6 residues, Ile366 and Leu370, contribute to the base of the hydrophobic coumarin-binding pocket near the heme moiety. For CYP2E1, the corresponding residues are Val364 and Leu368, which are present in the photoaffinity-labeled peptide. Whether the CYP2E1 residues implicated in this analysis play an analogous role in binding substrates as CYP2A6 residues remains to be resolved.
The alignment of the sequences also highlights a key difference between these enzymes in regards to binding coumarin. Asn297 forms a critical hydrogen bond with the carbonyl of coumarin to orientate the molecule for hydroxylation at the 7-position. The existence of this bond is believed to explain the high efficiency of CYP2A6 7-hydroxylation of coumarin relative to other CYP2 members (44). For CYP2E1, Asp295 occupies this position and cannot form this bond unless through an intervening water molecule. Otherwise, the electronegative oxygen of the carbonyl would be repelled by the carboxylate of the aspartic acid leading to weaker binding or different binding orientation for coumarin derivatives for CYP2E1 when compared to CYP2A6. In support of this latter possibility, CYP2E1 does not oxidize coumarin to the 7-hydroxy-coumarin like CYP2A6 (45) and in fact, oxidizes the coumarin ring in the opposite orientation to yield the 3,4-epoxide product, albeit inefficiently (19). Whether AzMC is capable of binding in either orientation is unknown. The presence of the azido group at the 7 position and methyl group at the 4 position could limit the possible binding modes relative to coumarin. Because nMC is incorporated into SRS-5, AzMC binds at a minimum in an orientation similar to coumarin in the CYP2A6 active site. In following, the absence of the asparagine to anchor AzMC could explain the observation of multiple sites of incorporation in the peptide isolated in this study.
Concluding remarks
Our combined approaches of biophysical studies with the photoaffinity label AzMC and computational generation of a CYP2E1 homology model enabled the identification of critical active site residues for CYP2E1. Based on the MALDI-MS analysis and CYP2E1 homology model, we hypothesize Leu363, Val364 and Leu368 of SRS5 were labeled by AzMC and propose a series of phenylalanines, especially Phe106, mediate contacts with the coumarin. Most of these residues, though not all, were localized to SRS regions, thereby revealing the utility and limitation of the designation of the SRS sites. Collectively, this work provides the foundation for future studies seeking to confirm the postulated functional roles for these residues.
Acknowledgments
We thank Kelath Murali Manoj (Univ. of Ark for Med. Sci., Little Rock, AR) for generation of the rabbit CPR-K56Q expression plasmid. We acknowledge also Chris Warthen for mass spectrometric support from Arkansas INBRE (P20RR016460).
The abbreviations used are
- CYP2E1
cytochrome P450 2E1
- CPR
cytochrome P450 reductase
- 4-(2-hydroxyethyl)-1-piperazineethanesulfonic acid
HEPES
- pNP
p-nitrophenol
- pNC
p-nitrocatechol
- 7-hydroxy-4-methylcoumarin
7HC
- 7-azido-4-methylcoumarin
AzMC
- 7-nitrene-4-methylcoumarin
nMC
- 7-ethoxy-4-trifluoromethylcoumarin
7EFC
- chlorzoxazone
CHZ
- NADP+
nicotinamide adenosine dinucleotide phosphate (oxidized)
- substrate recognition sequence
SRS
Footnotes
This work was supported by National Institutes of Health NCRR COBRE Grant 1 P20 RR015569-06.
Publisher's Disclaimer: This is a PDF file of an unedited manuscript that has been accepted for publication. As a service to our customers we are providing this early version of the manuscript. The manuscript will undergo copyediting, typesetting, and review of the resulting proof before it is published in its final citable form. Please note that during the production process errors may be discovered which could affect the content, and all legal disclaimers that apply to the journal pertain.
References
- 1.Guengerich FP. Toxicology Letters. 1994;70:133–138. doi: 10.1016/0378-4274(94)90156-2. [DOI] [PubMed] [Google Scholar]
- 2.Guengerich FP, Kim DH, Iwasaki M. Chem Res Toxicol. 1991;4:168–179. doi: 10.1021/tx00020a008. [DOI] [PubMed] [Google Scholar]
- 3.Ronis M, Lindros KO, Ingelman-Sundberg M. In: Cytochromes P450 - metabolic and toxicological aspects. Ioannides C, editor. CRC Press: Boca Raton, FL; 1996. pp. 211–239. [Google Scholar]
- 4.Koop DR. Molecular Pharmacology. 1986;29:399–404. [PubMed] [Google Scholar]
- 5.Yamazaki H, Guo Z, Guengerich FP. Drug Metabolism and Disposition. 1995;23:438–440. [PubMed] [Google Scholar]
- 6.Robertson G, Leclercq I, Farrell GC. Am J Physiol Gastrointest Liver Physiol. 2001;281:G1135–G1139. doi: 10.1152/ajpgi.2001.281.5.G1135. [DOI] [PubMed] [Google Scholar]
- 7.Williams PA, Cosme J, Sridhar V, Johnson EF, McRee DE. J Inorg Biochem. 2000;81:183–190. doi: 10.1016/s0162-0134(00)00102-1. [DOI] [PubMed] [Google Scholar]
- 8.Scott EE, He YA, Wester MR, White MA, Chin CC, Halpert JR, Johnson EF, Stout CD. PNAS. 2003;100:13196–13201. doi: 10.1073/pnas.2133986100. [DOI] [PMC free article] [PubMed] [Google Scholar]
- 9.Yano JK, Hsu M-H, Griffin KJ, Stout CD, Johnson EF. 2005;12:822–823. doi: 10.1038/nsmb971. [DOI] [PubMed] [Google Scholar]
- 10.Gotoh O. Journal of Biological Chemistry. 1992;267:83–90. [PubMed] [Google Scholar]
- 11.Szklarz GD, He YQ, Kedzie KM, Halpert JR, Burnett VL. Archives of Biochemistry and Biophysics. 1996;327:308–318. doi: 10.1006/abbi.1996.0127. [DOI] [PubMed] [Google Scholar]
- 12.Yun CH, Miller GP, Guengerich FP. Biochemistry. 2000;39:11319–11329. doi: 10.1021/bi000869u. [DOI] [PubMed] [Google Scholar]
- 13.Moreno RL, Goosen T, Kent UM, Chung FL, Hollenberg PF. Archives of Biochemistry and Biophysics. 2001;391:99–110. doi: 10.1006/abbi.2001.2390. [DOI] [PubMed] [Google Scholar]
- 14.Yun CH, Hammons GJ, Jones G, Martin MV, Hopkins NE, Alworth WL, Guengerich FP. Biochemistry. 1992;31:10556–10563. doi: 10.1021/bi00158a019. [DOI] [PubMed] [Google Scholar]
- 15.Roberts ES, Alworth WL, Hollenberg PF. Archives of Biochemistry and Biophysics. 1998;354:295–302. doi: 10.1006/abbi.1998.0679. [DOI] [PubMed] [Google Scholar]
- 16.Cvrk T, Strobel HW. Archives of Biochemistry and Biophysics. 1998;349:95–104. doi: 10.1006/abbi.1997.0464. [DOI] [PubMed] [Google Scholar]
- 17.Miller JP WR. Biochemistry. 1994;33:807–817. doi: 10.1021/bi00169a023. [DOI] [PubMed] [Google Scholar]
- 18.Reigh G, McMahon H, Ishizaki M, Ohara T, Shimane K, Esumi Y, Green C, Tyson C, Ninomiya S. Carcinogenesis. 1996;17:1989–1996. doi: 10.1093/carcin/17.9.1989. [DOI] [PubMed] [Google Scholar]
- 19.Born SL, Caudill D, Fliter KL, Purdon MP. Drug Metab Dispos. 2002;30:483–487. doi: 10.1124/dmd.30.5.483. [DOI] [PubMed] [Google Scholar]
- 20.Chen G, Battaglia E, Senay C, Falany C, Radominska-Pandya A. Protein Sci. 1999;8:2151–2157. doi: 10.1110/ps.8.10.2151. [DOI] [PMC free article] [PubMed] [Google Scholar]
- 21.Senay C, Battaglia E, Chen G, Breton R, Fournel-Gigleux S, Magdalou J, Radominska-Pandya A. Archives of Biochemistry and Biophysics. 1999;368:75–84. doi: 10.1006/abbi.1999.1300. [DOI] [PubMed] [Google Scholar]
- 22.Hanna IH, Teiber JF, Kokones KL, Hollenberg PF. Archives of Biochemistry and Biophysics. 1998;350:324–332. doi: 10.1006/abbi.1997.0534. [DOI] [PubMed] [Google Scholar]
- 23.Jamakhandi A, Jeffus BC, Dass VR, Miller GP. Archives Biochem Biophys. 2005;439:165–174. doi: 10.1016/j.abb.2005.04.022. [DOI] [PMC free article] [PubMed] [Google Scholar]
- 24.French JS, Coon MJ. Archives of Biochemistry and Biophysics. 1979;195:565–577. doi: 10.1016/0003-9861(79)90383-7. [DOI] [PubMed] [Google Scholar]
- 25.Cheng D, Kelley RW, Cawley GF, Backes WL. Protein Expression and Purification. 2004;33:66–71. doi: 10.1016/j.pep.2003.08.009. [DOI] [PubMed] [Google Scholar]
- 26.Omura T, Sato R. Journal of Biological Chemistry. 1964;239:2370–2378. [PubMed] [Google Scholar]
- 27.Battaglia E, Nowell S, Drake RR, Magdalou J, Fournel-Gigleux S, Senay C, Radominska A. Drug Metab Dispos. 1997;25:406–411. [PubMed] [Google Scholar]
- 28.Omura T, Sato R. Methods in Enzymology. 1967;10:556–561. [Google Scholar]
- 29.Shaklai N, Shviro Y, Rabizadeh E, Kirschner-Zilber I. Biochimica et Biophysica Acta (BBA) - Biomembranes. 1985;821:355–366. doi: 10.1016/0005-2736(85)90106-3. [DOI] [PubMed] [Google Scholar]
- 30.Tackett AJ, Dilworth DJ, Davey MJ, O'Donnell M, Aitchison JD, Rout MP, Chait BT. J Cell Biol. 2005;169:35–47. doi: 10.1083/jcb.200502104. [DOI] [PMC free article] [PubMed] [Google Scholar]
- 31.Huang X, Miller W, Schwartz S, Hardison RC. Comput Appl Biosci. 1992;8:155–165. doi: 10.1093/bioinformatics/8.2.155. [DOI] [PubMed] [Google Scholar]
- 32.Code EL, Crespi CL, Penman BW, Gonzalez FJ, Chang TKH, Waxman DJ. Drug Metabolism and Disposition. 1997;25:985–993. [PubMed] [Google Scholar]
- 33.Spatzenegger M, Liu H, Wang Q, Debarber A, Koop DR, Halpert JR. J Pharmacol Exp Ther. 2003;304:477–487. doi: 10.1124/jpet.102.043323. [DOI] [PubMed] [Google Scholar]
- 34.Eagling VA, Howe JL, Barry MJ, Back DJ. Biochemical Pharmacology. 1994;48:267–276. doi: 10.1016/0006-2952(94)90097-3. [DOI] [PubMed] [Google Scholar]
- 35.Domanski TL, Schultz KM, Roussel F, Stevens JC, Halpert JR. Journal of Pharmacology and Experimental Therapeutics. 1999;290:1141–1147. [PubMed] [Google Scholar]
- 36.Kerdpin O, Elliot DJ, Boye SL, Birkett DJ, Yoovathaworn K, Miners JO. Biochemistry. 2004;43:7834–7842. doi: 10.1021/bi0496844. [DOI] [PubMed] [Google Scholar]
- 37.Xue L, Zgoda VG, Arison B, Almira Correia M. Archives of Biochemistry and Biophysics - Special Issue dedicated to RW Estabrook. 2003;409:113–126. doi: 10.1016/s0003-9861(02)00582-9. [DOI] [PubMed] [Google Scholar]
- 38.Tan Y, White SP, Paranawithana SR, Yang CS. Xenobiotica. 1997;27:287–299. doi: 10.1080/004982597240613. [DOI] [PubMed] [Google Scholar]
- 39.Lewis DFV, Bird MG, Dickins M, Lake BG, Eddershaw PJ, Tarbit MH, Goldfarb PS. Xenobiotica. 2000;30:1–25. doi: 10.1080/004982500237794. [DOI] [PubMed] [Google Scholar]
- 40.Williams PA, Cosme J, Sridhar V, Johnson EF, McRee DE. Molecular Cell. 2000;5:121–131. doi: 10.1016/s1097-2765(00)80408-6. [DOI] [PubMed] [Google Scholar]
- 41.Lewis DFV. Xenobiotica. 2002;32:305–323. doi: 10.1080/00498250110112015. [DOI] [PubMed] [Google Scholar]
- 42.Mackman R, Guo Z, Guengerich FP, Ortiz de Montellano PR. Chemical Research in Toxicology. 1995;9:223–226. doi: 10.1021/tx950130z. [DOI] [PubMed] [Google Scholar]
- 43.Baudry J, Li W, Pan L, Berenbaum MR, Schuler MA. Protein Eng. 2003;16:577–587. doi: 10.1093/protein/gzg075. [DOI] [PubMed] [Google Scholar]
- 44.Yamano S, Nagata K, Yamazoe Y, Kato R, Gelboin HV, Gonzalez FJ. Nucleic Acids Research. 1989;17:4888. doi: 10.1093/nar/17.12.4888. [DOI] [PMC free article] [PubMed] [Google Scholar]
- 45.Yamano S, Tatsuno J, Gonzalez FJ. Biochemistry. 1990;29:1322–1329. doi: 10.1021/bi00457a031. [DOI] [PubMed] [Google Scholar]