Abstract
Multiple sclerosis (MS) is an autoimmune disease characterized by clinical relapse and remission. Because of the potential role of natural killer (NK) cells in the regulation of autoimmunity, we have examined cytokine profile and surface phenotype of NK cells in the peripheral blood of MS. Here we demonstrate that NK cells in the remission of MS are characterized by a remarkable elevation of IL-5 mRNA and a decreased expression of IL-12Rβ2 mRNA, as well as a higher expression of CD95. Moreover, the NK cells from MS in remission produced much larger amounts of IL-5 than did those from controls after stimulation with phorbol myristate acetate (PMA) and ionomycin. These features are reminiscent of those of NK type 2 (NK2) cells that can be induced in a condition favoring functional deviation of T cells toward Th2. Remarkably, the NK cells lose the NK2-like property when relapse of MS occurs, but regain it after recovery. We also found that NK2 cells induced in vitro inhibit induction of Th1 cells, suggesting that the NK2-like cells in vivo may also prohibit autoimmune effector T cells. Taken together, it is possible that NK cells play an active role in maintaining the remission of MS.
Introduction
Currently it is recognized that various types of regulatory cells can actively suppress autoimmune diseases. In experimental autoimmune encephalomyelitis (EAE) (1–4), the prototype autoimmune disease mediated by Th1 cells, cell depletion or adoptive transfer studies have established the role of regulatory αβT cells (1, 2), B cells (3), and NK cells (4) in the regulation of the disease. However, it remains obscure how deeply involved are such regulatory cells in human Th1–mediated autoimmune diseases like multiple sclerosis (MS). Most patients with MS enjoy clinically stable periods of variable duration (remission), although interrupted unpredictably by occurrence of relapse. It is interesting to consider whether regulatory cells may play an active role in maintaining the remission of MS. However, to our knowledge, no substantial studies exist that could provide insights into this intriguing question regarding regulatory cells. In this study, we attempted to characterize the functional phenotype of NK cells in the remission and relapse of MS because of the downregulatory role of NK cells demonstrated in EAE (4).
A recent study has shown that human NK cells are able to polarize in vitro into two functionally distinct subsets NK type1 (NK1) or NK2 (5), analogous to T-cell subsets Th1 or Th2 (6, 7). Namely, NK cells grown in a culture condition favoring Th1 deviation (culture with IL-12 and anti–IL-4 mAb) would differentiate into NK1 cells producing IFN-γ and IL-10, whereas NK cells grown in a Th2 condition (with IL-4 and anti–IL-12 mAb) differentiate into NK2 cells predominantly producing IL-5 and IL-13 (5). Expansion of NK2-like cells producing IL-5 and IL-13 have recently been observed in IFN-γ–knockout mice (8), indicating that NK cells could functionally polarize in vivo in rodent. However, it remains unknown whether the NK1/NK2 concept could be relevant in vivo in human and, if so, what roles NK1 or NK2 cells would play in the adaptive immune responses in health or disease. On the basis of these backgrounds, we have focused our efforts on characterizing the cytokine profile of NK cells ex vivo.
Here we demonstrate, for the first time to our knowledge, that remission (but not of relapse) of MS is associated with a strong bias of NK cells toward producing IL-5. Together with the lower expression of IL-12Rβ2 chain and a higher surface expression of CD95 (Fas) by NK cells, we interpret the overall profile of the NK cells in remission as highly consistent with that of NK2 cells (5). With additional data from in vitro experiments, we propose that the NK2-like cells play an active role in the maintenance of clinical remission of MS by inhibiting autoimmune Th1 cells.
Methods
Subjects.
All the MS patients (six men and 16 women, ages 39 ± 12.4 years) were diagnosed on the clinical criteria (9) and by MRI. Here we defined “MS in remission (MS-rem)” as those who have been clinically stable without any immunosuppressive medications for more than 3 months and “MS in relapse (MS-rel)” as those who have developed an apparent exacerbation within an interval of 1 week. The presence of active lesions in MS-rel was confirmed with gadolinium-enhanced MRI in all cases. To monitor MS-rem, MRI scans were repeated every 3–6 months. Gadolinium enhancement was not routine for MS-rem, but it was performed when the occurrence of relapse was suspected. As a control for MS-rem, we examined sex- and age-matched controls, including healthy subjects (HS) (five men and 11 women, ages 41.8 ± 10.2 years), other neurological diseases (OND) (two men and five women, ages 46.4 ± 7.7 years) and other autoimmune diseases (OAI) (two men and five women, ages 45.3 ± 16.1 years). OND include Parkinson disease (n = 4), spinocerebellar degeneration (n = 2) and amyotrophic lateral sclerosis (n = 1), whereas OAI are composed of thyroiditis (n = 5), myasthenia gravis (n = 1) and inflammatory demyelinating polyneuropathy (n = 1). None of the subjects were given corticosteroid or immunosuppressive agents when the study was conducted.
Antibodies.
For immunofluorescence analysis, the following fluorescence or biotin-labeled mAb’s were used: anti-human CD3-FITC, CD3-PerCP, CD56-FITC, CD56-PE, IFN-γ-PE, IL-4-PE (Becton Dickinson Immunocytometry Systems, San Jose, California, USA), and anti-human CD95-biotin (PharMingen, San Diego, California, USA). mAb’s to IL-4 (4F2/5A4), IL-12 (C8.6) (DIACLONE Research, Besancon, France), and IL-5 (R&D Systems Inc., Minneapolis, Minnesota, USA) were used for neutralizing respective cytokines in vitro. Streptavidin-Cychrome (PharMingen) was used as the second-step reagent for flow fluorocytometry.
Purification of NK cells and generation of NK subset.
NK cells and T cells were negatively selected from PBMCs using the NK Isolation Kit and Pan T Cell Isolation Kit (both from Miltenyi Biotech, Gladbach, Germany), respectively. The isolated cell populations were found to yield greater than 98% purity when assessed by flow fluorocytometry. NK1 and NK2 cell populations were induced in vitro as described previously (5). In brief, PBMCs (2 × 10⁷/ml) were seeded onto 24-well plates together with X-irradiated RPMI8866 cells (4 × 10⁶ /ml) (a kind gift from G. Trinchieri). The cells were cultured in the presence of either IL-12 (10 ng/ml) plus anti–IL-4 mAb (10 μg/ml) or IL-4 (50 ng/ml) plus anti–IL-12 mAb (10 μg/ml). On day 8, NK cells were purified from the culture with the NK Isolation Kit and adjusted to 2 × 10⁵/ml in RPMI1640 medium supplemented with 10% FCS. They were mixed with purified T cells (8 × 10⁵/ml) from PBMCs from the same donor in a 5-ml polystyrene round-bottom tube and then stimulated with PMA (25 ng/ml) and ionomycin (1 μg/ml) for 6 hours at 37°C. Anti–IL-5 mAb (5 μg/ml) or IL-5 (100 pg/ml) was added to a relevant test tube to examine the role of IL-5.
Flow fluorocytometry.
To evaluate the surface expression of CD3, CD56, and CD95, PBMCs were stained with fluorescence- or biotin-labeled antibodies reactive to each molecule. To detect intracellular cytokines, brefeldin A (10 μg/ml) was added to the culture medium 3 hours after the initiation of PMA/ionomycin stimulation. The cells stimulated for 6 hours were stained with anti-CD3 and anti-CD56, then fixed and permeabilized with FACS Lysing Solution and FACS Permeabilizing Solution. The permeabilized cells were stained with relevant anti-cytokine antibodies. Samples were analyzed using FACSort with CellQuest software (Becton Dickinson). Appropriate control antibodies were used to define the background immunofluorescence of the cells.
Cytokine ELISA.
NK cells (2 × 10⁵) purified from PBMCs were either left untouched or were stimulated with PMA/ionomycin in 96-well U-bottomed plates. IFN-γ and IL-5 in the culture supernatants were measured by commercial kits (Endogen Inc., Woburn, Massachusetts, USA) 24 hours after initiation of the culture. The detection limit for the cytokines in this assay was 7.8 pg/ml.
RT-PCR assay for cytokine measurement.
For RT-PCR analysis, total RNA was extracted with RNAzol B (Biotecx Laboratories, Friendswood, Texas, USA) from purified NK cells, and the oligo (dT)-primed cDNA was prepared with the First-Strand cDNA Synthesis Kit (Amersham Pharmacia Biotech, Buckinghamshire, United Kingdom). To amplify cytokine messages, the samples were incubated for 5 minutes at 95°C and then subjected to 35 cycles of PCR amplification (at 94°C for 30 seconds, at 60°C for 30 seconds, and at 72°C for 60 seconds). For qualitative assessment, the PCR products were analyzed on 5% acrylamide gels stained with ethidium bromide. For quantitative analysis of IL-5, IFN-γ, and IL-12Rβ2, we used the Light Cycler quantitative PCR system (Roche Molecular Biochemicals, Mannheim, Germany) and performed quantitative PCR with a commercial kit (Light Cycler-DNA Master SYBR Green I) (Roche Molecular Biochemicals). The PCR amplification was repeated 40 times (at 95°C for 0 seconds, at 60°C for 5 seconds, and at 72°C for 10 seconds). To control the experiments, dilutions of cDNAs prepared from PMA/ionomycin-stimulated PBMCs were amplified in parallel. Based on the standard values of the control samples, the relative value for each test sample was determined with the Light Cycler software. All PCR reactions were controlled by β-actin expression, and PCR primers used were as follows: IFN-γ–sense, CAGGTCATTCAGATGTAGCG, and –antisense, GCTTTTCGAAGTCATCTCG; IL-12Rβ2–sense, GGCATTTTCTCAACGCATTACTT, and –antisense, TGGATCTGGAATTTCTCTGCTACA; IL-5–sense, GCACACTGGAGAGTCAAACT, and –antisense, CACTCGGTGTTCATTACACC; IL-13–sense, CAACGCTCATTGCTCTCACTTGCC, and –antisense, CCTTGTGCGG-GCAGAATCCGCTCA; IL-10–sense, AGGGCACCCAGTCTGAGAACA, and –antisense, CGGCCTTGCTCTTGTTTTCAC; TGFβ1-sense, TTTCGCCTTAGCGCCCACTG, and –antisense, TCCAGCCGAGGTCCTTGCGG; β-actin-sense, AGAGATGGCCACGGCTGCTT, and –antisense, ATTTGCGGTGGACGATGGAG.
Results
NK cells predominantly produce IL-5 in remission of MS.
Using NK-cell populations freshly isolated from PBMCs, we first screened the expression of cytokine and cytokine receptor genes including IFN-γ, IL-12Rβ2-chain (IL-12Rβ2), IL-5, IL-13, IL-10, and TGF-β1. Previous studies showed that human NK cells express these genes or gene products (5, 10–12). RT-PCR analysis revealed that mRNAs for IFN-γ, IL-12Rβ2, and IL-5 were expressed in the large majority of the NK cells obtained from MS in remission (MS-rem) and from healthy subjects (HS) (Table 1), whereas the other genes were less frequently detected. Overall, this analysis did not reveal any significant difference between MS-rem and HS. Next we performed quantitative RT-PCR measurement of IL-5, IL-12Rβ2, and IFN-γ, as expression of these genes might help us distinguish functional phenotypes of NK cells. Namely, studies have demonstrated that production of IFN-γ and IL-5 would define NK1 and NK2 cells, respectively (5) and that much higher levels of IL-12Rβ2 mRNA are accumulated in NK1 than NK2 (5). The quantitative analysis revealed that the expression of IL-5 mRNA was greatly (∼50-fold) enhanced in NK cells obtained from MS-rem compared with HS (P < 0.01) (Figure 1a). In contrast, there was no difference in the level of IFN-γ mRNA between the two groups. IL-12Rβ2 tended to be lower in MS-rem than HS, although the difference was not significant (P = 0.14). These results raise a possibility that NK cells may acquire an NK2-like phenotype during remission of MS. Next we measured the levels of IFN-γ and IL-5 in the supernatant of NK cells after stimulation with PMA and ionomycin (Figure 1b). Consistent with the data of the quantitative RT-PCR, IL-5 was elevated in the supernatant of NK cells from MS-rem compared with HS (P < 0.05), whereas IFN-γ was equally elevated in both groups.
Table 1.
Detection frequency of cytokine and cytokine receptor messages in NK cells
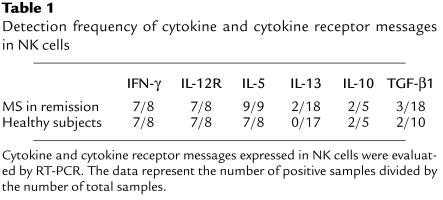
Figure 1.
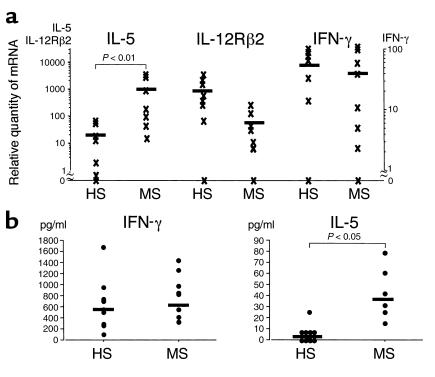
Cytokine production by NK cells in MS and HS. (a) Quantitative RT-PCR for IL-5, IL-12Rβ2, and IFN-γ. Total RNA was isolated from NK cells obtained from patients with MS in remission and healthy subjects (HS). In the Light Cycler quantitative PCR system, the levels of gene expression are expressed by relative values as described in Methods. (b) Quantification of IFN-γ and IL-5 by ELISA. NK cells were isolated from MS in remission or HS and stimulated with PMA/ionomycin in 96-well U-bottom plates (2 × 10⁵/well). The supernatant was collected 24 hours later, and the levels of IFN-γ and IL-5 in the samples were determined by ELISA. Mann-Whitney U test was used for statistical analysis. Horizontal bars indicate the mean values.
NK cells expressing CD95 (Fas) are increased in remission of MS.
The remarkable increase of IL-5 mRNA enabled us to speculate that NK cells might be persistently activated in the remission phase of MS. We therefore examined surface expression of cell activation markers (CD25, CD69, and CD95) on various cell populations in MS-rem and control subjects including HS, OND, and OAI. Flow fluorocytometric analysis of NK cells (CD56+CD3–), CD56+ T cells (CD56+CD3+), and T cells (CD56–CD3+) revealed that proportions of NK cells express CD95 (Fas) with moderate intensity and that the frequency of CD95+ NK cells was significantly elevated in MS-rem compared with controls (P < 0.01) (Figure 2, a and b). In contrast, there was no difference between MS-rem and the controls regarding the frequency of CD95+ cells in CD56+ or CD56– T cells. The surface expression of CD25 or CD69 did not differ between MS-rem and the controls (data not shown). Because an intermediate level of CD95 expression is a character of NK2 cells (5), the results can be regarded as an additional support for occurrence of NK2-like deviation in MS-rem in vivo. In parallel, we examined the cytotoxic activity of NK cells targeting 51Cr-labeled K562 cells, but found no significant difference between MS-rem and HS (data not shown).
Figure 2.
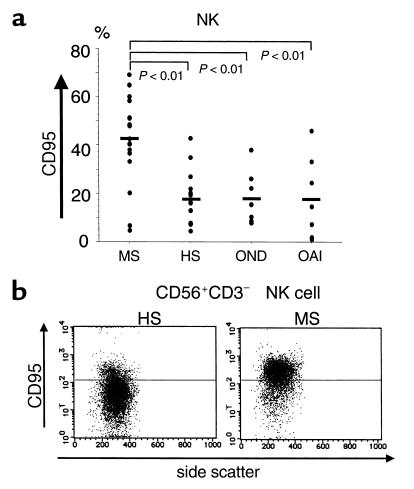
Surface expression of CD95 on NK cells in MS-rem and controls. (a) Frequency of CD95+ NK cells. Freshly isolated PBMCs were stained with anti–CD3-FITC, anti–CD56-PE, and anti–CD95-biotin/Streptavidin-Cychrome and were analyzed by flow fluorocytometry within 2 hours after drawing blood. The data are expressed as percentages of CD95+ cells among CD56+CD3–-gated NK cells. Controls for MS-rem include HS, patients with other neurological diseases (OND) (Parkinson disease [n = 4], spinocerebellar degeneration [n = 2], amyotrophic lateral sclerosis [n = 1]) and those with other autoimmune diseases (OAI) (thyroiditis [n = 5], myasthenia gravis [n = 1], inflammatory demyelinating polyneuropathy [n = 1]). Kruskal-Wallis test with Scheffe’s F test was used for statistical analysis. Horizontal bars indicate mean values. (b) CD95 expression on NK cells from MS-rem versus HS. PBMCs were stained with anti–CD3-FITC, anti–CD56-PE, and anti–CD95-biotin/Streptavidin-Cychrome. CD56+CD3– lymphocytes were gated and analyzed for CD95 expression versus side scatter. The horizontal bars indicate the fluorescence intensity distinguishing CD95+ and CD95– cells. Shown are representative data out of 20 samples (MS [n = 10], HS [n = 10]) with similar results.
Change of NK phenotype in the clinical course of MS.
We next compared MS in relapse (MS-rel) with MS-rem regarding the quantity of IL-5 mRNA and the frequency of CD95+ cells in NK cells. Overall, both of the parameters were significantly depressed in NK cells obtained from MS-rel compared with those from MS-rem (Figure 3, a and b). We had opportunities to examine pairs of remission and relapse samples obtained from same subjects. Decrease of IL-5 mRNA or reduction of CD95+ cell frequencies during relapse was confirmed in all but one pair, further supporting that the NK2-like phenotype is associated with clinical remission. In addition, we performed a cohort study for seven patients with MS, starting on the day of hospitalization due to a recent onset of relapse. As shown in Figure 3c, administration of high-dose methylprednisolone for 3 consecutive days did not cause a rapid change of the CD95 expression. One month later, however, the frequency of CD95+ NK cells had increased up to the level usually seen in MS-rem. Given that most of the patients had clinically recovered until that time, this result convinced us that an increased frequency of CD95+ NK cells is associated with clinical remission of MS.
Figure 3.
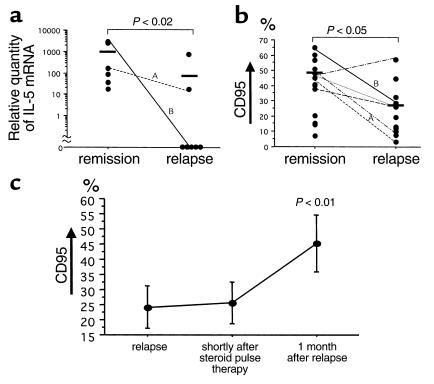
Characterization of NK phenotype in the clinical course of MS. (a) Reduction of IL-5 mRNA during relapse. Total RNA was isolated from NK cells and then subjected to quantitative RT-PCR analysis. The data obtained from the same patients at different stages are connected with lines. (b) Decreased frequency of CD95+ NK cells during relapse. Freshly isolated PBMCs were stained with anti–CD3-FITC, anti–CD56-PE, and anti–CD95-biotin/Streptavidin-Cychrome and analyzed by flow fluorocytometry. The data are expressed as percentages of CD95+ cells among CD56+CD3–-gated NK cells. A,BSample pair from the same patient analyzed for these two parameters. Mann-Whitney U test was used for both a and b. (c) Increase of CD95+ NK cells after clinical recovery. The frequency of CD95+ NK cells was determined as performed in b. The first samples were obtained on the day of hospitalization (relapse) before starting injection of 1,000 mg/d of methylprednisolone (steroid pulse) for 3 consecutive days. The second samples were obtained 5–7 days after the start of the pulse therapy (shortly after steroid pulse therapy). The third samples were collected 1 month after the first sampling (1 month after relapse). Bars = SE. Friedman test was used for statistical analysis.
Regulatory function of NK1 and NK2 cells in vitro.
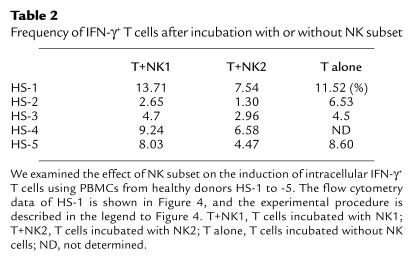
Cytokine profiles distinguishing the NK1/NK2 subsets are similar but not identical to those for the Th1/Th2. For example, NK1 or NK2 cells produce neither IL-2 nor IL-4 (5), and NK1 cells produce IL-10, a Th2 cytokine. At present, the role of NK1 or NK2 cells in the adaptive immunity remains an open question. To address this problem, we generated NK1 or NK2 cells in vitro from PBMCs of HS according to the described method (5). The induced NK1 or NK2 Vcells were mixed with freshly isolated T cells from the same subject and stimulated with PMA/ionomycin. Intracellular expression of IFN-γ and IL-4 was analyzed 6 hours later with flow fluorocytometry. As shown in Figure 4 and Table 2, the frequency of IFN-γ+ T cells was consistently lower in the T cells incubated with NK2 than in those incubated with NK1 or without NK cells. In contrast, the frequency of IL-4+ T cells was highest when incubated with NK2 in two of the five subjects, although this tendency was not clear in the other three (data not shown). These results indicate that NK2 cells would inhibit the induction of Th1 cells but drive Th2 polarization of peripheral T cells. Autoimmune T cells mediating MS are postulated to be Th1 cells producing IFN-γ. The in vitro experiments raised a possibility that the bias of NK cells for IL-5 production seen in MS-rem might be beneficial for maintaining the state of remission.
Figure 4.
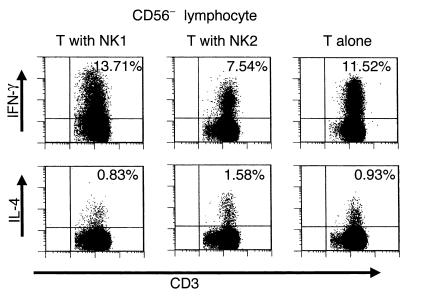
Intracellular staining of IFN-γ and IL-4 in T cells stimulated with PMA/ionomycin. Freshly isolated T cells (8 × 10⁵/ml) were mixed with either NK1 or NK2 cells (2 × 10⁵/ml) that had been generated from the same donor. The T/NK cell mixtures or T cells without NK cells were stimulated with PMA/ionomycin at 37°C for 6 hours, and the stimulated cells were stained with anti–CD3-PerCP and anti–CD56-FITC and then fixed and permeabilized. The cells were stained with either anti–IFN-γ-PE or anti–IL-4-PE, and CD56– lymphocytes were analyzed for expression of IFN-γ or IL-4. The percent values shown in the upper right quadrant denote the percentages of IFN-γ+ or IL-4+ cells among CD56–CD3+ T cells.
Table 2.
Frequency of IFN-γ+ T cells after incubation with or without NK subset
Involvement of IL-5 in the Th1 suppression mediated by NK2 cells.
To shed light on the mechanism by which in vitro induced NK2 cells inhibit Th1 induction, we collected culture supernatant of PMA/ionomycin-stimulated NK2 cells and examined the effect of this supernatant on the T cells stimulated with PMA/ionomycin. We found that the number of IFN-γ+ T cells after stimulation was reduced when incubated in the presence of the supernatant (data not shown), showing that Th1 inhibitory mediator(s) are produced by NK2 cells. Because IL-5 was most prominently expressed in NK2 cells, we next focused on the role of IL-5 in the Th1 inhibition by the NK2 supernatant. As shown in Figure 5, exogenous IL-5 inhibited the induction of IFN-γ+ T cells after stimulation. In contrast, anti–IL-5 mAb partially abrogated the suppressive effect of the supernatant, implying that IL-5 is partly involved in the Th1 inhibition. However, neither anti–TGF-β nor anti–IL-13 mAb abrogated the Th1 inhibitory activity (data not shown).
Figure 5.
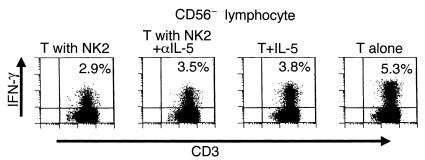
Involvement of IL-5 in the Th1 inhibition by NK2 cells. Freshly isolated T cells were mixed with or without NK2 cells obtained from the same donor and were stimulated with PMA/ionomycin for 6 hours as performed in the experiment in Figure 4. To ascertain the role of IL-5, a neutralizing anti–IL-5 mAb (T with NK2+αIL-5), an isotype-matched control mAb (T with NK2), or recombinant IL-5 (100 pg/ml) was added to the culture. The stimulated cells were permeabilized and stained with anti-human CD3-PerCP, anti–CD56-FITC, and anti–IFNγ-PE. This is a representative of two experiments with similar results. T, T cells.
Discussion
NK cells were originally defined as a population of lymphocytes showing ability to kill certain target cells in a non–MHC-restricted manner (13). Previous studies have correlated a reduction of NK cell cytotoxic activity with an exacerbation of autoimmune disease, although considerable controversy has remained (13). Here we focused on the cytokine profile of NK cells in MS to gain insights into the immunoregulation of MS. We demonstrate first that NK cells in remission predominantly produce IL-5 but express lesser amounts of IL-12Rβ2 than do controls. The result indicates that the NK cells share some properties with Th2 cells (1, 14, 15), in that they are capable of competing with pathogenic autoimmune Th1 cells.
Recent studies have established the ability of NK cells to produce IL-5 (5, 8, 10, 11). The published data indicate that NK cells could functionally polarize into cells predominantly producing IL-5 (5, 8, 10) and that this polarization may be augmented by IL-4 (5, 8, 10) but inhibited by IL-10, IL-12, or IFN-γ (8, 10). However, it remained unclear whether such NK cell bias could occur physiologically in vivo. The present study shows for the first time to our knowledge that the NK cell bias for IL-5 production occurs in the remission of MS, a Th1-mediated autoimmune disease. Because addition of a neutralizing mAb to IL-5 showed a suppressive effect on the NK2-mediated Th2 deviation (Figure 5), we presume that IL-5 produced by NK cells plays a substantial role in the immunoregulation.
Furthermore, we discovered that NK cells in MS-rem express a higher level of CD95 molecule on the cell surface. Regarding the lymphocyte expression of CD95, a previous study by Zipp et al. did not show a significant difference between MS and HS (16). This is simply because they studied T cells or total PBMCs, but did not focus on NK cells. We could not reveal the difference in CD95 expression when we analyzed total PBMCs (data not shown). Interestingly, Zipp et al. reported a significant increase of soluble CD95 in the serum of MS compared with HS (17). They subsequently discussed on the possibility that soluble CD95 may inhibit the CD95-mediated apoptosis of autoimmune T cells. Although it remains speculative, it is possible that soluble CD95 might play some role in protection against the CD95-mediated death of NK cells in MS. It is interesting to investigate on the biologic meaning of CD95 expression by NK cells in the future.
On the basis of the predominant IL-5 production and the higher expression of CD95, we operationally defined the NK phenotype in MS as NK2-like. Of particular note, the NK cell expression of IL-5 mRNA and CD95 was significantly reduced during relapse of MS. It remains to be determined whether the loss of the NK2 markers preceded the onset of relapse. If the change of NK phenotype is followed by clinical relapse, it is tempting to speculate that the functional change of NK cells may play a key role in triggering clinical exacerbation of MS. Given that relapses of MS are not always associated with infectious agents believed to stimulate autoimmune T cells (18), this is an important issue to be further investigated. However, even if the change of NK cells is secondary to clinical exacerbation, the loss of NK2-like phenotype during relapse is likely to be an augmenting mechanism for Th1 cell-induced inflammation. To understand better the change of NK cell phenotype, we need to evaluate more precisely on the signaling cascade leading to IL-5 production (19, 20).
Because NK cells are involved in various cellular interactions, the functional bias of NK cells needs to be understood in the context of the immune network. In addition to the NK2-like bias, the remission of MS is associated with a greatly reduced number of CD1d-restricted NKT cells expressing the Vα24-JαQ invariant TCR α-chain (20). The NKT cells are a unique lymphocyte population that can produce large amounts of Th1 and Th2 cytokines shortly after TCR ligation (21, 22). When stimulated with a glycolipid ligand, they can rapidly interact with NK cells via producing IFN-γ (23, 24). An interesting question for the future study would be whether there is some link between the NK2-like bias and NKT cell reduction seen in the remission of MS.
In additional experiments of this study, we demonstrate that in vitro–induced NK2 cells inhibit the induction of Th1 cells after stimulation with PMA/ionomycin. This result has prompted us to postulate that the NK2-like cells expressing IL-5 and CD95 in vivo might have a potential to regulate Th1 autoimmune pathogenic T cells. If the in vitro setup would faithfully reflect critical aspects of in vivo condition, it is possible that the NK cell bias in MS in remission may contribute to the maintenance of clinical remission. As shown, IL-5 could directly inhibit the induction of Th1 cells. However, this cytokine only partly accounted for the Th1 inhibitory activities mediated by NK2 cells in vitro. Additional factors produced by NK cells are presumably involved. In addition, it is possible that the IL-5 produced by NK cells may participate in immunoregulation in a more complex way involving humoral immunity or eosinophils induced by IL-5.
Although a possible link between NK cells and autoimmune disease has long been suspected, the main focus of research has been directed against NK cell cytotoxic activity. Emerging roles of NK cells in immunoregulation prompt us to conduct further research into this subject. The association of NK2-like bias with MS remission indicates that immunological interventions causing such an NK bias may benefit patients with MS. Targeting NK cells may thus develop new therapeutic strategies or protective means for autoimmune diseases.
Acknowledgments
We thank M. Ogawa and M. Kawai, Musashi Hospital, National Center of Neurology and Psychiatry, for providing clinical samples for study, and T. Tabira, National Institute of Neuroscience, National Center of Neurology and Psychiatry, for support in the early stage of this work. We also thank Kyoko Nakata, Japan Branch of MS Cabin (International MS Support Foundation, Tokyo, Japan), for continuous help and encouragement. This work was supported by a Research on Brain Science grant from the Ministry of Health and Welfare in Japan.
References
- 1.Das MP, Nicholson LB, Greer JM, Kuchroo VK. Autopathogenic T helper cell type 1 (Th1) and protective Th2 clones differ in their recognition of the autoantigenic peptide of myelin proteolipid protein. J Exp Med. 1997;186:867–876. doi: 10.1084/jem.186.6.867. [DOI] [PMC free article] [PubMed] [Google Scholar]
- 2.Olivares-Villagomez D, Wang Y, Lafaille JJ. Regulatory CD4(+) T cells expressing endogenous T cell receptor chains protect myelin basic protein-specific transgenic mice from spontaneous autoimmune encephalomyelitis. J Exp Med. 1998;188:1883–1894. doi: 10.1084/jem.188.10.1883. [DOI] [PMC free article] [PubMed] [Google Scholar]
- 3.Wolf SD, Dittel BN, Hardardottir F, Janeway CA., Jr Experimental autoimmune encephalomyelitis induction in genetically B cell-deficient mice. J Exp Med. 1996;184:2271–2278. doi: 10.1084/jem.184.6.2271. [DOI] [PMC free article] [PubMed] [Google Scholar]
- 4.Zhang B, Yamamura T, Kondo T, Fujiwara M, Tabira T. Regulation of experimental autoimmune encephalomyelitis by natural killer (NK) cells. J Exp Med. 1997;186:1677–1687. doi: 10.1084/jem.186.10.1677. [DOI] [PMC free article] [PubMed] [Google Scholar]
- 5.Peritt D, et al. Differentiation of human NK cells into NK1 and NK2 subsets. J Immunol. 1998;161:5821–5824. [PubMed] [Google Scholar]
- 6.Paul WE, Seder RA. Lymphocyte responses and cytokines. Cell. 1994;76:241–251. doi: 10.1016/0092-8674(94)90332-8. [DOI] [PubMed] [Google Scholar]
- 7.Abbas AK, Murphy KM, Sher A. Functional diversity of helper T lymphocytes. Nature. 1996;383:787–793. doi: 10.1038/383787a0. [DOI] [PubMed] [Google Scholar]
- 8.Hoshino T, Winkler-Pickett RT, Mason AT, Ortaldo JR, Young HA. IL-13 production by NK cells: IL-13-producing NK and T cells are present in vivo in the absence of IFN-γ. J Immunol. 1999;162:51–59. [PubMed] [Google Scholar]
- 9.Poser CM, et al. New diagnostic criteria for multiple sclerosis: guidelines for research protocols. Ann Neurol. 1983;13:227–231. doi: 10.1002/ana.410130302. [DOI] [PubMed] [Google Scholar]
- 10.Warren HS, Kinnear BF, Phillips JH, Lanier LL. Production of IL-5 by human NK cells and regulation of IL-5 secretion by IL-4, IL-10, and IL-12. J Immunol. 1995;154:5144–5152. [PubMed] [Google Scholar]
- 11.Walker C, Checkel J, Cammisuli S, Leibson PJ, Gleich GJ. IL-5 production by NK cells contributes to eosinophil infiltration in a mouse model of allergic inflammation. J Immunol. 1998;161:1962–1969. [PubMed] [Google Scholar]
- 12.Mehrotra PT, et al. Production of IL-10 by human natural killer cells stimulated with IL-2 and/or IL-12. J Immunol. 1998;160:2637–2644. [PubMed] [Google Scholar]
- 13.Trinchieri G. Biology of natural killer cells. Adv Immunol. 1989;47:187–376. doi: 10.1016/S0065-2776(08)60664-1. [DOI] [PMC free article] [PubMed] [Google Scholar]
- 14.Young DA, et al. IL-4, IL-10, IL-13, and TGF-beta from an altered peptide ligand-specific Th2 cell clone down-regulate adoptive transfer of experimental autoimmune encephalomyelitis. J Immunol. 2000;164:3563–3572. doi: 10.4049/jimmunol.164.7.3563. [DOI] [PubMed] [Google Scholar]
- 15.Ramirez F, Mason D. Induction of resistance to active experimental allergic encephalomyelitis by myelin basic protein-specific Th2 cell lines generated in the presence of glucocorticoids and IL-4. Eur J Immunol. 2000;30:747–758. doi: 10.1002/1521-4141(200003)30:3<747::AID-IMMU747>3.0.CO;2-Y. [DOI] [PubMed] [Google Scholar]
- 16.Zipp F, et al. CD95 expression and CD95-mediated apoptosis of T cells in multiple sclerosis. No differences from normal individuals and no relation to HLA-DR2. J Neuroimmunol. 1997;81:168–172. doi: 10.1016/s0165-5728(97)00173-2. [DOI] [PubMed] [Google Scholar]
- 17.Zipp F, et al. Increased serum levels of soluble CD95 (APO-1/Fas) in relapsing-remitting multiple sclerosis. Ann Neurol. 1998;43:116–120. doi: 10.1002/ana.410430120. [DOI] [PubMed] [Google Scholar]
- 18.Wucherpfennig KW, Strominger JL. Molecular mimicry in T cell-mediated autoimmunity: viral peptides activate human T cell clones specific for myelin basic protein. Cell. 1995;80:695–705. doi: 10.1016/0092-8674(95)90348-8. [DOI] [PMC free article] [PubMed] [Google Scholar]
- 19.Zhang DH, Yang L, Ray A. Differential responsiveness of the IL-5 and IL-4 genes to transcription factor GATA-3. J Immunol. 1998;161:3817–3821. [PubMed] [Google Scholar]
- 20.Lee HJ, et al. GATA-3 induces T helper cell type 2 (Th2) cytokine expression and chromatin remodeling in committed Th1 cells. J Exp Med. 2000;192:105–115. doi: 10.1084/jem.192.1.105. [DOI] [PMC free article] [PubMed] [Google Scholar]
- 21.Illés Z, et al. Differential expression of NK T cell V alpha 24J alpha Q invariant TCR chain in the lesions of multiple sclerosis and chronic inflammatory demyelinating polyneuropathy. J Immunol. 2000;164:4375–4381. doi: 10.4049/jimmunol.164.8.4375. [DOI] [PubMed] [Google Scholar]
- 22.Bendelac A, Rivera MN, Park SH, Roark JH. Mouse CD1-specific NK1 T cells: development, specificity, and function. Annu Rev Immunol. 1997;15:535–562. doi: 10.1146/annurev.immunol.15.1.535. [DOI] [PubMed] [Google Scholar]
- 23.Exley M, Garcia J, Balk SP, Porcelli S. Requirements for CD1d recognition by human invariant Valpha24+ CD4-CD8- T cells. J Exp Med. 1997;186:109–120. doi: 10.1084/jem.186.1.109. [DOI] [PMC free article] [PubMed] [Google Scholar]
- 24.Carnaud C, et al. Cross-talk between cells of the innate immune system: NKT cells rapidly activate NK cells. J Immunol. 1999;163:4647–4650. [PubMed] [Google Scholar]
- 25.Eberl G, MacDonald HR. Selective induction of NK cell proliferation and cytotoxicity by activated NKT cells. Eur J Immunol. 2000;30:985–992. doi: 10.1002/(SICI)1521-4141(200004)30:4<985::AID-IMMU985>3.0.CO;2-E. [DOI] [PubMed] [Google Scholar]


