

Abstract
Binocular rivalry is a useful experimental paradigm to investigate aspects of neocortical dynamics related to conscious perception. Frequency-tagged EEG responses to a sine-flickered visual stimulus were contrasted between episodes of perceptual dominance, i.e., conscious perception of that stimulus and perceptual nondominance, i.e., conscious perception of a rival stimulus presented at a different frequency to the other eye. The amplitude and phase distribution of the stimulus-evoked steady-state responses depended on the stimulus modulation frequency, consistent with the presence of global resonance phenomena. At the apparent global resonance frequency, conscious perception of the stimulus modulated the steady-state response over the entire array of electrodes. These effects were significant at electrodes far from the primary visual cortex, including temporal, central, and frontal electrodes. The phase structure of the steady-state response was also investigated using coherence measures. Coherence between electrodes mostly increased during conscious perception of the stimulus. Analysis of partial coherence, removing stimulus-locked responses, indicated that synchronization of each signal to the stimulus flicker at each electrode and synchronization between signals that vary with respect to the stimulus flicker at each electrode both contribute to observed increases in coherence during conscious perception. These distinct modes of synchronization may reflect two different physiological mechanisms by which sensory signals are integrated across the cerebral cortex during conscious experience.
Keywords: EEG, coherence, SSVEP, consciousness, binocular rivalry
Introduction
In binocular rivalry, two incongruent visual images are simultaneously presented to an observer, one through each eye, but only one image is perceived at a time [Levelt, 1965]. The conscious percept spontaneously alternates between the two images every few seconds. Binocular rivalry has been used as an experimental paradigm for investigating neural correlates of conscious visual perception in both monkeys and human subjects [Logothetis et al., 1996; Tononi et al., 1998; Lumer et al., 1998; Leopold and Logothetis, 1996; Srinivasan et al., 1999; Tong et al., 1998; Sheinberg and Logothetis, 1997; Miller et al., 2000].
In monkeys, single-unit recordings during binocular rivalry have demonstrated that the firing of most neurons in primary visual cortex (V1) correlates with the stimulus rather than the percept [Leopold and Logothetis, 1996]. Only a small percentage of neurons in V1 change their firing rates in relation to the percept. In higher visual areas, such as inferior temporal cortex and superior temporal sulcus [Sheinberg and Logothetis, 1997], most single-unit activity is highly correlated with the reported percept. These findings suggest the possibility that changes in brain activity specifically related to perceiving one stimulus during binocular rivalry take place in higher areas of the visual system, and possibly in other areas of the brain.
Functional magnetic resonance imaging (fMRI) has offered the opportunity to investigate neural correlates of cognitive and perceptual function with good spatial resolution and coverage of the entire brain. However, fMRI is ultimately limited by the relatively slow time-scale of cerebral hemodynamics (on the order of seconds), which is slower that the rate of spontaneous perceptual alternation in binocular rivalry. As a consequence, fMRI studies of binocular rivalry have employed contrasts between rivalry and stimulus alternation or between rivalry and fusion or stereopsis to demonstrate brain activation in both primary visual cortex and other areas including prefrontal regions [Lumer et al., 1998; Tong et al., 1998]. Thus, fMRI studies of rivalry are not directly comparable to the unit-recording studies in monkeys that have investigated effects of conscious perception on neural activity related specifically to one of the competing stimuli in rivalry [Logothetis et al., 1996; Sheinberg and Logothetis, 1997; Leopold and Logothetis, 1996]
Although limited by low spatial resolution, magnetoencephalography (MEG) and electroencephalography (EEG) offer the advantages of millisecond temporal resolution, which is essential for contrasting the neural responses to one stimulus between the spontaneous episodes of perceptual dominance (i.e., perceiving only that stimulus) and nondominance (i.e., perceiving only the rival stimulus) that take place during binocular rivalry. While previous EEG studies have demonstrated that perceptual dominance increases the amplitude of visually evoked potentials, these experiments have primarily used only a few occipital electrodes [Brown and Norcia, 1997; Cobb et al, 1967; Lansing, 1964; Mackay, 1968].
In MEG studies of binocular rivalry, ‘frequency-tagging’ was introduced to contrast the evoked response to a flickering stimulus between episodes of perceptual dominance and nondominance during binocular rivalry (Tononi et al., 1998; Srinivasan et al., 1999]. In a frequency-tagging experiment, subjects are typically presented with one or more task-related images each sinusoidally flickered in luminance or contrast at a unique, fixed frequency. Steady-state responses, i.e., steady-state evoked potentials (SSVEP) or steady-state magnetic fields, are measured in the narrow frequency band, typically smaller than 0.1 Hz, centered on each stimulus frequency.
The frequency-tagging method provides a direct measure of brain activity elicited specifically by one stimulus, the steady-state response at the flicker frequency of that stimulus. In both MEG and EEG studies, these responses can be detected not only at sensors over primary visual cortex but (apparently) also over temporal and frontal areas of the brain. Task-related modulations of the amplitude, phase, and coherence of steady-state response to visual input have been recorded with both EEG and MEG at many scalp locations including frontal and prefrontal regions far from primary visual cortex [Tononi et al., 1998; Srinivasan et al., 1999; Silberstein et al., 2001].
In this study, the frequency-tagging method was applied investigate binocular rivalry in conjunction with EEG recordings. Steady-state responses evoked by the stimulus presented to one eye appear to reflect resonance phenomena in the brain with magnitude and spatial properties that depend on temporal frequency. Dynamic properties of these responses (power and coherence) are robustly modulated by conscious perception of the stimulus. These findings are similar to results obtained in MEG studies [Srinivasan et al., 1999]. A partial coherence measure is introduced to separate the contributions of synchronization of brain areas to the stimulus (external synchronization) and synchronization among brain areas (internal synchronization) related to conscious perception of the stimulus during binocular rivalry. The results suggest that future studies based on ‘frequency-tagging’ EEG or MEG have the potential to characterize the contributions of external and internal synchronization to the functional integration and/or segregation of cortical dynamics during cognitive or perceptual processes.
Methods
Experimental Methods
EEG and behavioral data were obtained from five right-handed adults (1 female and 4 male) aged 21–35. Informed consent was obtained from each subject. During the experiment, subjects viewed high-contrast (> 80%) spatial patterns subtending a visual angle of 13° on a monitor. The red and blue spatial patterns were composed of square patches distributed randomly over half of the area of a larger square. The two patterns always overlapped on 25% of the square, while neither pattern occupied 25% of the square, which remained black throughout the trial. The red pattern was presented to one eye and the blue pattern to the other eye by having subjects wear correspondingly colored lenses.
On each trial, the luminance of one stimulus was sine-modulated at one frequency while the other stimulus was sine-modulated at a different frequency. The two frequencies were selected from the following list: 7.1, 7.5, 8.0, 8.6, 9.2, 10.0, 10.9, 12.0, 13.3, 15.0, 17.1, 20, 24, 30 and 40 Hz. These frequencies correspond to one cycle of the stimulus every for an integer number video frames respectively, on a video monitor refreshing at 120 Hz. Subjects were asked to activate one switch with their left index finger whenever the red pattern was perceptually dominant and a second switch with the right index finger whenever the blue pattern was dominant. After a brief exposure to the stimuli, the subjects had no trouble categorizing the percepts as red, blue, or mixed. They were instructed to activate neither switch if neither of the two percepts was clearly dominant, i.e., when they saw a mixture of red and blue patches. The duration of each trial was 151 sec.
In order to emphasize the effect of perceptual dominance/nondominance over stimulus-specific factors, each stimulus frequency was presented at each color (red and blue) to each eye (left or right) with two different patterns. Thus, there were eight rivalry trials where a stimulus was presented at that frequency, each trial corresponding to a different stimulus configuration. Each of the subjects participated in 64–80 rivalry trials, providing data at 14 or 15 stimulus frequencies.
Fourier Analysis of EEG signals
The EEG was collected using a 128 channel Geodesic Sensor Net [Tucker, 1993], which provides uniform spatial sampling of the scalp surface subtending an angle of 120 degrees from vertex. Eighteen electrodes were disabled to allow stimulus information to be synchronized with the EEG recording, reducing the number of available EEG channels to 110. The EEG signals were recorded with a vertex reference, analog lowpass filtered at 50 Hz, and digitized at 1000 Hz. The EEG was mathematically rereferenced to the common average reference at each of 111 channels (including the reference). Although no EEG reference is “ideal”, the average reference enjoys the advantage of having some theoretical justification [Bertrand et al., 1986] and performs adequately as an approximation to reference-independent potentials in simulation studies [Srinivasan et al., 1998].
The first 3 seconds of each trial was discarded and the remainder divided into 6 epochs of duration ~ 25 seconds each. Thus, for every frequency, each of 8 trials, corresponding to a different stimulus configuration (eye, color, and spatial pattern) was divided into 6 epochs resulting in 48 epochs. The exact epoch length was independently selected for each stimulus frequency an as an integer multiple of the stimulus period.
Fourier analysis was performed by complex demodulation at the stimulus frequency. This procedure is closely related to the single-cycle Fourier coefficient method [Silberstein et al., 2001]. The first step in the method is to estimate single-cycle Fourier coefficients by approximating the integral:
| (1) |
where Vm(t) is the EEG data at channel m over one period T of the stimulus. The numerical integration was done with a Newton-Cotes composite integration method [Burden and Faires, 1985]. These complex-valued single-cycle Fourier coefficients were then coherently averaged (i.e., as complex numbers) over the epoch (~ 25 seconds) to obtain frequency resolution Δf ~ 0.04. For each epoch, the Fourier-coefficient estimate at the stimulus frequency obtained by complex demodulation was identical (within a standard error of .03%) to the estimate obtained by a conventional FFT [Matlab, Natick, MA] of the same epoch.
The recording of the switch positions indicated which stimulus the subject perceived. Episodes of perceptual dominance lasting less than 1 sec were discarded to limit the analysis to reliable reports of stable percepts. Furthermore, the first 250 msec and last 250 msec of each episode of perceptual dominance were also discarded, to account for possible offsets between a change in the percept and the subject’s response. At each stimulus frequency, the Fourier coefficient corresponding to perceptual dominance was calculated by averaging the single-cycle Fourier coefficients obtained only from cycles where the subject reported perceiving that stimulus. The Fourier coefficient during perceptual nondominance was obtained by averaging only the single-cycle Fourier coefficients over cycles where the subject reported perceiving the rival stimulus. Typically, within each epoch, 70–90% of the cycles were classified roughly equally as dominant or nondominant. For each stimulus-frequency, this resulted in an approximate frequency resolution Δf ~ 0.1 for the demodulated Fourier coefficient estimates during perceptual dominance ( ) and nondominance ( ) at each of m channels from each of 6 epochs (r) of 8 stimulus configurations (q).
Power Analysis
At each channel (m), the power at each stimulus frequency was calculated from the demodulated Fourier coefficients F̂mqr as , for each of R=6 epochs (r) of Q=8 stimulus configurations (q). Power was computed separately for each epoch and then averaged across these 48 epochs for perceptual dominance ( ) and perceptual nondominance ( ).
For each stimulus frequency, the noise power distribution was estimated by complex demodulation of all epochs where the two stimuli were being presented at other frequencies. At each channel, the noise power was set at the median of the power distribution for each stimulus frequency during perceptual dominance ( ) and nondominance ( ). During dominance, the signal and noise power estimates were used to calculate an estimate of the signal-to-noise ratio (SNR) as:
| (2) |
Similarly, was estimated at each channel during perceptual nondominance.
At each channel, the modulation of power at the stimulus frequency between perceptual dominance and nondominance was assessed by the modulation M, in dB:
| (3) |
A permutation test [Efron and Tibshirani, 1993] was employed to assess the statistical dependence of the power modulation (M) on the effect of perceptual dominance/nondominance at each channel. For each subject, permutation samples were computed by randomly reassigning the behavioral responses to rivalry trials, thereby randomizing the contrast between perceptual dominance and nondominance in the EEG data. The entire total of 8! = 40320 possible pairings, including the observed pairing, were used to yield statistics on the null hypothesis that no modulation is present (M = 0). If the null hypothesis were true, the observed pairing of response functions to EEG data would not be expected to yield a larger magnitude difference than a random assignment of response functions to EEG data.
For each permutation sample, power modulation M was computed in the same manner as for the observed data but using the randomly assigned response functions. The statistical significance of the observed value of M was established by comparing it with the distribution of permutation samples. The percentage of permutation samples with a higher M than the observed value determined the significance level. First, the omnibus significance level was calculated on the sum of M2 by using the permutation population summed across all 111 electrodes. If the overall difference was significant, individual channel modulations were first ranked in magnitude. Starting from the largest modulation, the individual channels were tested in rank order with a two-tailed significance test using the permutations samples obtained for that channel. When the largest non-significant difference was detected, no further channel pairs were tested.
Coherence analysis
The ordinary coherence of two channels m and k is a squared correlation coefficient that measures the fraction of variance in either channel at a given frequency that has amplitude and phase consistently (linearly) predicted by the other channel across epochs [Bendat and Piersol, 1986]. In applications to signals with limited dynamic range, such as EEG, coherence is mainly influenced by the phases of the two channels. A coherence value of 1 indicates that the two channels maintain the same phase difference on every epoch, while a coherence value close to 0 indicates that the phase differences are random from epoch to epoch.
In a frequency-tagging experiment, the phase of the steady-state response at each stimulus frequency can vary either because of genuine fluctuations in the phase of the response or simply because of additive noise. Furthermore, if the phase of the response becomes less variable at two channels, coherence between the channels will appear to increase as a consequence of phase-locking (decreased phase variability) of the response of each channel to the stimulus flicker. On the other hand, coherence may also reflect genuine consistency in the variation of phase across trials at two channels. This contribution to coherence reflects consistency in the relative phase of the response at two channels, in the presence of epoch-to-epoch variability [Trucullo et al. 2002] in the steady-state response at the stimulus frequency. In order to separate these two effects in coherence data, we introduce a partial coherence estimate to explicitly remove the contributions of phase locking to the stimulus to observed coherence. This approach is similar to the analysis of inter-trial variance of evoked potentials [Kalcher and Pfurtscheller, 1995].
At each stimulus frequency, for each stimulus configuration q, the stimulus-locked Fourier coefficient (Gmq) can be calculated at each channel m by coherent averaging of the R=6 epochs. A partial coherence can then be calculated by using residual Fourier coefficients Zmqr = Fmqr − Gmq . The partial coherence ( ) was then calculated using the partial cross-spectrum [Bendat and Piersol, 1986]:
| (4) |
The partial power, Λmm, is an estimate of the magnitude of the residual signal at each channel, after removing any stimulus-locked signals. The partial power was used to calculate the partial power modulation (pM) following Eq. 3. The partial power is a measure of the magnitude of steady-state response evoked by the stimulus that is variable across epochs. It is thus a measure of the magnitude of the residual signal that reflects the epoch-to-epoch variability of the response of neural populations to the stimulus [Truccolo et al., 2002]. The partial coherence ( ) equals 1 when this residual signal at channels m and k, after removing the appropriate (estimated) signal components that are identical across epochs, maintains constant relative phase between channels.
Ordinary and partial coherence were computed separately during perceptual dominance and nondominance, by using the appropriate demodulated Fourier coefficients. A permutation test (described for the SNR analysis) was used to test the significance of the difference in ordinary and partial coherence between dominance and nondominance. We first assessed the omnibus significance of each coherence difference, by evaluating the significance of the sum of squared coherence differences. If the overall difference was significant, individual pair differences were first ranked in magnitude. Starting from the largest difference, the individual differences were tested in rank order with a two-tailed significance test using the permutation samples obtained for that channel pair. When the largest non-significant difference was detected, no further channel pairs were tested.
Results
Behavioral data was collected in the form of two response functions one for the red image (left hand) and one for the blue image (right hand) each indicating episodes of dominance, i.e., exclusive visibility of the corresponding image. The mean duration of eposides of dominance of the stimulus (or nondominance of the rival stimulus) ranged from 2.2 to 3.1 secs in the 5 subjects. Typically, each epoch of duration 25 secs consisted of 3–6 episodes of perceptual dominance of each stimulus. At each stimulus frequency, no significant difference was found between the mean duration of episodes of dominance and nondominance for any of the subjects. However, there was a trend towards longer durations of stable perception of one stimulus as stimulus-frequency increased. Overall, individual subjects exhibited distinct dynamics in their behavioral responses, but these differences were not examined further as the EEG data analysis was carried out on a subject-by-subject basis, and emphasized a simple contrast between dominance and nondominance to identify correlates of conscious perception.
Figure 1 shows power spectra at two midline channels near Fpz (near the frontal pole) and Oz (over the occipital lobe) respectively. The power spectra were obtained from a single epoch (~24 s) during which the blue pattern was presented to the left eye at 3 different frequencies: 8.6, 9.2, and 10 Hz. On each epoch, the red pattern was presented at another, higher frequency (not shown). At the occipital channel, a large response can be detected at the stimulus frequency at 9.2 and 10 Hz, but not at 8.6 Hz. At the prefrontal channel, a response can be seen at 9.2 Hz but not at 10 Hz or 8.6 Hz.
Figure 1.
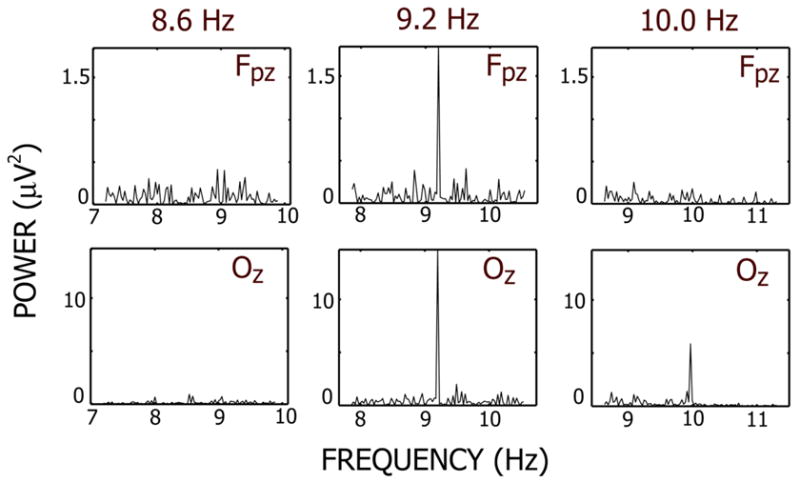
Power spectra at two EEG channels from individual epochs. Each epoch corresponds to a period where the blue stimulus was presented at 8.6 Hz, 9.2 Hz and 10 Hz. The red stimulus was presented at another, higher frequency. Both channels are located along the midline and are labeled by the closest 10/20-system channel location. Power spectra were calculated using conventional FFT methods and are in units of squared μVolts. In each case (A)–(C), the interval submitted to the FFT algorithm was an integer number of cycles of the stimulus frequency. Note that the steady-state response obtained from a single epoch is a narrow-band signal at stimulus frequency.
Over the frequency range of 7.1 to 17.1 Hz there was strong dependence of the response magnitude and spatial distribution on stimulus frequency. Figure 2 shows the power measured at each electrode in subject RY, averaged over all 48 epochs, at each stimulus frequency. In each plot, the channels have been organized into regional groups. The largest magnitude response was obtained at 9.2 Hz, with largest amplitudes at occipital and parietal regions of the head. At 10 Hz a similar pattern is obtained but with reduced amplitude. At 10.9 Hz occipital responses are similar to 10 Hz, but the parietal response is considerably reduced. At 9.2 Hz a response is also apparent at central, frontal, and prefrontal channels, but the magnitude of this response is much smaller than occipital or parietal electrodes. The sharp spectral peak shown at Fpz in Fig. 1, indicates that these responses are not noise, but stimulus-locked neural activity on each epoch. To avoid confounding the power estimates with spontaneous activity in the same frequency, SNR was calculated at each channel as described in the Methods section.
Figure 2.
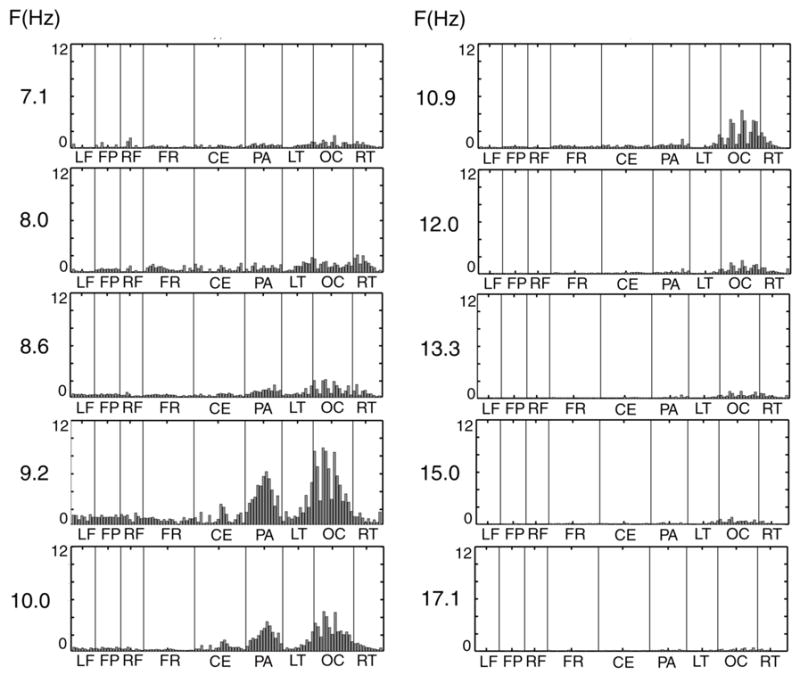
Power at the stimulus frequency at 111 channels. Each bar plot corresponds to a different stimulus frequency and is organized according to channel groups: LF – Left Prefrontal; FP – Frontal Pole; RF- Right Prefrontal; CF- Central Frontal; CE – Central; PA – Parietal; LT – Left Temporal; OC – Occipital; RT – Right Temporal. Power values are given in squared microvolts. Note that the magnitude and spatial distribution of the steady-state response at the stimulus flicker frequency depends strongly on the flicker frequency.
In all the subjects negligible power was detected at stimulus frequencies examined above 15 Hz, SNR was also reduced, and was > 6 dB at only a few occipital and/or parietal channels in all the subjects. The lowest stimulus frequency examined was 7.1 Hz. Often, at lower stimulus frequencies (< 7 Hz), subjects exhibited a larger response at the first harmonic than at the fundamental [Regan, 1989]. To avoid this complication we did not examine any stimulus frequencies below 7 Hz.
Figure 3 shows the spatial distribution of the SNR at the stimulus frequency over 111 scalp electrodes in subject RY at 8.6, 9.2, and 10 Hz during perceptual dominance and perceptual nondominance. For instance, in subject RY the response at 9.2 Hz covers almost all the scalp electrodes. Although the steady-state response has high signal to noise ratio at many scalp electrodes, including temporal and frontal electrodes, this activity cannot be unambiguously associated with sources specifically located in these cortical areas. EEG is dominated by cortical sources that are synchronized over long distances, i.e., low spatial frequency sources [Srinivasan et al., 1996]. The widespread activity evident in the EEG is likely a mixture of such global activity and relatively local activity that may be attributed to specific cortical areas [Nunez, 2000]. In each subject, a resonance frequency was apparent where the stimulus flicker induced a global response with very high power and SNR at a large number of electrodes. In subject RY, this global resonance frequency is shown in Figs. 1–3 at 9.2 Hz, where robust responses were detected with high signal-to-noise ratio over a large number of frontal electrodes.
Figure 3.
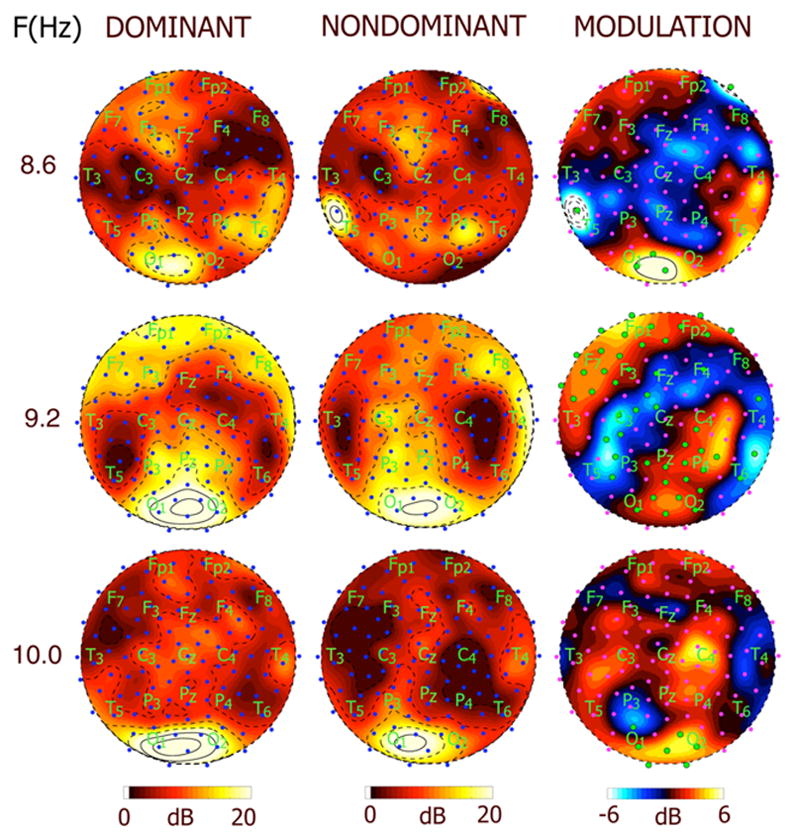
Topographic maps of SNR and power modulation (M) at three different stimulus frequencies for subject RY. Each row corresponds to a different stimulus frequency (A) 8.6 Hz (B) 9.2 Hz (C) 10 Hz. The column on the left shows map of SNR at the three frequencies during perceptual dominance (perceiving the stimulus). The column in the middle shows maps of SNR during perceptual nondominance (perceiving a rival stimulus presented at a different frequency). Contour lines are at intervals of 3.3 dB, with solid contour lines at and above 20 dB and dashed lines below 20 dB. The column on the right shows maps of power modulation M in dB. Contour intervals are at 1 dB with solid contour lines at and above 6 dB and dashed contour lines at and below −6 dB. Note that the distribution and modulation of the response is similar at adjacent frequencies, but can be recorded more easily at the global resonance frequency.
The right column in Fig. 3 shows the power modulation M between dominance and nondominance. At each frequency, most electrodes increase power at the stimulus frequency when the subject perceives the associated stimulus while much fewer electrodes that decrease power at the stimulus frequency. The omnibus significance of each of these patterns of modulation over the array of electrodes was established for each subject by a permutation test described in the Methods section. Individual channels were then tested for significant increase or decrease in power and are indicated by a large green dot in the maps. At 9.2 Hz, a large number of channels show significant increases or decreases of power, while at the adjacent frequency 8.6 Hz (A) only a few channels reach significance in spite a similar pattern of power modulation which reached significance in the omnibus test. Presenting the stimulus at a frequency close to a cortical resonance frequency increases SNR, which usually improves the power of statistical tests of significance differences between experimental conditions.
Figure 4 shows the power during dominance and nondominance and the power modulation at the global resonance frequency of 4 other subjects. In each subject, the global resonance frequency was typically near 10 Hz in both EEG and MEG [Srinivasan et al., 1999], and consistent with the extensive experiments by Regan [1989]. Three subjects (RY, JT, and RS) showed similar patterns of the spatial distribution of the global resonance frequency response with two distinct maxima at posterior and prefrontal areas, and a global resonance frequency of 9.2 Hz. Subjects MM and SC show a different distribution with maxima concentrated at posterior area and along the midline frontal areas and a global resonance frequency of 10 Hz. The right column of Fig. 4 shows the modulation of power for each of the subjects at the global resonance frequency. The distribution of significant modulation of power was highly varied between frequencies and across subjects, in part reflecting the variability of the distribution of the steady-state response with stimulus frequency and individual differences among the subjects. Significant increases of power were found in each subject over both anterior and posterior portions of the array. Each subject also shows some electrodes with reduced power during perceptual dominance. Power modulations of at least 3 db (50%) were observed in each subject at many electrodes.
Figure 4.
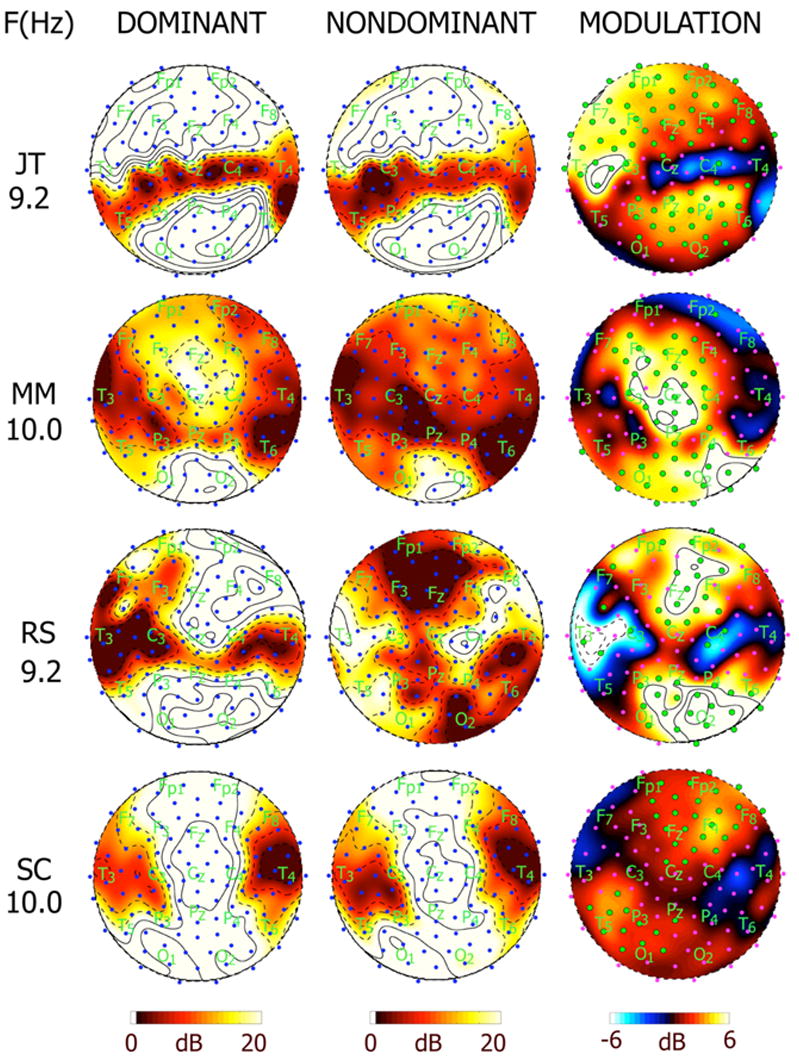
Topographic maps of SNR and power modulation (M) at the global resonance frequency for 4 other subjects. Each row corresponds to a different subject and stimulus frequency: MM at 10 Hz, RS at 9.2 Hz, RY at 9.2 Hz, and SC at 10 Hz, corresponding to the global resonance frequency for each subject in the alpha band. The column on the left shows map of SNR at the three frequencies during perceptual dominance (perceiving the stimulus). The column in the middle shows maps of SNR during perceptual nondominance (perceiving a rival stimulus presented at a different frequency). Contour lines are at intervals of 3.3 dB, with solid contour lines at and above 20 dB and dashed lines below 20 dB. The column on the right shows maps of power modulation M in dB. Contour intervals are at 1 dB with solid contour lines at and above 6 dB and dashed contour lines at and below −6 dB.
Figure 5 shows ordinary (left) and partial (right) coherence at the global resonance frequency of subject MM during perceptual dominance and nondominance. Each matrix shown is a 111 by 111 matrix corresponding to the EEG channels. Regions, as indicated by the labels, order the channels. The electrodes were grouped into regions according to their proximity to International 10/20 system electrodes as detailed in the figure caption. Ordinary coherence is very high (> 0.8) between many electrode pairs. Such high coherence reflects both genuine phase correlation and volume conduction effects. In theoretical studies it has been demonstrated that coherences between distant electrodes (> 12 cm) are less influenced by volume conduction [Nunez et al., 1997; Srinivasan et al., 1998], and reflect genuine correlation between large populations in distant areas of the brain.
Figure 5.
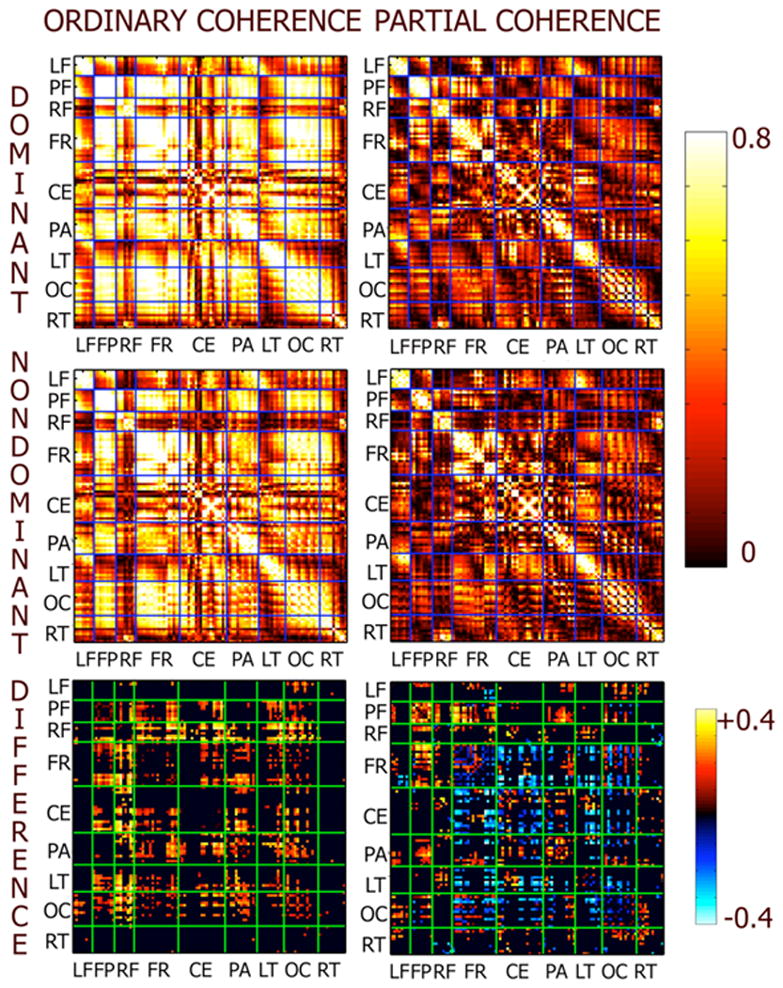
Matrix plots of ordinary and partial coherence at 10 Hz between all possible pairs of 111 electrodes in subject MM. Each matrix has rows and columns organized according to channel groups: LF – Left Prefrontal; FP – Frontal Pole; RF- Right Prefrontal; CF- Central Frontal; CE – Central; PA – Parietal; LT – Left Temporal; OC – Occipital; RT – Right Temporal. The left column are the ordinary coherences the right column are the partial coherences. The top row shows ordinary and partial coherence during perceptual dominance. The middle row shows ordinary and partial coherence during perceptual nondominance. The bottom row shows the difference in ordinary and partial coherence between dominance and nondominance. Only significant differences are shown, nonsignificant differences were set to zero.
Partial coherences were computed by removing the average stimulus-locked response from each epoch at each channel as discussed in the Methods section. Partial coherences are considerably reduced in comparison to ordinary coherence, but still remain high at many electrode pairs. High partial coherences indicate that the residual signal, after removing responses that maintain constant amplitude and phase with respect to the stimulus across epochs, exhibits phase correlation between electrodes. This phase correlation reflects consistency in relative phase between channels within the portion of the steady-state response that varies in phase and amplitude across epochs. Ordinary coherence between electrodes reflects a mixture of this “internal” synchronization and synchronization of each electrode to the stimulus flicker, i.e., “external” synchronization. It should be noted that volume conduction effects equally influence partial coherence as ordinary coherence, suggesting that only partial coherences between distant pairs of electrodes can be meaningfully interpreted as a reflection of synchronization between distant brain areas.
Figure 6 shows the relationship between ordinary coherence differences and partial coherence differences in each subject. Each point shown on the figure is a channel pair with a significant modulation of ordinary coherence. The larger circles represent channel pairs where both ordinary and partial coherence were significantly modulated. There are three distinct clusters of channel pairs, corresponding to two different patterns of coherence modulation during conscious perception. Two groups of electrode pairs, located in the upper right and lower left quadrant of each plot, show ordinary and partial coherence that both significantly increase or significantly decrease during conscious perception. Another group, in the lower right quadrant of each plot shows increased ordinary coherence but decreased partial coherence during conscious perception. No electrode pairs showed significant increases of partial coherence while ordinary coherence decreased.
Figure 6.
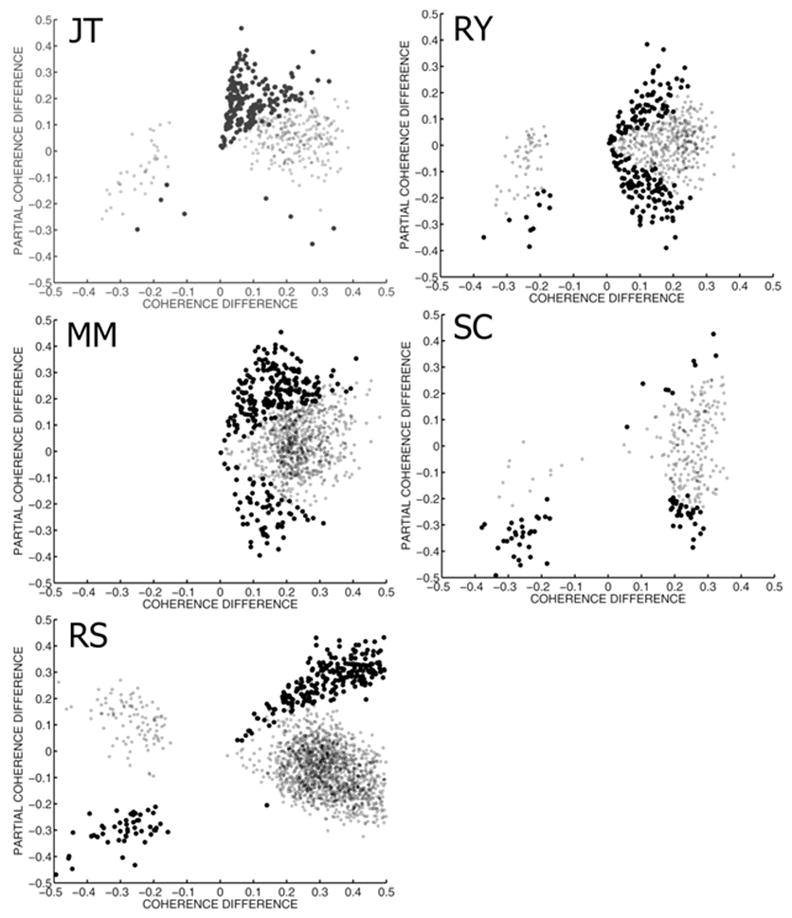
Modulation of ordinary and partial coherence by conscious perception. The difference in ordinary coherence between perceptual dominance and nondominance is plotted against the difference in partial coherence for each subject. Each dot in each graph represents a channel pair with significant modulation of ordinary coherence during conscious perception. Large dots indicate channels that significantly modulate both coherence and partial coherence. Note that some channels modulate both ordinary and partial coherence in the same direction, while others increase ordinary coherence while decreasing partial coherence.
Table 1 summarizes power modulation M averaged over electrodes that correspond to the three groups of ordinary and partial coherence modulation, labeled consistent increase (C+), consistent decrease (C−), and inconsistent (I). The average modulation of partial power, removing the stimulus-locked response, is also shown. Only channels that form pairs that significantly modulate ordinary coherence were included in the averages. Each subject shows several channel pairs that increased both ordinary and partial coherence (C+). Coupled with this increase in coherence is a large increase in both power (M > 0) and partial power (pM > 0) at these electrodes. Conversely, channel pairs that significantly decrease ordinary and partial coherence show decreases in both power (M < 0) and partial power (pM < 0). Thus, in these electrode pairs, the residual signal, i.e., the epoch-to-epoch variability of the response, exhibits phase consistency across epochs, contributing to the measured change in ordinary coherence during conscious perception. Increases (or decreases) in power and coherence are related to each other, but are only partially synchronized to the stimulus flicker. This internal synchronization is the presence of phase correlation between electrodes, independent of the phase relationship between the stimulus flicker and the signal at each electrode.
Table 1.
Average modulation of power (M) and partial power (pM) by conscious perception in three groups of electrodes: (C+) increased ordinary and partial coherence; (C−) decreased ordinary and partial coherence; and (I) increased ordinary and decreased partial coherence. Only channel pairs that significantly modulate ordinary coherence are included in the averages, and for every pair each channel was added to the average. Modulation is in units of dB as defined by Eq. 3. M and pM were calculated at each channel and then weighted averaged across channels. The weight used reflected the number of channel pairs involving that channel. Subject MM had no channels that reduced ordinary coherence during conscious perception.
| Subject | C+ | C+ | C− | C− | I | I |
|---|---|---|---|---|---|---|
| M(dB) | pM(dB) | M | pM(dB) | M | pM(dB) | |
| JT | 3.4 | 1.8 | −0.8 | −0.2 | 1.4 | −3.3 |
| MM | 2.1 | 1.3 | - | - | 0.6 | −4.2 |
| RS | 3.8 | 1.1 | −1.2 | −1.4 | 0.2 | −2.9 |
| RY | 2.8 | 1.9 | −1.8 | −2.2 | −0.7 | −3.2 |
| SC | 3.1 | 2.8 | −1.2 | −1.1 | −0.5 | −3.0 |
The other pattern of coherence modulation by conscious perception involved increased coherence and decreased partial coherence. These electrodes show power modulation that could be increasing or decreasing, but were not usually significant. In each subject these electrodes show large decreases in partial power (pM < 0) during conscious perception. This indicates that increased coherence between these channel pairs results from a reduction in the epoch-to-epoch variability of phase with respect to the stimulus at each channel. As power is negligibly modulated these channels are demonstrating synchronization to the stimulus flicker, i.e., external synchronization, during conscious perception.
Figure 7 shows matrix plots of significant differences in ordinary and partial coherence in the other four subjects. The omnibus significance of each set of coherence differences was first established using a permutation test and then a set of individual significance tests were performed on each coherence difference as described in the Methods section. In each subject, ordinary coherence significantly increases at the stimulus frequency at many channel pairs, while only a few channel pairs show significant decreases in coherence. In all the subjects, ordinary coherence at the stimulus frequency almost always increased during conscious perception of that stimulus. The specific pattern of coherence varied considerably between subjects. One subject (RS) shows very large increases in ordinary coherence across most regions of the head. All the subjects except JT shows increases in coherence include long-range coherences between occipital/parietial electrodes and frontal and prefrontal electrodes. JT shows the strongest modulation of ordinary coherence between central and parietal electrodes. By contrast, relatively few of the coherences within any area, e.g., among occipital electrodes, are modulated by conscious perception. Volume conduction dominates these coherences between closely spaced electrodes [Srinivasan et al., 1998], which makes it difficult to observe changes related to cognitive or perceptual processes.
Figure 7.
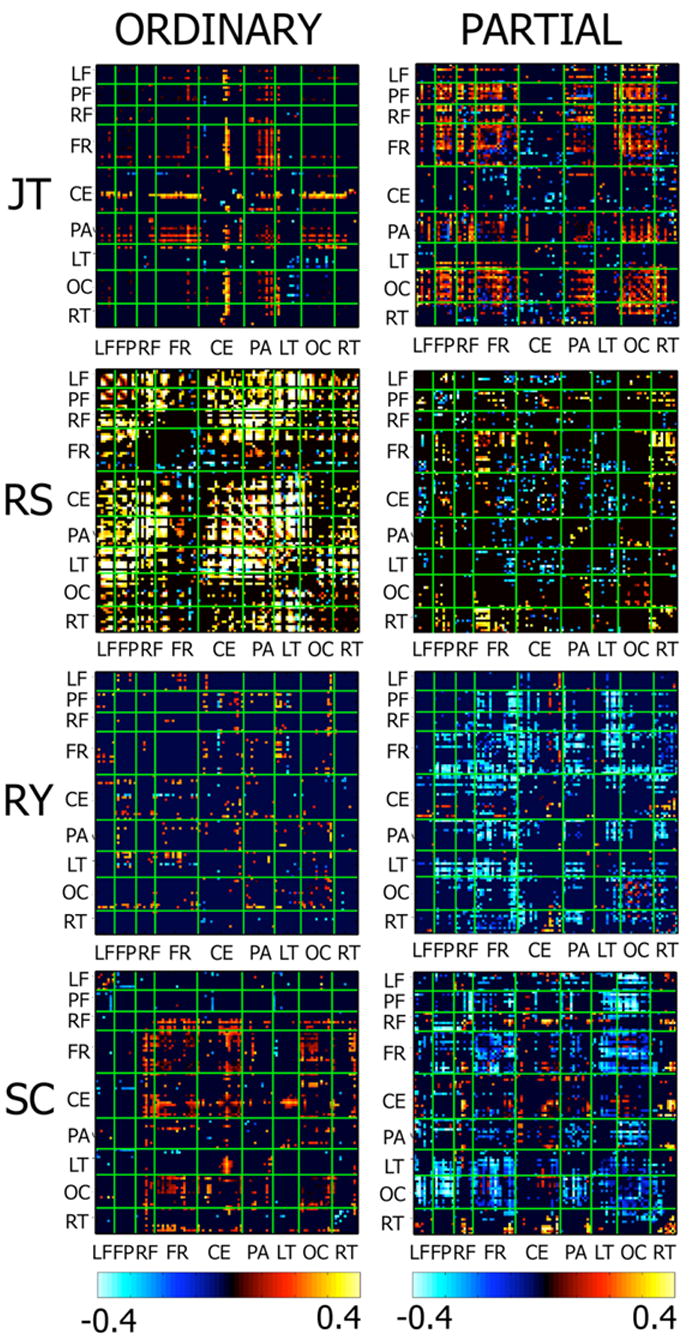
Matrix plots of the difference in ordinary and partial coherence between perceptual dominance and nondominance at the global resonance frequency of 4 subjects. Each matrix has rows and columns organized according to channel groups: LF – Left Prefrontal; FP – Frontal Pole; RF- Right Prefrontal; CF- Central Frontal; CE – Central; PA – Parietal; LT – Left Temporal; OC – Occipital; RT – Right Temporal. The bottom row shows the difference in ordinary and partial coherence between dominance and nondominance. Only significant differences are shown, nonsignificant differences were set to zero.
In each subject, modulation of partial coherence between electrodes by conscious perception occurs at some of the electrode pairs that show significant modulation of ordinary coherence as shown in Fig. 7. In addition, some electrode pairs that show no significant change in ordinary coherence modulate partial coherence during conscious perception. These modulations reflect changes in the consistency between channels of the portion of the signal that is variable from epoch to epoch, in the absence of significant changes in the ordinary coherence between these channels. A modulation of partial coherence without modulating the ordinary coherence indicates that epoch-to-epoch variability is a small portion of the total signal at these channels. Four subjects (MM, RS, RY, SC) mostly showed mostly decreased partial coherence at these channel pairs. One subject (JT) showed increased partial coherence between many occipital/parietal and frontal channels without significant changes in ordinary coherence between these channels.
Discussion
The results of this EEG study confirm the basic findings of earlier MEG studies of binocular rivalry [Tononi et al., 1998; Srinivasan et al., 1999]. By using the ‘frequency-tagging’ method, neural responses specifically elicited by each of the two competing stimuli was isolated in EEG recordings. These steady-state responses were contrasted between periods when the associated stimulus was perceived (perceptual dominance) versus periods when the rival stimulus, tagged at a different frequency and presented to the other eye, was perceived (perceptual nondominance). Since the physical stimuli are constant, this contrast relates to the conscious experience of the stimulus.
Power at the stimulus frequency increased significantly during conscious perception. This effect was highly significant at many electrodes, including electrodes over frontal areas of the array. Although this result appears superficially consistent with results in MEG experiments, showing significant modulation of power at frontal electrodes [Srinivasan et al., 1999], these effects need not be generated by the same sources. MEG is generated by synchronous synaptic activity in neural populations (current sources) oriented tangential to the sensor coils, which are mainly located in the sulcal walls of the cortex [Nunez, 1986; Hamaleinen, 1993]. EEG is generated both by radial current sources in the gyral surfaces of the cortex and by tangential current sources in the sulcal walls, with the radial sources make a larger contribution in part due to proximity [Nunez, 1981]. Thus, EEG and MEG are biased towards different subsets of cortical sources. This difference is sensitivity may explain qualitative differences in the pattern of power modulation. In MEG studies, the largest (and most significant) modulations observed were usually at temporal or frontal sensors despite the larger signal at occipital/parietal sensors. By contrast, in this EEG study the modulation was comparable across cortical areas.
Increased power at the stimulus frequency during conscious perception of the stimulus reflects increased synchronization within the volume of tissue that contributes to the scalp electrode. Simulation studies with approximate volume conduction models of the head suggest that EEG electrodes are sensitive to current sources located at distances as great as 10 cm [Nunez, 1981; Malmivuo and Plonsey, 1995; Srinivasan et al., 1998]. Thus, while the results of the present experiment confirm that increased power can be detected at frontal electrodes, consistent with MEG [Srinivasan et al., 1999], we cannot conclude with certainty that these increases are taking place specifically in frontal areas of the cortex, and likely reflects a pattern of activity organized across many regions of the cortex.
Ordinary coherence between electrodes was measured to examine the effects of conscious perception of a stimulus on the phase correlation of steady-state responses at the stimulus frequency. In general, coherence increased between electrodes during conscious perception. This effect was not homogeneous across electrodes or subjects, but was widespread across many electrodes in all the subjects, including electrodes over frontal areas. Fewer electrode pairs show significantly decreased coherence during conscious perception.
Coherence measures the extent to which the signals at one frequency at two channels are related by a constant-parameter linear model. In the typical cognitive EEG or ERP experiment, an external stimulus is presented to the subject and EEG in the post-stimulus interval at two (or more) channels are analyzed for phase synchronization across epochs using coherence. This phase synchronization can be the result of a genuine functional connection between two cortical areas. It can also result from the synchronization of the response of each cortical area to the stimulus. The latter effect, external synchronization, gives rise to the ERP signal, which is the time- (or phase-) locked response to the stimulus.
The frequency-tagging method makes use of two (or more) sinusoidally flickered stimuli to isolate stimulus-specific steady-state neural responses at the flicker frequencies. This response is measured in a narrow frequency band surrounding the stimulus frequency. The phases measured at two channels may be synchronized because of direct or indirect functional connections that couple the neural responses recorded at the electrodes. They may also appear synchronized because each channel is synchronous with the stimulus flicker. To separate these effects we introduce a partial coherence to measure coherence between channels after removing the portion of the signal phase-locked to the stimulus, thereby examining the phase correlation of the residual signals that exhibit variability in phase across epochs [Truccolo et al., 2002].
Partial coherence indicates some channel pairs that increased coherence significantly during conscious perception also increased partial coherence. Coupled with these increases in coherence were increases in both power and partial power, which is estimated removing the portion of the response that is phase-locked across epochs. A smaller group of electrodes show decreases in both ordinary and partial coherence with corresponding decreased power and partial power. These complementary patterns suggest that at these electrodes modulation of power and coherence by conscious perception is independent of the synchronization of each channel with respect to the stimulus flicker. This internal synchronization appears to be a genuine reflection of functional integration among cortical areas.
The analysis of partial coherence also identified channel pairs where ordinary coherence increases while partial coherence decreases during conscious perception. These channels were characterized by negligible modulation of power and significant decreases in partial power. This pattern is consistent if the main effect at these channels is increased synchronization with respect to the stimulus flicker during conscious perception. This external synchronization gives rise to the appearance of increased coherence between electrodes.
Both internal and external synchronization contribute to increased coherence of the stimulus-specific steady-state neural response during conscious perception. Since the physical stimuli were constant throughout the experiment this increased synchronization is related to the conscious experience of the stimulus rather than physical properties of the stimulus. Consistent with MEG studies [Srinivasan et al., 1999], these increases in coherence include long-range coherences between distant cortical areas, including frontal areas.
Internal and external synchronization give rise to distinct patterns of modulations of the statistical structure of the steady-state response, analyzed using ordinary and partial coherence as described here. What neural mechanisms can give rise to these distinct patterns of coherence modulation during conscious perception of the stimulus? External synchronization is a phenomenon of reduced variability of a cortical area in response to the stimulus, i.e., a more precise synchronization of individual cortical areas to the stimulus. Although this effect could be a consequence of feedback from other areas, a local model can adequately explain external synchronization. As demonstrated in the cat, neurons in primary visual cortex can be precisely synchronized at the stimulus flicker [Rager and Singer, 1998]. Internal synchronization is necessarily mediated by some mechanisms of feedback interaction between cortical areas. As each channel varies in phase with respect to the stimulus, the relative phase between channels is constrained. From EEG data alone we cannot distinguish between a direct interaction between cortical areas and indirect interactions mediated by other cortical areas or the thalamus. Large-scale theoretical models of neocortex suggest that most interactions between cortical regions take place directly via corticocortical fiber systems rather than thalamocortical systems, and predict synaptic dynamics that are characterized by a dispersion relation [Nunez, 2000]. A neocortical dispersion relation could manifest itself in steady-state EEG signals as spatio-temporal resonance structure, i.e., responses at preferred temporal frequencies (resonance frequencies) that vary spatially across the cortex.
The steady-state response at the apparent global resonance frequency, i.e., the stimulus frequency between 7 and 15 Hz that produced the maximum response over a wide range of electrodes covering the whole head, was the focus of this study. In general, the choice of stimulus frequency will influence both spatial and temporal properties of the steady-state responses. Regan [1989] has demonstrated that human subjects can have distinct resonance frequencies, in the theta, alpha, beta, and gamma bands. In this study we have identified the resonance peak for individual subjects in the alpha band. Studies carried out at other frequencies could yield different results as they could involve resonant responses of different neural systems that receive visual input. In this study, steady-state response to a flickering stimulus produces a global response over many electrodes in the alpha band. Both internal and external synchronization appear to modulate phase correlation among these electrodes during conscious perception. Further studies are required to investigate the effect of conscious perception on stimulus-specific steady-state responses in other frequency bands.
The frequency-tagging method provides a direct means to isolate neural activity specifically associated with a visual stimulus. In addition to studies of conscious perception [Tononi et al., 1998; Srinivasan et al., 1999], frequency tagging has been applied to investigate selective attention [Morgan et al., 1996; Muller et al., 1998] and perceptual organization [Tarokh and Srinivasan, 2002]. The narrow band steady-state response offers the advantage of high signal-to-noise ratios in comparison with other methods extract stimulus-related neural activity, e.g., ERP, in part because of reduced sensitivity to broadband artifacts [Silberstein, 1995].
The analysis of partial coherence presented here provides a direct method to isolate the contribution of neural responses that precisely follow the time course of sensory events from apparent phase correlations among EEG electrodes (or MEG sensors). This approach is critical to isolate genuine functional integration, reflected in internal synchronization, from external synchronization imposed by the timing of stimuli in the experiment. This distinction is important not only for the analysis of steady-state signals obtained in frequency-tagging experiments but also for the analysis of coherence in conventional ERP experiments. Any analysis of brain activity evoked by sensory stimuli whether transient or steady-state must take into account the trial-to-trial variability in the neural response [Truccolo et al., 2002]. Partial coherence (or correlation) measures provide the means to quantify the extent to which this variability is correlated between electrodes, which is an indication of genuine functional connectivity between the cortical areas that contribute signal to the electrodes.
Acknowledgments
The author would like to thank Prof. Paul Nunez of Tulane University, USA and Prof. Richard Silberstein of the Brain Sciences Institute, Australia for many useful discussions on partial coherence and steady-state evoked potentials.
Footnotes
Citation
Srinivasan, R. (2004). Internal and external neural synchronization during conscious perception. International Journal of Bifurcation and Chaos, 14(2), 825-842.
References
- Bendat JS, Piersol AG. Random Data: Analysis and Measurement Procedures. 2. New York: Wiley; 1986. [Google Scholar]
- Bertrand O, Perrin F, Pernier J. A theoretical justification of the average reference in topographic evoked potential studies. Electroencephalography and Clinical Neurophysiology. 1986;62:462–464. doi: 10.1016/0168-5597(85)90058-9. [DOI] [PubMed] [Google Scholar]
- Brown RJ, Norcia AM. A method for investigating binocular rivalry in real-time with the steady-state VEP. Vision Research. 1997;37:2402–2408. doi: 10.1016/s0042-6989(97)00045-x. [DOI] [PubMed] [Google Scholar]
- Burden RL, Faires JD. Numerical Analysis. Prindle, Weber & Schmidt; Boston: 1985. [Google Scholar]
- Cobb WA, Morton HB, Egglinger G. Cerebral potentials evoked by pattern reversal and their suppression in visual rivalry. Nature. 1967;216:1123–1125. doi: 10.1038/2161123b0. [DOI] [PubMed] [Google Scholar]
- Efron B, Tibshirani RJ. An introduction to the bootstrap. Chapman & Hall; New York: 1993. [Google Scholar]
- Kalcher J, Pfurtscheller G. Discrimination between phase-locked and non phase-locked event-related EEG activity. Electroencephalography and Clinical Neurophysiology. 1995;94:381–384. doi: 10.1016/0013-4694(95)00040-6. [DOI] [PubMed] [Google Scholar]
- Hamaleinen M, Hari R, Ilmoniemi RJ, Knuutila J, Lounasmaa OV. Magnetoencephalography – theory, instrumentation, and applications to nonivasive study of the working human brain. Rev Mod Phys. 1993;65:413–497. [Google Scholar]
- Lansing RW. Electroencephalographic correlates of binocular rivalry in man. Science. 1964;146:1325–1327. doi: 10.1126/science.146.3649.1325. [DOI] [PubMed] [Google Scholar]
- Leopold DA, Logothetis NK. Activity changes in early visual cortex reflect monkeys’ percepts during binocular rivalry. Nature. 1996;379:549–553. doi: 10.1038/379549a0. [DOI] [PubMed] [Google Scholar]
- Logothetis NK, Leopold DA, Sheinberg DL. What is rivaling during binocular rivalry [see comments]? Nature. 1996;380:621–624. doi: 10.1038/380621a0. [DOI] [PubMed] [Google Scholar]
- Lumer ED, Friston KJ, Rees G. Neural correlates of perceptual rivalry in the human brain. Science. 1998;280:1930–1934. doi: 10.1126/science.280.5371.1930. [DOI] [PubMed] [Google Scholar]
- Malmivuo J, Plonsey R. Bioelectromagnetism. Oxford U; New York: 1995. [Google Scholar]
- Mackay DM. Evoked responses reflecting interocular and monocular suppression. Nature. 1968;217:81–83. doi: 10.1038/217081a0. [DOI] [PubMed] [Google Scholar]
- Miller SM, Liu GB, Ngo TT, Hooper G, Riek S, Carson RG, Pettigrew JD. Interhemispheric switching mediates perceptual rivalry. Current Biology. 2000;10:383–392. doi: 10.1016/s0960-9822(00)00416-4. [DOI] [PubMed] [Google Scholar]
- Morgan ST, Hansen JC, Hillyard SA. Selective attention to stimulus location modulates the steady-state visually evoked potential. Proc Nat Acad Sci USA. 1996;93:4770–4. doi: 10.1073/pnas.93.10.4770. [DOI] [PMC free article] [PubMed] [Google Scholar]
- Muller MM, Picton TW, Valdes-Sosa P, Riera J, Teder-Salejarvi WA, Hillyard SA. Effects of spatial selective attention on the steady-state visually evoked potential in the 20–28 Hz range. Brain Research Cognitive Brain Research. 1998;6:249–261. doi: 10.1016/s0926-6410(97)00036-0. [DOI] [PubMed] [Google Scholar]
- Nunez PL. Electric Fields of the Brain: The Neurophysics of EEG. Oxford U; New York: 1981. [Google Scholar]
- Nunez PL. Neocortical Dynamics and Human EEG Rhythms. Oxford U; New York: 1995. [Google Scholar]
- Nunez PL, Silberstein RB, Cadusch PJ, Wijesinghe RS, Westdorp AF, Srinivasan R. A theoretical and experimental study of high resolution EEG based on surface Laplacians and cortical imaging. Electroencephalography and Clinical Neurophysiology. 1994;90:40–57. doi: 10.1016/0013-4694(94)90112-0. [DOI] [PubMed] [Google Scholar]
- Nunez PL, Srinivasan R, Westdorp AF, Wijesinghe RS, Tucker DM, Silberstein RB, Cadusch PJ. EEG coherency I: Statistics, reference electrode, volume conduction, Laplacians, cortical imaging, and interpretation at multiple scales. Electroencephalography and Clinical Neurophysiology. 1997;103:499–515. doi: 10.1016/s0013-4694(97)00066-7. [DOI] [PubMed] [Google Scholar]
- Rager G, Singer W. The response of the cat visual cortex to flicker stimuli of variable frequency. European Journal of Neuroscience. 1998;10:1856–1877. doi: 10.1046/j.1460-9568.1998.00197.x. [DOI] [PubMed] [Google Scholar]
- Regan D. Human brain electrophysiology. New York: Elsevier; 1989. [Google Scholar]
- Sheinberg DL, Logothetis NK. The role of temporal cortical areas in perceptual organization. Proceedings of the National Academy of the Sciences USA. 1997;94:3408–3413. doi: 10.1073/pnas.94.7.3408. [DOI] [PMC free article] [PubMed] [Google Scholar]
- Silberstein RB. Steady-state visually evoked potentials, brain resonances, and cognitive processes. In: Nunez PL, editor. Neocortical Dynamics and Human EEG Rhythms. Oxford UP; New York: 1995. [Google Scholar]
- Silberstein RB, Nunez PL, Pipingas A, Harris P, Danieli F. Steady-state visually evoked potential topography in a graded working memory task. International Journal of Psychophysiology. 2001;42:219–232. doi: 10.1016/s0167-8760(01)00167-2. [DOI] [PubMed] [Google Scholar]
- Srinivasan R, Russell DP, Edelman GM, Tononi G. Increased synchronization of neuromagnetic responses during conscious perception. Journal of Neuroscience. 1999;19:5345–5348. doi: 10.1523/JNEUROSCI.19-13-05435.1999. [DOI] [PMC free article] [PubMed] [Google Scholar]
- Srinivasan R, Nunez PL, Silberstein RB. Spatial filtering and neocortical dynamics: estimates of EEG coherence. IEEE Trans Biomedical Engineering. 1998;45:814–826. doi: 10.1109/10.686789. [DOI] [PubMed] [Google Scholar]
- Srinivasan R, Nunez PL, Tucker DM, Silberstein RB, Cadusch PJ. Spatial sampling and filtering of EEG with spline Laplacians to estimate cortical potentials. Brain Topography. 1996;8:355–366. doi: 10.1007/BF01186911. [DOI] [PubMed] [Google Scholar]
- Tong F, Nakayama K, Vaughan JT, Kanwisher N. Binocular rivalry and visual awareness in human extrastriate cortex. Neuron. 1998;21:753–759. doi: 10.1016/s0896-6273(00)80592-9. [DOI] [PubMed] [Google Scholar]
- Tononi G, Srinivasan R, Russell DP, Edelman GM. Investigating neural correlates of conscious perception by frequency-tagged neuromagnetic responses. Proc Natl Acad Sci USA. 1998;95:3198–203. doi: 10.1073/pnas.95.6.3198. [DOI] [PMC free article] [PubMed] [Google Scholar]
- Tarokh L, Srinivasan R. Global processing of hierarchical images synchronizes neural activity. Cognitive Brain Research. 2002 submitted. [Google Scholar]
- Truccolo WA, Ding M, Knuth KH, Nakamura R, Bressler SL. Trial-to-trial variability of cortical evoked responses: implications for the analysis of functional connectivity. Clinical Neurophysiology. 2002;113:206–226. doi: 10.1016/s1388-2457(01)00739-8. [DOI] [PubMed] [Google Scholar]