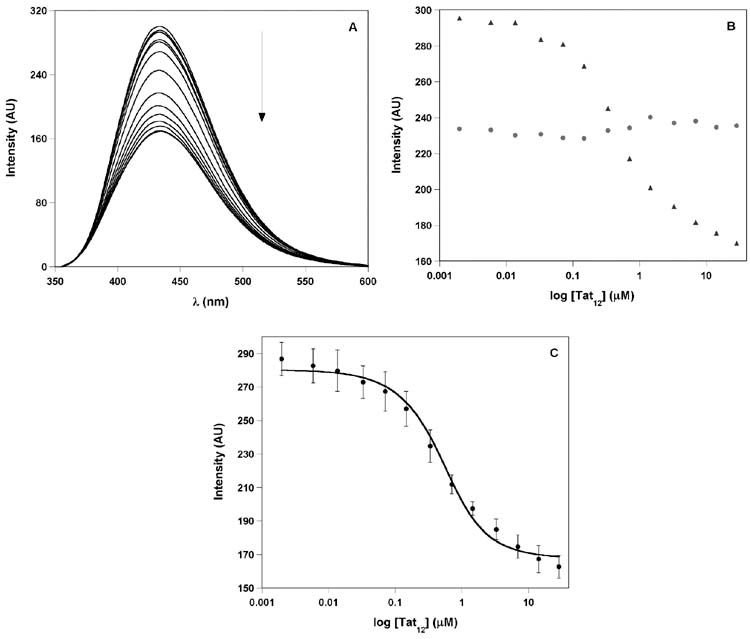
Figure 9.
Titration of furan-labeled F-TAR2 duplex construct with the Tat12 peptide performed in Tris buffer containing 0.50 μM RNA (see Experimental Section for details). (A) Representative emission spectra for the titration of F-TAR2 duplex with Tat12 peptide. Fluorescence intensity decreased with increasing concentrations of peptide. (B) Fluorescence intensity is plotted against log of peptide concentration. ssRNA, T1 (red) and F-TAR2 duplex (blue). Note the lower emission intensity of the single stranded T1 oligonucleotide. (C) Curve fitting for the titration of duplex F-TAR2 with Tat12 peptide (see Experimental Section for additional details).

