

Abstract
The use of 1H transverse paramagnetic relaxation enhancement (PRE) has seen a resurgence in recent years as method for providing long-range distance information for structural studies and as a probe of large amplitude motions and lowly populated transient intermediates in macromolecular association. In this paper we discuss various practical aspects pertaining to accurate measurement of PRE 1H transverse relaxation rates (Γ2). We first show that accurate Γ2 rates can be obtained from a two time-point measurement without requiring any fitting procedures or complicated error estimations, and no additional accuracy is achieved from multiple time-point measurements recorded in the same experiment time. Optimal setting of the two time-points that minimize experimental errors is also discussed. Next we show that the simplistic single time-point measurement that has been commonly used in the literature, can substantially underestimate the true value of Γ2, unless a relatively long repetition delay is employed. We then examine the field dependence of Γ2, and show that Γ2 exhibits only a very weak field dependence at high magnetic fields typically employed in macromolecular studies. The theoretical basis for this observation is discussed. Finally, we investigate the impact of contamination of the paramagnetic sample by trace amounts (≤5%) of the corresponding diamagnetic species on the accuracy of Γ2 measurements. Errors in Γ2 introduced by such diamagnetic contamination are potentially sizeable, but can be significantly reduced by using a relatively short time interval for the two time-point Γ2 measurement.
Keywords: 1H-T2, Paramagnetic relaxation enhancement, EDTA-Mn2+, Spin-label
1. Introduction
The history of paramagnetic relaxation enhancement (PRE) dates back to that of the nuclear Overhauser effect (NOE). Indeed, in Solomon's classic 1955 paper, the relevant equations for both the NOE and PRE were presented (1). Despite the long history of the PRE and its potential to provide unique long-range distance information in the 15-35 Å range, until relatively recently, applications of the PRE to studies of biological macromolecules that do not possess an intrinsic paramagnetic group, have been rather limited. Recent technical advances that permit easy and reliable conjugation of a paramagnetic group to a specific site have changed this situation, and PRE studies on macromolecules, to which an extrinsic paramagnetic group has been attached, are becoming increasingly popular.
The PRE arising from unpaired electrons with an isotropic g-tensor (such as a nitroxide spin-label or EDTA-Mn2+) has proved to be a versatile tool. PRE analysis for such systems is simple, since there are no pseudo-contact shifts, and Curie-spin relaxation that could potentially exhibit significant cross-correlation with other relaxation mechanisms (2, 3), is negligible. Using this type of PRE data, macromolecular structures have been characterized for soluble proteins (4-10), protein-protein complexes (11-14), protein-oligosaccharide complexes (15,16), protein-nucleic acid complexes (17-21), and membrane proteins (22,23). The PRE can also provide information relating to large-scale dynamics that accompany changes of paramagnetic center - 1H distances, for example in non-specific protein-DNA interactions (24,25) and inter-domain motions (26). A recent major advance in the field is the finding that in the fast exchange regime the intermolecular PRE can provide a powerful probe to detect and characterize transient, lowly populated intermediates in macromolecular binding events, thereby providing structural information on encounter complexes that cannot be obtained by any other biophysical technique (27,28).
For such investigations, the PRE for 1H-transverse magnetization (referred to here as 1H-Γ2) is often used. The large magnitude of 1H-Γ2 makes it a highly sensitive probe. This is due to the large nuclear gyromagnetic ratio of the proton and the primary dependence of 1H-Γ2 on the spectral density function at zero-frequency. In addition, 1H-Γ2 is much less susceptible to internal motions and cross relaxation than the longitudinal 1H-PRE (referred to as 1H-Γ1) which is highly sensitive to these two factors (20). For quantitative analysis, it is very important to accurately and precisely measure 1H-Γ2 rates and to understand potential pitfalls in the measurements. In this paper, we describe practical aspects of 1H-Γ2 measurements for amide protons of proteins.
2. Materials and Methods
2.1 NMR samples
Experimental PRE data were acquired on two samples: a 20 kDa complex between 2H/15N-labeled SRY and a 14-bp DNA duplex with dT-EDTA located at the third base-pair (site c displayed in Fig. 2 of Ref. 20); and 15N-labeled HPr(E32C) with EDTA-Mn2+ conjugated at Cys32.
Fig. 2.

Theoretical relationship between the delay difference ΔT and the error σ(Γ2) in the value of Γ2 obtained from a two time-point measurement (first time point, T = 0; second time point T = ΔT). The error function is given by Eq. 6. The results are shown for Idia(0)/σ(Idia) = 200.0, where Idia(0) is the signal height at T = 0 for the diamagnetic sample, and σ(Idia) is the noise standard deviation. The relationship between Idia(0) and Ipara(0) was assumed to be given by Eq. 7.
Expression and purification of SRY was carried out as described by Murphy et al. (29). Samples of the complexes chelating Mn2+ or Ca2+ were prepared as described (19,20). Data were recorded on 0.3 mM complex dissolved in 10 mM Tris•HCl (pH 6.8), 20 mM NaCl and 7% D2O.
Expression and purification of HPr (E32C) and the conjugation reaction with N-[S-(2-pyridylthio)cysteaminyl]ethylene-diamine-N,N,N′N′-teatracetic acid (Toronto Research Chemicals) were carried out as described (28). The final conjugated HPr(E32C)-EDTA-Mn2+ or -EDTA-Ca2+ samples were further purified by Mono-Q anion-exchange chromatography. NMR data on the paramagnetic (Mn2+) and diamagnetic (Ca2+) states were recorded using 0.3 mM protein dissolved in 10 mM Tris•HCl (pH 7.4) and 5% D2O.
The chemical shifts for the Mn2+- and Ca2+-chelated states of the SRY/DNA complex are identical, indicating that pseudo-contact shifts are negligible and, therefore, the electronic g-tensor for the unpaired electrons of Mn2+ is indeed isotropic. An isotropic g-tensor for the unpaired electrons of Mn2+ in EDTA-Mn2+ conjugated to either DNA or protein was also found in previous studies, including systems ranging from 20 to 50 kDa (10,19,23-28).
2.2 NMR measurements
Measurements of PRE 1HN-Γ2 rates were carried out using Bruker DMX-500, DRX-600 and DRX-800 spectrometers equipped with z-gradient triple resonance cryogenic probes. Identical T2 experiments were performed on two samples, one with Mn2+(paramagnetic) conjugated to EDTA and the other with Ca2+(diamagnetic). The 1H-Γ2 rates are given by the difference in 1H-R2 rates between the paramagnetic and diamagnetic samples. For PRE applications, we found that conventional NMR tubes were better in terms of shimming than Shigemi micro-tubes, presumably because the magnetic susceptibility of the paramagnetic sample is quite different from that for a micro-cell matched for H2O-based diamagnetic samples. The pulse sequence employed is given in Fig. 1. 1H-T2 measurements with multiple time-points were carried out in an interleaved manner. The recorded data were processed with the NMRPipe software (30). Shifted cosine bell window-functions were applied to both the 1H and 15N time-domains, followed by zero-filling and Fourier transformation. (Note, we found that the type of window function employed does not affect the R2 values obtained from multiple-time-point measurements). For the single-time-point approach, which requires Lorentzian line-shapes in the 1H dimension, an exponential window-function was applied instead. Peak heights were quantified with either the NMRView (31) or NMRDraw (30) software. PRE 1HN-Γ2 rates were determined from the peak heights for diamagnetic and paramagnetic samples (Idia and Ipara, respectively) as a function of the delay T (see Fig. 1) given by:
| [1] |
| [2] |
For two-time-point measurements, errors in Γ2 were estimated as described in the Results and Discussion. Otherwise, errors were estimated using a Monte-Carlo approach.
Fig. 1.

Pulse sequence for 1HN-Γ2 measurements. The delay T is changed for the relaxation measurement. Thin and bold bars indicate rectangular 90° and 180° pulses, respectively. Phases are along x unless indicated otherwise. Short bold bars represent soft rectangular 90° pulses (1.4 ms) selective for the 1H2O resonance. A half-bell shape for 1H represents a half-Gaussian 90° pulse selective for water (2.0 ms). Delays are as follows: τa = 2.7 ms; τb = 2.25 ms; δ = (length of 13C WURST pulse). Phase cycling: ϕ1=(y, y, −y, −y); ϕ2 = (x,−x); ϕ3 = (x,x,−x,−x,y,y,−y,−y); receiver=(x, −x, −x, x, −x, x, x, −x). The receiver phase and ϕ2 were incremented for States-TPPI quadrature detection in the t1 domain. Field gradients are optimized to minimize the solvent signal. Although 3JHN-Hα is active for non-deuterated proteins during the period T, the resulting modulation is cancelled out when Γ2 is calculated as described in the main text.
3. Results and Discussion
3.1 Experiment for Γ2 measurements
At high magnetic fields (1H frequency ≥ 500 MHz), the PRE rate, Γ2, arising from the dipole-dipole interaction between a nucleus and unpaired electrons with an isotropic g-tensor is given by (1,32):
| [3] |
where r is the distance between the paramagnetic center and the observed nucleus; μ0, the permeability of vacuum; γI, the nuclear gyromagnetic ratio; g, the electron g-factor; μB, the electron Bohr magneton; S, the electron spin quantum number; τc, the PRE correlation time defined as ; τr, the rotational correlation time; τs, the electron relaxation time; and ωH/2π, nuclear Larmor frequency . Although Eq. 3 is valid only for a system where the paramagnetic group is fixed within the molecular frame, the equation can be readily modified to deal with a system where the paramagnetic center is mobile as described in our previous paper (20).
In practice, Γ2 is measured as a difference in transverse relaxation rates between the paramagnetic (R2,para) and diamagnetic (R2,dia) states:
| [4] |
This subtraction cancels out all relaxation mechanisms common to both states, including exchange contributions to the transverse relaxation rate R2, such that the only remaining relaxation mechanism arises from electron-nucleus interactions. Fig. 1 shows the pulse sequence we have been using for 1H-Γ2 measurements (19,23,24,25,27), which is essentially the same as that proposed by Kay and co-workers (8). The period for the 1H transverse relaxation measurement is incorporated in the first INEPT scheme. During the 1H transverse period of T + 2τa, 15N 180 pulses swap the slow and fast relaxing components (represented by Hy - 2HyNz and Hy + 2HyNz, respectively) and the contributions from the two components are identical, making the overall decay a single-exponential process with an average relaxation rate. The observed relaxation rates correspond to 1/T2 for 1H in-phase terms, since the transverse relaxation rates for Hy and 2HxNz terms are expected to be virtually identical for macromolecules. (Note that T1 relaxation of Nz is much slower than 1H T2). Identical experiments are performed for the paramagnetic and diamagnetic samples to obtain Γ2.
3.2 Two-time-point experiment for measurement of Γ2 rates
A two-time-point measurement provides a simple means of obtaining Γ2 rates and their corresponding errors without making use of any fitting procedures. In this approach, 1H-Γ2 rates are determined from two time points (T = 0 and ΔT) for transverse relaxation using Eqs. 1 and 2 as follows:
| [5] |
where Idia and Ipara are the peak intensities for the diamagnetic and paramagnetic states, respectively. It should be noted that effects of homonuclear 3JHNHα-modulation during T are cancelled out by using identical times and taking ratios for the two states. The errors in Γ2 can be propagated from Eq. 5 and are given by:
| [6] |
where σdia and σpara are the standard deviations of the noise in the spectra recorded for the diamagnetic and paramagnetic states, respectively.
The two time-points should be chosen to minimize the errors in the Γ2 rates. Fig. 2 illustrates the theoretical relationship between ΔT and the error in Γ2, obtained using Eqs. 1, 2 and 6 together with the following equation:
| [7] |
where τ represents the overall 1H transverse period for the coherence transfers (9.9 ms). Eq. 7 assumes a Lorentzian line-shape in the 1H-dimension, equal recovery levels during the repetition delay, and the same concentration and number of scans for both the diamagnetic and paramagnetic samples. Under these conditions, the error σ(Γ2) is minimal when Ta = 0 and Tb ∼ 1.15/(R2,dia+Γ2). As can be seen from Fig. 2, the larger the value of Γ2, the narrower the optimal range of T. Therefore, the second time-point should be set to be optimal for a relatively large Γ2 expected for the system under study. For example, if the range of expected Γ2 rates is 0 to 75 s−1, a second time point at ∼1.15/(R2,dia+50) sec. represents a reasonable choice. (However, if diamagnetic contamination in the paramagnetic sample is greater than ∼3%, smaller values are required for accurate measurement of intramolecular Γ2 rates; see below).
To obtain reasonably precise data with errors smaller than ∼10% for Γ2 rates of ∼50 s−1, the number of accumulated scans per FID should typically be set to at least 32 for measurements using a cryogenic probe on a ∼0.3 mM paramagnetic sample of a non-deuterated ∼20 kDa protein or protein complex. Although the measurements could be somewhat time-consuming without a cryogenic probe, the sample concentration cannot be greatly increased beyond ∼0.5 mM, since undesired additional PRE effects arising from transient, random collisions (“solvent PRE” effect) may become significant at a higher concentrations (8).
3.3 Impact of increasing the number of time-points on the accuracy of Γ2 rates
Since one might expect that a large number of time points may yield superior quality Γ2 data, we investigated the impact of increasing the number of acquired time-points on the accuracy and precision of Γ2 measurements using a Monte-Carlo approach. 100 sets of synthetic data with random Gaussian noise were generated using Eqs. 1, 2 and 7. Non-linear least-squares fitting was then carried out for each dataset to obtain the standard deviation of the apparent Γ2 values. The results for 2, 4, 8 and 16 time-points were compared.
First, we simulated the case where the same number of accumulated scans is employed per time-point (Table I). Under these circumstances, the total length of data collection is proportional to the number of time-points. For each simulation, the noise standard deviation σI was set to 0.5% of Idia(0) in Eq. 1. The relaxation rate for the diamagnetic state was set to 50 s−1 and four values of the true Γ2 (10, 25, 50, and 75 s−1) were examined. As Table I shows, increasing the number of time-points without sacrificing the number of accumulated scans does indeed improve the precision in the Γ2 measurement. (Note in these calculations with synthetic data, precision and accuracy are equivalent).
Table I.
Impact of increasing time-points without reducing scan-accumulations on the precision of of Γ2 measurements.a
| R2,dia = 50 s−1 | ||||||
|---|---|---|---|---|---|---|
| n | Idia(0)/σI | ΔT | Γ2 = 10 s−1 σ(Γ2) | Γ2 = 25 s−1 σ(Γ2) | Γ2 = 50 s−1 σ(Γ2) | Γ2 = 75 s−1 σ(Γ2) |
| 2 | 200 | 0.012 | 1.54 | 2.35 | 4.99 | 10.60 |
| 4 | 200 | 0.004 | 1.33 | 1.93 | 3.68 | 6.87 |
| 8 | 200 | 0.002 | 0.99 | 1.43 | 2.73 | 5.13 |
| 16 | 200 | 0.001 | 0.71 | 1.02 | 1.96 | 3.72 |
Calculations were carried out using a Monte-Carlo approach with 100 synthetic datasets as described in the main text. Definitions of symbols are as follows: n, number of time-points; Idia(0), peak intensity at T=0 for the diamagnetic state; σI , noise standard deviation; ΔT, interval for linear sampling of T between 0 and (n-1) ΔT; σ(Γ2), standard deviation of calculated Γ2. The deviation of the calculated Γ2 from the true Γ2 was found to be almost same as σ(Γ2). Thus, for these calculations, precision and accuracy are essentially equivalent.
In practice, however, spectrometer access may be limited, in which case increasing the number of time points would entail a proportionate decrease in the number of accumulated scans per time point to keep the total measurement time the same. Interesting questions arise in this regard. Should one use many time-points sacrificing signal-to-noise (S/N) ratios for individual spectra? Or should one acquire high S/N ratio data with fewer time points? To examine this issue, we carried out a second set of Monte-Carlo simulations in which the number of accumulated scans per time point was assumed to be inversely proportional to the number of time-points (n), making the overall experiment length constant and Idia(0)/σI inversely proportional to √n . Table II shows the results of simulations using different Idia(0)/σI ratios but in other respects identical to the simulations reported in Table I. Under these conditions, the simulations reveal that increasing the number of time-points at a cost of a lower S/N ratio results in no gain in Γ2 precision. Therefore, a two-time-point Γ2 measurement with high S/N ratio represents a good choice in practice, since it requires neither fitting procedures nor complicated error estimations. This conclusion is confirmed experimentally by the excellent correlation between the measured Γ2 rates for the SRY-DNA complex using 2 and 8 time-points (Fig. 3).
Table II.
Impact of increasing time-points with reduced scan accumulations, keeping the overall measurement time constant, on the precision of Γ2 measurements.a
| R2,dia = 50 s−1 | ||||||
|---|---|---|---|---|---|---|
| n | Idia(0)/σI | ΔT | Γ2 = 10 s−1 σ(Γ2) | Γ2 = 25 s−1 σ(Γ2) | Γ2 = 50 s−1 σ(Γ2) | Γ2 = 75 s−1 σ(Γ2) |
| 2 | 200 | 0.012 | 1.54 | 2.35 | 4.99 | 10.60 |
| 4 | 141 | 0.004 | 1.89 | 2.74 | 5.23 | 9.78 |
| 8 | 100 | 0.002 | 1.98 | 2.86 | 5.48 | 10.33 |
| 16 | 71 | 0.001 | 1.99 | 2.86 | 5.53 | 10.54 |
Calculations were carried out in the same manner as for those in Table I, except that different values of Idia(0)/σI were employed to simulate a constant overall measurement time in all cases. For example, to acquire 8 points for T, the number of scans should be a fourth of that for a 2 time-point measurement, resulting in a reduction of 2 in S/N ratio. Definitions of symbols are as given in Table I.
Fig. 3.
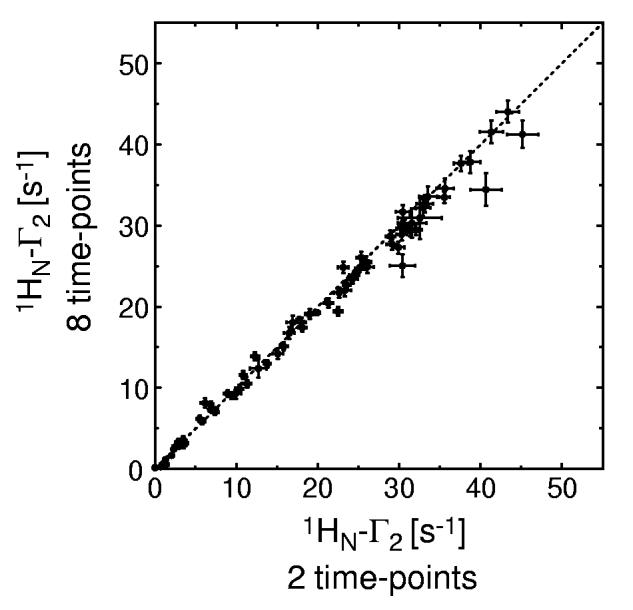
Correlation between experimentally determined 1HN-Γ2 rates derived from two (ΔT = 14 ms) and 8 time-point (ΔT = 2.8 ms) measurements for the 2H/15N-labeled SRY/DNA-EDTA-Mn2+ complex (0.3 mM). 64 scans per FID were acquired for the 2-time-point measurement and 16 scans per FID for the 8-time-point measurement, resulting in the same total measurement time (∼21 hours). Identical measurements were carried out for the paramagnetic (Mn2+) and diamagnetic (Ca2+) states. The data were measured at a 1H-frequency of 500 MHz.
3.4 Inaccuracies of the single-time-point approach for the measurement of Γ2 rates
Many studies in the literature have made use of a very simplistic approach in which only two regular HSQC spectra, one of the diamagnetic state and the other of the paramagnetic state at the same concentration, are employed to determine 1HN-Γ2 rates using Eq. 7. We refer to this method as the single-time-point approach. Eq.7, however, only holds true if the repetition delay is sufficiently long to ensure that magnetization recovery levels are identical for the diamagnetic and paramagnetic states. However, for conventional HSQC experiments on biological macromolecules, the repetition delay between the scans is generally set to 0.8-2.0 s, which is not sufficient for 100% recovery of 1H longitudinal magnetizations. Indeed, for a 2H-labeled protein, the amide 1H T1 relaxation time at regular magnetic fields (1H frequency of 500-800 MHz) is very long and a repetition delay longer than ∼20 s would be required to achieve 100% recovery for all amide 1H nuclei (33). With a shorter repetition delay, Trep, the recovery levels for the paramagnetic sample are always higher than those for the corresponding diamagnetic sample owing to the PRE on longitudinal relaxation rates (Γ1). When this effect is taken into account, Eq. 7 is modified to:
| [8] |
From the Solomon-Bloembergen equations, Γ1 can be calculated from Γ2 as follows:
| [9] |
where ωH/2π is the 1H frequency. Fig. 4 shows the theoretical relationship between the true Γ2 and the apparent Γ2 derived from the single-time-point approach using Eqs. 8 and 9. Depending on the PRE correlation time τc, the value of can be significantly smaller than the true Γ2 value, especially for deuterated molecules. In the case of the PRE arising from Mn2+ (where τs is much smaller than that for a nitroxide spin label), the single time-point approach only yields accurate Γ2 values when the repetition delay exceeds 4/R1,dia. The requirement of a long repetition delay makes the single-time-point approach less attractive, because multiple time-points can be acquired with a shorter delay and therefore a comparable overall experiment time. Another practical problem of the single time-point approach is that either an exponential window function or no window function at all must be employed for the 1H dimension since Eq. 7 assumes a Lorentzian line-shape. In practice, this type of data processing is suboptimal for relatively large systems because Lorentzian shapes are broad and hence significantly decrease the number of analyzable peaks owing to partial overlaps. In addition, the single time-point approach requires the use of an appropriate scaling factor to account for slight differences in sample concentrations while multiple time-point methods do not. For a small protein, enhanced relaxation rates and decreased peak intensities are observed for virtually all residues in the presence of a paramagnetic probe, making it difficult to scale the two spectra reliably. For these reasons, it is our view that the single time-point approach should be restricted to qualitative use, especially for deuterated proteins.
Fig. 4.

Theoretical relationship between the true Γ2 and the apparent Γ2 derived from the single-time-point approach at 1H-frequency of 600 MHz, illustrating the effect of neglecting different recovery levels for the paramagnetic and diamagnetic states on the accuracy of 1H-Γ2 rates derived using the single time-point approach. Two different values for the PRE correlation time τc were considered: τc = 4 ns (panels a and b) and τc = 10 ns (panels c and d). Those two τc values correspond to a ∼20-kDa molecule conjugated to EDTA-Mn2+ and a nitroxide spin label, respectively. Results for a non-deuterated protein (T2,dia = 20 ms and T1,dia = 0.8-1.2 s; panels a and c) and the corresponding deuterated protein (T2,dia = 40 ms and T1,dia = 2.4 – 4.8 s; panels b and d) are displayed separately. The repetition delays between scans (Trep) in the HSQC experiments (τ in Eq. 7 is 9.2 ms) were assumed to be 1.0 s for the non-deuterated sample and 2.0 s for the deuterated one.
3.5 Field-dependence of 1H-Γ2
In this section, we describe the field-dependence of 1H-Γ2. Since Γ2 for a macromolecule is dominated by the value of the spectral density function at zero frequency, 1H-Γ2 rates measured at high magnetic field (B0 > 10 Tesla) should be dependent on B0 if (a) the PRE correlation time τc is field-dependent, or (b) the contribution from Curie-spin relaxation (whose rate is proportional to B02) is non-negligible. According to Gueron (34), Γ2 due to the Curie-spin relaxation mechanism is given by:
| [10] |
where k is the Boltzman constant, and T the temperature in Kelvin (Sometimes the last two negative terms in Eq. 10 are neglected, but this is only valid when τs << τr). In the case of SRY/DNA-EDTA-Mn2+ complex, the rotational correlation time τr is 8.5 ns from the 15N relaxation data, and the PRE correlation time τc, derived from the PRE Γ1 and Γ2 data, is 4.5 ns (20). Thus, the electron relaxation time τs is calculated to be 9.6 ns (20). For this system, Eqs. 3 and 10 predict that the contribution of the Curie-spin relaxation mechanism to the overall Γ2 at 308 K is only 2%, even at a 1H-frequency of 800 MHz. The relative contribution of the Curie-spin relaxation depends on the size of the system. For a very large system with τr larger than 50 ns (corresponding to a molecular weight in excess of 100 kDa), the contribution could be larger than 20% at 800 MHz. In the case of a nitroxide spin label, the electron spin relaxation time τs (>10−7 s) is much longer than τr (35,36) and, therefore, the PRE correlation time τc, defined as (τr−1+τs−1)−1, is virtually identical to τr, resulting in a field-independent 1H-Γ2. For a macromolecular system with conjugated EDTA-Mn2+, on the other hand, τs is comparable to τr (10,19,20) and consequently 1H-Γ2 could be field-dependent because of the field-dependence of τs.
To examine the field-dependence of 1H-Γ2 arising from Mn2+, we measured 1HN-Γ2 rates for the 13C/15N-labeled SRY/DNA-EDTA-Mn2+ complex at 1H-frequencies of 500, 600 and 800 MHz. Fig. 5 shows the correlations between the Γ2 rates measured at the different fields. Linear regressions indicate that the 1H-Γ2 rates at 600 MHz and 800 MHz are higher than the corresponding rates at 500 MHz by factors of 1.02 and 1.08, respectively. (Note that these numbers are not precise because of experimental errors). The field dependence of 1H-Γ2 arising from Mn2+ is very weak in this magnetic field range (11.7-18.8 Tesla). This finding leads one to two conclusions. First, the contribution from Curie-spin relaxation is indeed negligible, which is consistent with the considerations described above. Second, the PRE correlation time τc is almost field-independent. Considering that the experimentally determined τc is smaller than the rotational correlation time τr, this suggests a very weak field-dependence for the electron relaxation time τs of Mn2+ at high magnetic field (>10 Tesla) in contrast to the strong field dependence observed at low (< 3 Tesla) magnetic field (37).
Fig. 5.
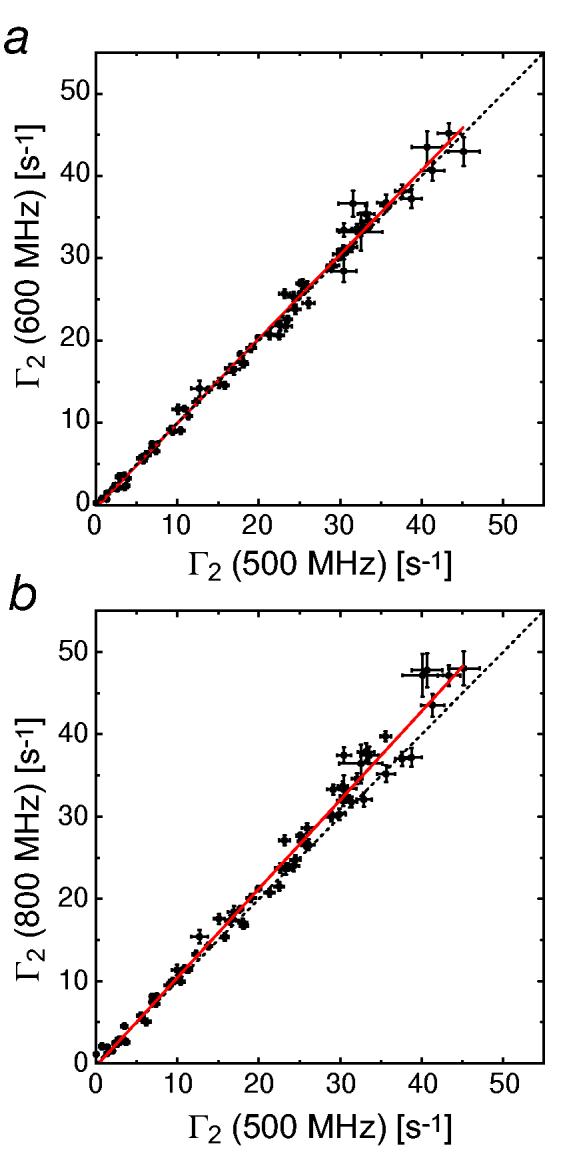
Experimental field-dependence of 1HN-Γ2 measured for the 2H/15N-labeled SRY/DNA-EDTA-Mn2+ complex (0.3 mM) at 500 MHz, 600 MHz, 800 MHz. (a) Correlation between 1HN-Γ2 rates determined at 500 MHz and 600 MHz. (b) Correlation between 1HN-Γ2 rates determined at 500 MHz and 800 MHz. The dotted lines are diagonals. Red solid lines represent linear regressions. Slopes for a and b are 1.024 and 1.078, respectively. 64, 40, and 32 scans per FID were acquired for the data recorded at 500 MHz, 600 MHz and 800 MHz, respectively.
Until recently, it was thought that the electron relaxation time τs for Mn2+ is dominated by collisional modulation of the zero-field-splitting (ZFS) tensor, arising from distortion of a metal coordination system by collision with solvent molecules (37,38). In this instance, τs should be proportional to B02 at high magnetic fields that satisfy the condition ωsτν >> 1, where ωs/2π is the electron Larmor frequency and τν the correlation time for collisional modulation of the ZFS tensor (usually on the order of 10−11 s). If this were the case, the ratio of the 800 MHz to 500 MHz 1H-Γ2 rates should be 1.52 for the SRY/DNA-EDTA-Mn2+ complex whose rotational correlation time τc is 8.5 ns. Hence, this mechanism clearly does not explain our experimental observations.
Recently, Miller and Sharp pointed out that other contributions to the electron relaxation time τs need to be taken into account and that τs for a Mn2+ system is actually given by (39):
| [11] |
The first term, , is due to collisional modulation of the ZFS tensor, which was discussed above. The second term, , is the reorientational modulation of the ZFS tensor, but its contribution is negligible for a macromolecule. The third term, , is for electron relaxation due to vibrational modulation of the ZFS tensor, which is essentially field-independent. The contribution of to the overall could be dominant at high-magnetic field since the first term is inverse-proportional to B02. In fact, the magnitude of the ZFS tensor and the τν value reported for EDTA-Mn2+ systems (40) predict a value 3×10⁶ s−1 for at 11.7 Tesla, which is significantly smaller than the experimentally measured value of 1.0×10⁹ s−1 for . Judging from our 1H-Γ2 data, it is likely that the field-independent term is dominant in overall electron relaxation at high magnetic fields between 11.7 and 18.1 Tesla, whereas is dominant at low magnetic fields.
3.6 Effect of diamagnetic contamination on 1H-Γ2
In practice, no matter how carefully a paramagnetic sample may be prepared, contamination by trace amounts (∼1-5%) of the corresponding diamagnetic species is almost impossible to avoid for the following reasons: (a) Incomplete conjugation of the extrinsic paramagnetic group and insufficient purification of the conjugated species; (b) the presence of diamagnetic impurities in the paramagnetic stock solution (e.g. trace amounts of diamagnetic metals such as Zn2+ and Ca2+ in stock solutions of Mn2+ for the EDTA-Mn2+ system; the reduced species for a nitroxide spin label); (c) chemical instability of the conjugated states (discussed in a later section). Thus, it is important to ascertain the impact of diamagnetic contamination on the measured 1H-Γ2 data.
Under conditions where the chemical shifts for the diamagnetic and paramagnetic states are identical and they do not exchange with each other, the signal intensity for the paramagnetic sample containing a trace amount of the diamagnetic species with population pd is given by:
| [12] |
Using Eqs. 1, 2, 5, 7 and 12, we calculated the theoretical relationship between the true value of 1H-Γ2 and the apparent value that would be obtained from a two-time-point measurement for two values of ΔT and diamagnetic contaminations ranging from 0 to 5% (Fig. 6). The apparent value Γ2 is always smaller than the true value. For the case with R2,dia = 50 s−1, Γ2 = 60 s−1 and pd = 2%, the apparent value of Γ2 from the two-time-point measurement with ΔT = 18 ms is 52 s−1. For pd = 5%, the apparent value of Γ2 is reduced to 44 s−1. Note that the percentage error in Γ2 is much larger than pd. This is due to the fact that the PRE significantly reduces the contribution of the first term in Eq. 12. The deviation from the true value of Γ2 can be reduced by using a relatively small value of ΔT, thereby reducing the relative contribution of the second term. For example, the apparent values of Γ2 obtained with ΔT = 6 ms are 55 s−1 for pd = 2% and 48 s−1 for pd = 5%.
Fig. 6.

Theoretical effect of contamination by an equivalent diamagnetic species in a paramagnetic sample on Γ2 accuracy. The relationship between the true values of Γ2 and the apparent values derived from two time-point measurements at different levels of diamagnetic contamination were computed using Eq. 1, 2, 5, 7 and 12 for ΔT values of (a) 6 ms and (b) 18 ms. The curves shown are for contaminant population pd of 0, 1, 2, 3 and 5% as indicated in the panels.
Fig. 7a shows correlations between experimental 1HN-Γ2 data measured with ΔT = 4 ms and 40 ms on 15N-HPr(E32C) conjugated with EDTA-Mn2+ at Cys32. As expected from the above considerations, the measured Γ2 values derived from the experiment with ΔT = 40 ms are systematically smaller than those obtained with ΔT = 4 ms, indicating the presence of a diamagnetic impurity. From this correlation, pd was estimated to be 3%. The same population for the diamagnetic impurity can also obtained from the intensities of residual peaks that should be completely broadened beyond detection, yet appear with low intensity because of the diamagnetic contamination (Fig. 7b).
Fig. 7.

Experimental manifestations of diamagnetic contamination. (a) Correlation between experimentally determined Γ2 values measured for 15N-labeled HPr(E32C)-EDTA-Mn2+ using the two time-point approach with ΔT values of 4 and 40 ms (red solid circles with the error bars representing measurement precision). Also shown are the theoretical correlations between apparent Γ2 values calculated for HPr (assuming a Lorenzian lineshape and a diamagnetic 1H-R2 rate of 25 s−1) with ΔT values of 4 and 40 ms in the presence of 3% (blue line) and 5% (green line) diamagnetic species contamination. (b) Comparison of cross-peak intensities of Thr-34 in the diamagnetic (black line) and paramagnetic (red line) states. The right-hand panel is plotted a ten times the magnification level of the left-hand panel. The peak intensity of the paramagnetic state measured for HPr(E32C)-Cys-EDTA-Mn2+ is ∼3.5% of that in the diamagnetic control. As the amide proton of Thr-34 is in close proximity to the paramagnetic center (< 8 Å), the peak should be broadened beyond detection in the paramagnetic state in the complete absence of diamagnetic contamination.
In the case of intermolecular PRE measurements on a complex where dissociation and association processes are in fast exchange on the relaxation time scale, the observed Γ2 is simply scaled down by 1-pd and the effect of a diamagnetic impurity is much weaker than for the intramolecular case considered above.
3.7 Considerations of sample stability for 1H-Γ2 measurements
Since a relatively small percentage of diamagnetic contamination can affect 1H-Γ2, another concern is the stability of the paramagnetic sample itself. In the case of EDTA-conjugation to proteins, disulfide bond linkage to a Cys side-chain is commonly used (9,41-43). As the reaction is reversible, the conversion rate cannot be 100% and there is always a small percentage of unconverted diamagnetic species. Although the desired product after the conjugation reaction can be purified by ion-exchange chromatography (28) or organic mercury columns (5), undesired cross- linked protein dimer, which is diamagnetic, is gradually formed via disulfide exchange. We have found that for a 6-month old sample comprising a cysteaminyl-EDTA-Mn2+ conjugate of 15N-labeled HPr(E32C), the dimer population can be as high as 30%, as confirmed by electrophoresis and mass spectrometry (data not shown). Therefore, a freshly prepared sample should always be used for the measurement of PREs arising from Cys-EDTA-Mn2+. Alternatively, different chemistry can be used for conjugation of the paramagnetic group. For example, both maleimide (44) and iodide (5, 45) functional groups selectively and irreversibly react with a free sulfhydryl group under mild conditions, enabling the paramagnetic center to be linked to the protein via a stable C-S bond.
On the other hand, we found no evidence of this problem for EDTA-derivatized DNA, presumably because the EDTA group is conjugated through a stable linker without a disulfide bond (19,46). The SRY/DNA complex containing dT-EDTA-Mn2+ exhibited the same 1HN-Γ2 values within experimental errors even 2 years after the first measurement (data not shown).
4. Concluding Remarks
In this paper, we have described various practical aspects of 1H-Γ2 measurements at high magnetic fields (1H frequency ≥500 MHz) as applied to macromolecules (proteins, nucleic acids, and their complexes). We show that the two-time-point measurement approach provides a simple means to accurately measure 1H-Γ2 without requiring any fitting procedures or complicated error estimations. Optimal settings required to minimize the experimental errors are also discussed. Increasing time-points while sacrificing S/N ratio for individual spectra to complete the measurement within a given timeframe does not result in any improvement in the precision or accuracy of the Γ2 rates. The single-time-point approach, on the other hand, which has been extensively used in the literature, yields inaccurate Γ2 rates unless the magnetization recovery levels for the diamagnetic and paramagnetic samples are identical. The 1H-Γ2 rates arising from conjugated EDTA-Mn2+ are found to be virtually field-independent for a 20 kDa system at high magnetic field (B0 > 11 Tesla). This is relevant when experiments are carried out in a research environment with multiple NMR spectrometers operating at different magnetic fields. Finally, PRE measurements involving conjugation of the paramagnetic center via a labile disulfide bond should be carried out immediately after sample preparation since trace amounts of the diamagnetic species can cause significant underestimation of Γ2 rates.
The PRE arising from unpaired electrons with an isotropic g-tensor located on EDTA-Mn2+ or a nitroxide free radical conjugated via a flexible linker to the macromolecule of interest probably represents the only practical tool in paramagnetic NMR to characterize macromolecules that do not possess an intrinsic metal binding site or paramagnetic center. Although other observables, such as pseudo-contact shifts and cross-correlation involving the Curie-spin relaxation, arising from unpaired electrons with an anisotropic g-tensor have been shown to be useful for the investigation of metal-binding proteins (2,47-51), similar applications to macromolecules with an extrinsic paramagnetic group tend to problematic owing to various practical considerations (e.g. the presence of enantiomers in the EDTA coordination system and linker flexibility; cf. refs. 10 and 52). In conclusion, PRE measurements afford a wealth of highly valuable information related to both structure and dynamics of biological macromolecules (5-28), and the practical considerations described in this paper are important for optimal experimental design and data interpretation in such investigations.
Acknowledgments
This work was supported by funds from the Intramural Program of the NIH, NIDDK and in part by the AIDS Targeted Antiviral program of the Office of the Director of the NIH (to G.M.C.).
Footnotes
Publisher's Disclaimer: This is a PDF file of an unedited manuscript that has been accepted for publication. As a service to our customers we are providing this early version of the manuscript. The manuscript will undergo copyediting, typesetting, and review of the resulting proof before it is published in its final citable form. Please note that during the production process errors may be discovered which could affect the content, and all legal disclaimers that apply to the journal pertain.
References
- 1.Solomon I. Relaxation processes in a system of two spins. Phys. Rev. 1955;99:559–565. [Google Scholar]
- 2.Boisbouvier J, Gans P, Blackledge M, Brutscher B, Marion D. Long-range structural information in NMR studies of paramagnetic molecules from electron spin-nuclear spin cross-correlated relaxation. J. Am. Chem. Soc. 1999;121:7700–7701. [Google Scholar]
- 3.Pintacuda G, Kaikkonen A, Otting G. Modulation of the distance dependence of paramagnetic relaxation enhancements by CSA×DSA cross relaxation. J. Magn. Reson. 2005;171:233–243. doi: 10.1016/j.jmr.2004.08.019. [DOI] [PubMed] [Google Scholar]
- 4.Kosen PA. Spin labeling of proteins. Methods Enzymol. 1989;177:86–121. doi: 10.1016/0076-6879(89)77007-5. [DOI] [PubMed] [Google Scholar]
- 5.Gillespie JR, Shortle D. Characterization of long-range structure in the denatured state of staphylococcal nuclease. I. Paramagnetic relaxation enhancement by nitroxide spin labels. J. Mol. Biol. 1997;268:158–169. doi: 10.1006/jmbi.1997.0954. [DOI] [PubMed] [Google Scholar]
- 6.Battiste JL, Wagner G. Utilization of site-directed spin-labeling and high-resolution heteronuclear nuclear magnetic resonances for global fold determination of large proteins with limited nuclear Overhauser effect data. Biochemistry. 2000;39:5355–5365. doi: 10.1021/bi000060h. [DOI] [PubMed] [Google Scholar]
- 7.Gaponenko V, Howarth JW, Columbus L, Gasmi-Seabrook G, Yuan J, Hubbell WL, Rosevear PR. Protein global fold determination using site-directed spin and isotope labeling. Protein Sci. 2000;9:302–9. doi: 10.1110/ps.9.2.302. [DOI] [PMC free article] [PubMed] [Google Scholar]
- 8.Donaldson LW, Skrynnikov NR, Choy WY, Muhandiram DR, Sarkar B, Forman-Kay JD, Kay LE. Structural characterization of proteins with an attached ATCUN motif by paramagnetic relaxation enhancement NMR spectroscopy. J. Am. Chem. Soc. 2001;123:9843–9847. doi: 10.1021/ja011241p. [DOI] [PubMed] [Google Scholar]
- 9.Dvoretsky A, Gaponenko V, Rosevear PR. Derivation of structural restraints using a thiol-reactive chelator. FEBS Lett. 2002;528:189–192. doi: 10.1016/s0014-5793(02)03297-0. [DOI] [PubMed] [Google Scholar]
- 10.Pintacuda G, Moshref A, Leonchiks A, Sharipo A, Otting G. Site-specific labelling with a metal chelator for protein-structure refinement. J. Biomol. NMR. 2004;29:351–61. doi: 10.1023/B:JNMR.0000032610.17058.fe. [DOI] [PubMed] [Google Scholar]
- 11.Mahoney NM, Rastogi VK, Cahill SM, Girvin ME, Almo SC. Binding orientation of proline-rich peptides in solution: Polarity of the profilin-ligand interaction. J. Am. Chem. Soc. 2000;122:7851–7852. [Google Scholar]
- 12.Mal TK, Ikura M, Kay LE. The ATCUN domain as a probe of intermolecular interactions: application to calmodulin-peptide complexes. J. Am. Chem. Soc. 2002;124:14002–14003. doi: 10.1021/ja028109p. [DOI] [PubMed] [Google Scholar]
- 13.Gross JD, Moerke NJ, von der Haar T, Lugovskoy AA, Sachs AB, McCarthy JE, Wagner G. Ribosome loading onto the mRNA cap is driven by conformational coupling between eIF4G and eIF4E. Cell. 2003;115:739–50. doi: 10.1016/s0092-8674(03)00975-9. [DOI] [PubMed] [Google Scholar]
- 14.Card PB, Erbel PJA, Gardner KH. Structural basis of ARNT PAS-B dimerization: use of a common beta-sheet interface for hetero- and homodimerization. J. Mol. Biol. 2005;353:664–677. doi: 10.1016/j.jmb.2005.08.043. [DOI] [PubMed] [Google Scholar]
- 15.Jain NU, Venot A, Umemoto K, Leffler H, Prestegard JH. Distance mapping of protein-binding sites using spin-labeled oligosaccharide ligands. Protein Sci. 2001;10:2393–2400. doi: 10.1110/ps.17401. [DOI] [PMC free article] [PubMed] [Google Scholar]
- 16.Johnson PE, Brun E, MacKenzie LF, Withers SG, McIntosh LP. The cellulose-binding domains from Cellulomonas fimi β-1,4-glucanase CenC bind nitroxide spin-labeled cellooligosaccharides in multiple orientations. J. Mol. Biol. 1999;287:609–625. doi: 10.1006/jmbi.1999.2627. [DOI] [PubMed] [Google Scholar]
- 17.Ramos A, Varani G. A new method to detect long-range protein-RNA contacts: NMR detection of electron-proton relaxation induced by nitroxide spin-labeled RNA. J. Am. Chem. Soc. 1998;120:10992–10993. [Google Scholar]
- 18.Varani L, Gunderson SI, Mattaj IW, Kay LE, Neuhaus D, Varani G. The NMR structure of the 38 kDa U1A protein - PIE RNA complex reveals the basis of cooperativity in regulation of polyadenylation by human U1A protein. Nat. Struct. Biol. 2000;7:329–335. doi: 10.1038/74101. [DOI] [PubMed] [Google Scholar]
- 19.Iwahara J, Anderson DE, Murphy EC, Clore GM. EDTA-derivatized deoxythymidine as a tool for rapid determination of protein binding polarity to DNA by intermolecular paramagnetic relaxation enhancement. J, Am, Chem, Soc. 2003;125:6634–6635. doi: 10.1021/ja034488q. [DOI] [PubMed] [Google Scholar]
- 20.Iwahara J, Schwieters CD, Clore GM. Ensemble approach for NMR structure refinement against 1H paramagnetic relaxation enhancement data arising from a flexible paramagnetic group attached to a macromolecule. J. Am. Chem. Soc. 2004;126:5879–5896. doi: 10.1021/ja031580d. [DOI] [PubMed] [Google Scholar]
- 21.Ueda T, Kato A, Ogawa Y, Torizawa T, Kuramitsu S, Iwai S, Terasawa H, Shimada I. NMR study of repair mechanism of DNA photolyase by FAD-induced paramagnetic relaxation enhancement. J. Biol. Chem. 2004;279:52574–52579. doi: 10.1074/jbc.M409942200. [DOI] [PubMed] [Google Scholar]
- 22.Roosild TP, Greenwald J, Vega M, Castronovo S, Riek R, Choe S. NMR structure of Mistic, a membrane-integrating protein for membrane protein expression. Science. 2005;307:1317–1321. doi: 10.1126/science.1106392. [DOI] [PubMed] [Google Scholar]
- 23.Liang B, Bushweller JH, Tamm LK. Site-directed parallel spin-labeling and paramagnetic relaxation enhancement in structure determination of membrane proteins by solution NMR spectroscopy. J. Am. Chem. Soc. 2006;128:4389–4397. doi: 10.1021/ja0574825. [DOI] [PMC free article] [PubMed] [Google Scholar]
- 24.Iwahara J, Schwieters CD, Clore GM. Characterization of nonspecific protein-DNA interactions by 1H paramagnetic relaxation enhancement. J. Am. Chem. Soc. 2004;126:12800–12808. doi: 10.1021/ja046246b. [DOI] [PubMed] [Google Scholar]
- 25.Iwahara J, Zweckstetter M, Clore GM. NMR structural and kinetic characterization of a homeodomain diffusing and hopping on non-specific DNA (2006) Proc. Natl. Acad. Sci. U.S.A. 2006;103:10562–10567. doi: 10.1073/pnas.0605868103. [DOI] [PMC free article] [PubMed] [Google Scholar]
- 26.Baker KA, Hilty C, Peti W, Prince A, Pfaffinger PJ, Wider G, Wüthrich K, Choe S. NMR-derived dynamic aspects of N-type inactivation of a Kv channel suggest a transient interaction with the T1 domain. Biochemistry. 2006;45:1663–1672. doi: 10.1021/bi0516430. [DOI] [PMC free article] [PubMed] [Google Scholar]
- 27.Iwahara J, Clore GM. Detecting transient intermediates in macromolecular binding by paramagnetic NMR. Nature. 2006;440:1227–1230. doi: 10.1038/nature04673. [DOI] [PubMed] [Google Scholar]
- 28.Tang C, Iwahara J, Clore GM. Visualization of transient encounter complexes in protein-protein association. Nature. 2006 doi: 10.1038/nature05201. in press. epub ahead of publication doi:10.1038/nature05201. [DOI] [PubMed] [Google Scholar]
- 29.Murphy EC, Zhurkin VB, Louis JM, Cornilescu G, Clore GM. Structural basis for SRY-dependent 46-X,Y sex reversal: modulation of DNA bending by a naturally occuring point mutation. J. Mol. Biol. 2001;312:481–499. doi: 10.1006/jmbi.2001.4977. [DOI] [PubMed] [Google Scholar]
- 30.Delaglio F, Grzesiek S, Vuister GW, Zhu G, Pfeifer J, Bax A. NMRPipe: a multidimensional spectral processing system based on UNIX pipes. J Biomol. NMR. 1995;6:277–293. doi: 10.1007/BF00197809. [DOI] [PubMed] [Google Scholar]
- 31.Johnson BA, Blevins RA. NMRView - A computer-program for the visualization and analysis of NMR data. J. Biomol. NMR. 1994;4:603–614. doi: 10.1007/BF00404272. [DOI] [PubMed] [Google Scholar]
- 32.Bloembergen N, Morgan LO. Proton relaxation times in paramagnetic solutions. Effects of election spin relaxation. J. Chem. Phys. 1961;34:842–850. [Google Scholar]
- 33.Ulmer TS, Campbell ID, Boyd J. Amide proton relaxation measurements employing a highly deuterated protein. J. Magn. Reson. 2004;166:190–201. doi: 10.1016/j.jmr.2003.10.012. [DOI] [PubMed] [Google Scholar]
- 34.Gueron M. Nuclear relaxation in macromolecules by paramagnetic ions: a novel mechanism. J. Magn. Reson. 1975;19:58–66. [Google Scholar]
- 35.Wien RW, Morrisett JD, McConnell HM. Spin-label-induced nuclear relaxation. Distances between bound saccharides, histidine-15, and tryptophan-123 on lysozyme in solution. Biochemistry. 1972;11:3707–3716. doi: 10.1021/bi00770a008. [DOI] [PubMed] [Google Scholar]
- 36.Thomas DD, Dalton LR, Hyde JS. Rotational diffusion studied by saturation transfer electron paramagnetic resonance. J. Chem. Phys. 1976;65:3006–3034. [Google Scholar]
- 37.Rubinstein M, Baram A, Luz Z. Electronic and nuclear relaxation in solutions of transition metal ions with spin S=3/2 and 5/2. Mol. Phys. 1971;20:67–80. [Google Scholar]
- 38.Bertini I, Luchinat C, Aime S. NMR of paramagnetic substances: Chapter 3 Relaxation. Coodin. Chem. Rev. 1996;150:77–110. [Google Scholar]
- 39.Miller JC, Sharp RR. Paramagnetic NMR relaxation enhancement: Spin dynamics simulations of the effect of zero-field splitting interactions for S = 5/2. J. Phys. Chem. A. 2000;104:4889–4895. [Google Scholar]
- 40.Kruk D, Kowalewski J. Field-dependent proton ralaxation in aqueous solutions of some manganese(II) complexes: a new interpretation. J. Biol. Inorg. Chem. 2003;8:512–518. doi: 10.1007/s00775-003-0444-9. [DOI] [PubMed] [Google Scholar]
- 41.Bruice TW, Kenyon GL. Novel alkyl alkanethiolsulfonate sulfhydryl reagents. Modification of derivatives of l-cysteine. J. Protein Chem. 1982;1:47–58. [Google Scholar]
- 42.Ermacora MR, Delfino JM, Cuenoud B, Schepartz A, Fox RO. Conformation-dependent cleavage of staphylococcal nuclease with a disulfide-linked iron chelate. Proc. Natl. Acad. Sci. U.S.A. 1992;89:6383–6387. doi: 10.1073/pnas.89.14.6383. [DOI] [PMC free article] [PubMed] [Google Scholar]
- 43.Ebright YW, Chen Y, Pendergrast PS, Ebright RH. Incorporation of an EDTA-metal complex at a rationally selected site within a protein: application to EDTA-iron DNA affinity cleaving with catabolite gene activator protein (CAP) and Cro. Biochemistry. 1992;31:10664–10670. doi: 10.1021/bi00159a004. [DOI] [PubMed] [Google Scholar]
- 44.Griffith OH, McConnell HM. A nitroxide-maleimide spin label. Proc. Natl. Acad. Sci. U.S.A. 1996;55:8–11. doi: 10.1073/pnas.55.1.8. [DOI] [PMC free article] [PubMed] [Google Scholar]
- 45.Ogawa S, McConnell HM. Spin-label study of hemoglobin conformations in solution. Proc. Natl. Acad. Sci. U.S.A. 1967;58:19–26. doi: 10.1073/pnas.58.1.19. [DOI] [PMC free article] [PubMed] [Google Scholar]
- 46.Dreyer GB, Dervan PB. Sequence-specific cleavage of single-stranded DNA: oligodeoxynucleotide-EDTA X Fe(II) Proc. Natl. Acad. Sci. USA. 1985;82:968–972. doi: 10.1073/pnas.82.4.968. [DOI] [PMC free article] [PubMed] [Google Scholar]
- 47.Ubbink M, Ejdeback M, Karlsson BG, Bendall DS. The structure of the complex of plastocyanin and cytochrome f, determined by paramagnetic NMR and restrained rigid-body molecular dynamics. Structure. 1998;6:323–335. doi: 10.1016/s0969-2126(98)00035-5. [DOI] [PubMed] [Google Scholar]
- 48.Allegrozzi M, Bertini I, Janik MBL, Lee Y-M, Liu G, Luchinat C. Lanthanide-induced pseudocontact shifts for solution structure refinements of macromolecules in shells up to 40 Å from metal ion. J. Am. Chem. Soc. 2000;122:4154–4161. [Google Scholar]
- 49.Barbier R, Bertini I, Cavallaro G, Lee YM, Luchinat C, Rosato A. Paramagnetically induced residual dipolar couplings for solution structure determination of lanthanide binding proteins. J Am Chem Soc. 2002;124:5581–7. doi: 10.1021/ja025528d. [DOI] [PubMed] [Google Scholar]
- 50.Babini E, Bertini I, Capozzi F, Felli IC, Lelli M, Luchinat C. Direct carbon detection in paramagnetic metalloproteins to further exploit pseudocontact shift restraints. J Am Chem Soc. 2004;126:10496–10497. doi: 10.1021/ja047573m. [DOI] [PubMed] [Google Scholar]
- 51.Pintacuda G, Park AY, Keniry MA, Dixon NE, Otting G. Lanthanide labeling offers fast NMR approach to 3D structure determinations of protein-protein complexes. J Am Chem Soc. 2006;128:3696–3702. doi: 10.1021/ja057008z. [DOI] [PubMed] [Google Scholar]
- 52.Ikegami T, Verdier L, Sakhaii P, Grimme S, Pescatore B, Saxena K, Fiebig KM, Griesinger C. Novel techniques for weak alignment of proteins in solution using chemical tags coordinating lanthanide ions. J Biomol NMR. 2004;29:339–349. doi: 10.1023/B:JNMR.0000032611.72827.de. [DOI] [PubMed] [Google Scholar]