

Abstract
There have been three main ideas about the basic law of psychophysics. In 1860, Fechner used Weber’s law to infer that the subjective sense of intensity is related to the physical intensity of a stimulus by a logarithmic function (the Weber-Fechner law). A hundred years later, Stevens refuted Fechner’s law by showing that direct reports of subjective intensity are related to the physical intensity of stimuli by a power law. MacKay soon showed, however, that the logarithmic and power laws are indistinguishable without examining the underlying neural mechanisms. Mountcastle and his colleagues did so, and, on the basis of transducer functions obeying power laws, inferred that subjective intensity must be related linearly to the neural coding measure on which it is based. In this review, we discuss these issues and we review a series of studies aimed at the neural mechanisms of a very complex form of subjective experience—the experience of roughness produced by a textured surface. The results, which are independent of any assumptions about the form of the psychophysical law, support the idea that the basic law of psychophysics is linearity between subjective experience and the neural activity on which it is based.
Keywords: Texture, Neural coding, Psychophysics, Touch, Neurophysiology, Somatosensory
Most studies that correlate psychophysics and neurophysiology are aimed at the neural mechanisms of detection or discrimination behavior. Decision theory provides a rigorous framework for the investigation of neural coding in this case. The issues are quite different when the objective is to determine the neural mechanisms underlying subjective behavior (e.g., a verbal report of the loudness or brightness of a stimulus). First, we review the history of ideas about the basic psychophysical laws governing subjective intensity. The discussion begins with the Weber-Fechner law, which was advanced in the 1860s, and ends with Mountcastle’s idea of linearity as the basic law of psychophysics, which was advanced in the 1960s. We next examine the analytical issues that arise in studies of the neural mechanisms underlying subjective intensity. We conclude that, just as statistical decision theory provides the appropriate analytical framework when studying the neural mechanisms of detection or discrimination, multivariate regression theory provides the appropriate framework for the study of neural coding when the behavior is subjective. We analyze the steps between a stimulus and the subjective response to it, and we argue that the appropriate test of a neural coding hypothesis is consistency. If there is no consistent relationship between a putative neural coding measure and subjects’ reports, then the hypothesis can be rejected; if there is a consistent relationship, it emerges directly in the consistency test whatever it might be (linearity, a logarithmic law, a power law, . . .). We review a series of studies that have used the consistency test to examine the neural coding mechanisms underlying tactile texture perception. The studies eliminate all but a single hypothesis, but, more relevant for the main point of this review, the relationship that emerges is linearity. We end with our conclusions concerning the basic law of psychophysics.
A major component of consciousness is a subjective internal world constructed by our sensory systems. It was Fechner’s idea that through experimentation we can map this internal world just as we use experimentation to map the external world. The original psychophysical law, the relationship between physical and subjective intensity, was proposed by Fechner (1860), who showed that internal, intensive scales can be reconstructed if there is 1) a relationship between just noticeable differences (JNDs) and increments in subjective intensity and 2) a relationship between JNDs and the physical properties of a stimulus. To make this concrete, Fechner assumed that JNDs correspond to equal increments in subjective intensity and that JNDs are proportional to the physical variable being studied (Weber’s law). These assumptions led to the famous, logarithmic Weber-Fechner law of subjective intensity—that is, the assertion that our internal subjective sense of magnitude is proportional to the logarithm of stimulus intensity. The fact that Weber’s law (JNDs are proportional to stimulus intensity) is often not valid is not a weakness of Fechner’s formulation; Fechner’s mathematical formulation applies as readily to a more complex JND dependence on stimulus intensity as to Weber’s law. The weakness of Fechner’s formulation is that there is no known relationship between the size of a JND and the rate of growth of subjective magnitude; in fact, there is evidence that there is no consistent relationship (Johnson and others 1993; Schroder and others 1994).
Fechner’s formulation persisted for a hundred years until Stevens (1957) showed that, when subjects are asked to report their sense of subjective intensity, either directly, by numerical report, or indirectly, by selecting an equivalent intensity in another modality, the relationships are described more effectively by power functions than by logarithmic functions. In a famous article “To honor Fechner and repeal his law,” Stevens suggested that the basic law relating subjective magnitude to physical intensity is a power law (Stevens 1961b).
Almost immediately, MacKay (1963) showed that we cannot distinguish the two laws without examining the underlying mechanisms because magnitude estimation and cross-modality matching yield a power law even if the relationship between physical and subjective intensity is logarithmic. MacKay showed that if our subjective sense of magnitude is related to the physical stimulus by a logarithmic law and if our subjective sense of numbers is logarithmic, then when we select a number to match our internal, subjective sense of intensity, the number will be related to the stimulus by a power law. The more profound implication of MacKay’s demonstration is that any of a near-infinite number of “laws” could account for Stevens’s power laws and that we cannot distinguish between them without examining the internal mechanism itself. There is evidence that both Fechner and Stevens understood this.
Stevens attributed the wide range of power law exponents observed in his psychophysical experiments to differences in transducer functions between sensory systems (Stevens 1961a); as evidence that the transducer function is critical, he showed that the power function evoked by stimulating the acoustic nerve electrically is very different from the function relating loudness to sound intensity. On the basis of direct observation of power law relations between impulse rates in single neurons and physical intensity, Mountcastle and his colleagues proposed that subjective intensity is linearly related to the neural signal on which it depends (Mountcastle and others 1963; Werner and Mountcastle 1965): “The implication [of matching neural and psychophysical power-law exponents] is, we believe, that the neural transforms intervening between input and the final verbal description of an introspective magnitude estimation must be linear for the intensive continuum. This does not imply, of course, that the intervening neural transforms must all be linear, but that the sum of their serial superpositions must be so” (Werner and Mountcastle 1965, p. 391). Stevens did not explicitly adopt the idea of linearity, but he surveyed and highlighted correspondences between primary sensory neural responses and the power law (Stevens 1970, 1975). His purpose was to refute challenges to the power law, but it implies his acceptance of the idea of linearity. A weakness of those comparisons is that none of the neural responses whose exponents were being compared with psychophysical exponents had been established as the basis of subjective intensity. Furthermore, subjective intensity is based on the response of a population of neurons, not on the responses of a single neuron, and the population response is not, in general, linked to the responses of single neurons in any simple way (Johnson 1974; Vega-Bermudez and Johnson 1999). Nonetheless, it is the idea that is important.
The issue of linearity arose again recently when it emerged unexpectedly in a series of combined psychophysical and neurophysiological studies of the neural mechanisms of tactile texture perception (Connor and others 1990; Connor and Johnson 1992; Johnson and Hsiao 1994; Blake and others 1997a;Yoshioka and others 2001). The studies were explicitly designed to be free of assumptions about psychophysical laws. In psychophysical experiments, subjects scanned textured surfaces with their fingers and responded with numerical estimates of their subjective sense of roughness. In neurophysiological experiments, the same surfaces were scanned across the fingers of monkeys (and in some cases humans) while recording the responses of mechanoreceptive afferents. The object of the neurophysiological experiments was to obtain a statistically accurate estimate of the population response. A wide range of hypotheses encompassing spatial, temporal, and intensive neural coding mechanisms was tested. Human skin is innervated by four types of mechanoreceptors. There are, therefore, 12 types of coding measures (3 types of coding mechanisms for each of the 4 mechano-receptor types) if the possibility of interactions between groups is ignored—and more if interactions are allowed. One or more hypotheses of each of these 12 types were tested. An example of a hypothesis that was tested is that the subjective sense of roughness depends on the mean firing rates of RA (Meissner) afferents, which is an intensive coding measure. The test of each hypothesis was consistency. The subjects’ average numerical response, r, to each surface was plotted against the neural coding measure, c, evoked by the same surface. The hypothetical coding measure, c, was rejected as the basis for the subjective roughness judgments only when there was no consistent relationship between c and r (i.e., only when widely different psychophysical responses r corresponded to a single neural measure, c). There is nothing about this test of consistency that requires a linear relationship between c and r; any relationship is acceptable (cannot be rejected) as long as it is consistent (a single value of r is associated with a single value of c).
Of the approximately 20 hypotheses that were tested, all but one were rejected on the basis of this consistency test. The single hypothesis that survived is that roughness perception depends on a specific measure of spatial variation in the SA1 (Merkel) afferent population response. The relationship between subjects’ responses, r, to 62 widely varying surfaces and this particular neural response measure, c, is highly consistent and linear. The linear correlation coefficient in every study was 0.97 or higher. Nothing about the analyses favored a linear relationship; it emerged when r and c were plotted against one another, as illustrated later. This provides strong support for linearity, not a logarithmic or power law, as the basic law of psychophysics.
The Neural Coding Problem
The aim in a neural coding study involving combined psychophysical and neurophysiological experiments is to determine the neural measure (the neural code) on which the psychophysical behavior depends. The psychophysical experiment provides a set of paired data (Si, ri) in which Si represent the ith stimulus and ri represent the subjects’ mean response to Si. The aim in the neurophysiological experiments is to obtain a statistically accurate estimate of the neural population response, Ni, evoked by each of the stimuli, Si, used in the psychophysical experiment. The desired result is the paired data set (Ni, ri) that provides a basis for investigating the neural basis of behavior.
The neural coding problem is equivalent to the general problem of multivariate regression—finding the relationship between a set of dependent, univariate data (ri) and the complex, multivariate data (Ni) on which they are thought to depend (Draper and Smith 1998):
| (1) |
Two important points follow directly from the principles of multivariate regression. The first is that when there are fewer data points than degrees of freedom in the independent data (Ni), there are many possible solutions (the problem is said to be underdetermined). Stated in neural terms, the neural population response evoked by any stimulus is complex and rich in coding possibilities. Consequently, the number of independent psychophysical response data, ri, are almost certain to be too small to eliminate all but a single solution. For example, the first study discussed below employed 18 stimuli and still the data allowed several valid solutions (i.e., several hypotheses that could not be rejected). The second point is that the data points, the Ni, should be as independent of one another as possible. Mathematically, the data, Ni, should span as wide a space as possible. The neural responses, Ni, are controlled indirectly through the stimuli used in the study, so the stimuli, Si, should be as independent of one another as possible. In practical terms, that means that the stimuli should vary along as many dimensions as possible.
Consistency as the Basic Test of a Neural Coding Hypothesis
Even if the stimuli are numerous and well designed, there are conceptual problems. In a regression analysis, the next step would typically be to formulate linear and nonlinear models as hypothetical links between the neural population responses, Ni, and subjects’ responses, ri, selecting between the models with some measure of goodness of fit. However, this confounds several steps in the process leading to the subjects’ responses. Three steps between the neural population responses and the subjects’ responses can be identified. Working back from the subject’s responses, the last step is the relationship between subjective magnitude, m, and the subject’s numerical report, r:
| (2) |
The sensations evoked by any stimulus are complex and multidimensional. It is possible to assign numbers to items that vary along multiple dimensions in an arbitrary way (nominal scale; Stevens 1946), but if subjects assign numbers to a single sensory dimension, about which greater-than and less-than judgments are appropriate, and those judgments are consistent, then we can assume that they are reporting on a unidimensional measure, m, of the multivariate subjective sensation evoked by the stimulus. To put it differently, if subjects’ numerical reports are equivalent to greater-than and less-than judgments (i.e., they are not just arbitrary labels), they must be isolating a unidimensional measure.
By the same kind of argument, it can be inferred that subjective magnitude, m, depends on a single, unidimensional measure, c, of the complex, multivariate neural response studied in the neurophysiological experiments:
| (3) |
| (4) |
in which c(N) is the function (the operation) that yields the neural coding measure, c. If, for example, c is the mean firing rate of a population of neurons, then c(N) is the operation, summation, required to obtain c.
If we attempt to solve the neural coding problem directly by testing specific relationships, r = f(N), we conflate the functions, r(m), m(c), and c(N). Each hypothesis requires a hypothetical neural coding measure (i.e., a putative operation c(N)) and a hypothetical relationship between r and c (conflating r(m) and m(c) because neither is observable). Should we assume that the subject’s responses are a logarithmic, a power, a linear, or some other function of the hypothetical neural response measure? There is no a priori basis for choosing one over another.
A more powerful approach consists of plotting the subjects’ mean response, r, to each stimulus against the hypothetical neural coding measure, c, associated with that stimulus. If the relationship is consistent, the hypothesis that the subjects’ responses depend on c cannot be rejected without making a judgment about what is a suitable relationship between the neural code, c, and the subjects’ judgments. If, however, the same or similar hypothetical coding measures are associated with very different psychophysical responses, then it can be inferred that there is no causal relationship between c and r. The power of the method is that it allows neural coding hypotheses to be rejected without any assumptions about the relationship between c and r. Furthermore, if the hypothesis is correct, then the relationship between c and r emerges directly. This consistency test was used in the series of neural coding studies described below.
Texture Perception
Texture perception is an important part of tactual perception. Our judgment of the quality and substance of an object is based in part on judgments of texture. The last 10 years have produced a marked change in our knowledge of texture perception and its neural mechanisms. A major step is the use of multidimensional scaling to show that texture perception is accounted for almost entirely by two independent dimensions, soft-hard and smooth-rough—surface hardness and roughness can occur in almost any combination, and they account for most or all of texture perception (Hollins and others 1993, 2000a). A third dimension (sticky-slippery) improves the multidimensional scaling fit in some subjects.
The rough-smooth dimension of texture perception has been studied extensively (Meenes and Zigler 1923; Stevens and Harris 1962; Lederman 1974, 1983; Sathian and others 1989; Blake and others 1997a; Hollins and others 2000a; Meftah and others 2000). These studies demonstrate that roughness perception is unidimensional (the test of unidimensionality being the ability to assign numbers on a unidimensional continuum and to make greater-than and less-than judgments); that it depends on element height, diameter, shape, compliance, and density; and that (although the effect of each is generally consistent with one’s expectation from subjective experience) the relationship between roughness perception and the physical properties of a surface is complex and nonlinear. Important early observations were that scanning velocity and contact force between the finger and a surface have minor or no effects on roughness magnitude judgments (Lederman 1974; Taylor and Lederman 1975). Although the physical determinants of roughness perception are complex, the evidence is that the neural mechanisms are simple.
An important question is whether texture perception is the result of intrinsic neural mechanisms (like color vision) or whether it is a description of sensory experience (in the same way that a sea can be described as smooth or rough). Combined psychophysical and neurophysiological studies provide strong evidence that the smooth-rough dimension is based on intrinsic neural mechanisms. Whether this is so for the soft-hard dimension is not known.
Before discussing these studies, it is important to distinguish between the objective and subjective components of texture perception and to make the point that studies of the neural mechanisms of the objective ability to discriminate textures tells us nothing about the neural mechanisms of the subjective perception of roughness and hardness and vice versa. For example, two patterns of raised dots with 2 and 5 mm dot spacings are easily distinguished from one another (the Weber fraction is 2%; Lamb 1983) but feel equally rough (Fig. 1). A host of neural cues distinguish the surfaces with 2 and 5 mm spacings, and any of those could be the basis for the objective ability to discriminate the surfaces, but whatever is the basis for discrimination, it is not the basis for the subjective roughness, which is the same for the two surfaces.
Fig. 1.
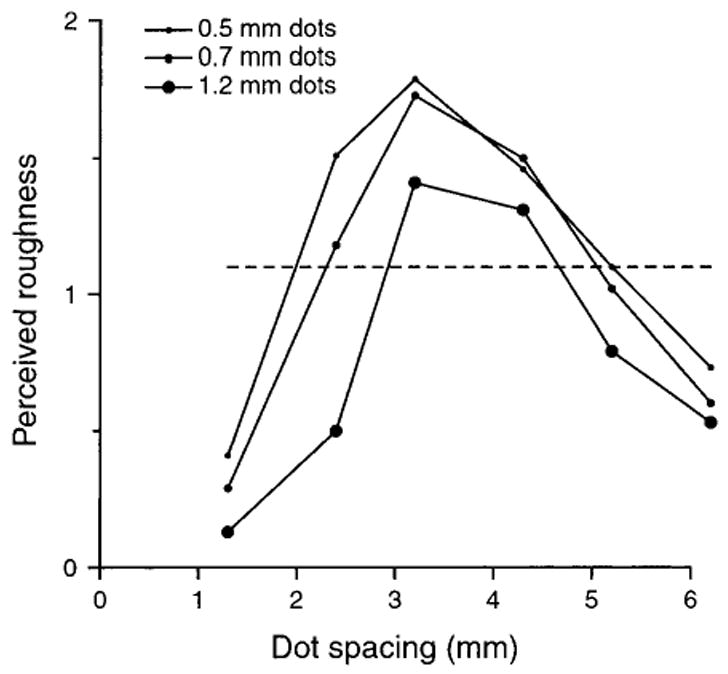
Subjective magnitude responses to raised dot patterns. Subjects scanned their index fingers across patterns of raised dots, 0.35 mm high. Segments of the patterns are illustrated at the top of Figure 2. After each scan, the subject reported his or her sense of subjective magnitude using a ratio scale (Stevens 1946); subjects were instructed to choose whatever range of numbers felt most comfortable, to place no upper bound on the numbers, and to report numbers that were proportional to their subjective sense of roughness. After the experiment, all the reports from a single subject were normalized by dividing each numerical report by his or her overall mean numerical report. That compensated for the fact that subjects chose different numerical ranges. The ordinate represents the mean numerical report (n = 21 subjects) for each of the 18 surfaces used in the study. The abscissa represents the center-to-center distance between dots, which ranged from 1.3 to 6.2 mm. Each of the three curves represents the mean reports for surfaces with different dot diameters (0.5, 0.7, and 1.2 mm). The horizontal dashed line is meant to illustrate the fact that very different surfaces evoke the same report of subjective roughness. The points of intersection between the dashed line and the roughness magnitude curves identify six surfaces that would evoke the same roughness report (1.1 in the normalized scale). If other horizontal lines were included, they would identify other surfaces that evoke the same sense of roughness. The neural coding measure on which roughness perception is based must be the same for each of the surfaces that evoke the same mean report. Adapted from Connor and others (1990).
Neural Mechanisms of Roughness Perception
The neural mechanisms of roughness perception have been studied in a series of combined psychophysical and neurophysiological experiments (Connor and others 1990; Connor and Johnson 1992; Blake and others 1997a; Yoshioka and others 2001) that followed the method of multiple working hypotheses and sequential elimination of hypotheses by falsification (Popper 1959; Platt 1964). In each study, the surfaces varied over two dimensions. The aim in the first study was to produce psychophysical results across a wide range of surfaces—results that would severely challenge any neural coding hypothesis. The result was that among a dozen broad neural coding categories, eight were eliminated by the consistency test described earlier. The experimental designs in the following three studies were aimed at testing the four remaining possibilities.
The combined result of the four studies is that all hypotheses but one have been rejected in at least one study; most of the more likely hypotheses have been rejected in two or more studies. The single hypothesis that survived was a measure of the spatial variation in the impulse rates of SA1 (Merkel) afferent fibers innervating the skin, which is computed by a simple, well-studied neural mechanism. To be specific, the measure, which will be called “SA1 spatial variation,” is the mean absolute difference in firing rates between SA1 afferent fibers with receptive field centers separated by about 2 mm. The point that is most relevant for this review is that perceived roughness was a linear function of SA1 spatial variation in every study. Because these studies have been reviewed recently (Johnson and others 2000), they will be described here only briefly.
The skin of the fingerpad is innervated by four types of mechanoreceptive afferent fibers that have distinctly different response properties and serve distinctly different perceptual functions (Johnson and others 2000; Johnson 2001). Roughness perception could depend on any of these four types or a combination of them. The four types comprise slowly adapting type 1 (SA1) afferents, rapidly adapting cutaneous (RA) afferents, Pacinian (PC) afferents, and slowly adapting type 2 (SA2) afferents. The SA1 afferents, which innervate the epidermis densely (100/cm2), terminate within Merkel cells at the base of the deepest epidermal ridges. They resolve the spatial details of tactile stimuli acutely; all the available evidence suggests that they are responsible for both form and texture perception (Johnson and others 2000). The RA afferents, which also innervate the skin densely (150/cm2), terminate in Meissner corpuscles at the margin between the dermis and epidermis. The RA afferents have relatively poor spatial resolution, but they are very sensitive to skin movement and they gather information about skin movement from a large skin area (5–25 mm2). They are responsible for the detection of minute motion on the surface of the skin. Each PC afferent terminates within a single Pacinian corpuscle. PC afferents, which are less numerous than SA1 or RA afferents, number about 2000 in the human hand. PC afferents are sensitive to high-frequency vibration with amplitudes in the nanometer range, and they are therefore responsible for the detection of high-frequency vibrations. The SA2 afferents, which are also much less numerous, are said to terminate in Ruffini corpuscles within the connective tissue matrix of the dermis. The available evidence suggests that they are responsible for the sense of skin stretch and may, therefore, play a critical role in the perception of hand shape.
The response properties of these mechanoreceptors and psychophysical studies provide some clues to the neural mechanisms of roughness perception. Except for the SA2 afferents, all the afferents are very sensitive to skin deformation and respond robustly to textured surfaces scanned across the skin (Phillips and others 1990, 1992). The SA2 afferents are not very sensitive to skin deformation apart from stretch, and they respond very poorly to scanned, textured surfaces (Phillips and others 1990, 1992). No measure of the SA2 afferent responses is consistent with roughness perception (Johnson and others 2000).
The constancy of roughness judgments over a very wide range of scanning velocities argues against a temporal mechanism as the basis for roughness perception—that is, some temporal measure of the neural response. A change in scanning velocity from 20 to 70 mm/s, for example, causes the temporal cadence of the stimulus features driving each afferent fiber to change almost fourfold, and it therefore has a large effect on any temporal measure of the neural responses, but it has no effect on roughness judgments (Lederman 1983). Nonetheless, central neural mechanisms might use information about scanning velocity to compensate for this effect. Vibratory adaptation that reduces magnitude estimates at 20 and 250 Hz (which indicates reduction of the sensitivity of RA and PC afferents) has little or no effect on roughness judgments (Lederman and others 1982). This argues against a role for RA and PC afferents (however, see Hollins and others 2000b). None of this circumstantial evidence was used to select or reject neural coding hypotheses in the studies described here.
The first combined psychophysical and neurophysiological study of roughness perception was by Sathian and others (1989). They were unable to conclusively eliminate any hypotheses, because their stimulus range was too small. The first study to employ the consistency test was by Connor and others (1990), which used dot patterns with varying center-to-center spacings between dots (0.8–6.5 mm) and varying dot diameters (0.5–1.2 mm). Roughness perception was an inverted U-shaped function of dot spacing, which peaked at 3.2 mm; surfaces with dot spacings smaller and greater than 3.2 were perceived as less rough. At each dot spacing, roughness declined with increasing dot diameter (because the dots felt less sharp). The result was three inverted U-shaped functions of dot spacing (Fig. 1). By drawing a horizontal line across the three functions, it can be seen that six surfaces produce the same subjective roughness although they evoke very different neural responses (Fig. 2). The neural measure upon which roughness perception depends must be constant for these six surfaces even though the neural responses differ. This provides a severe test of any neural coding hypothesis.
Fig. 2.
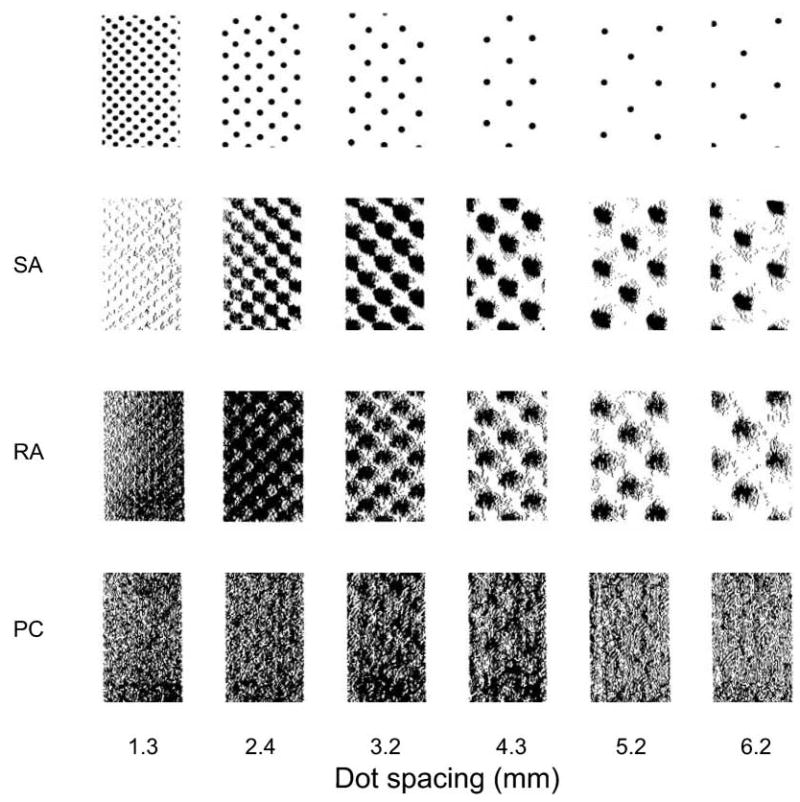
Responses of single, typical slowly adapting type 1 (SA1) afferents, rapidly adapting cutaneous (RA) afferents, and Pacinian (PC) afferents to six raised-dot surfaces with 0.5 mm dot diameters. The dot patterns were scanned repeatedly from right to left over the afferent fibers’ receptive fields (in effect, the receptive fields scanned from left to right) at 20 mm/s. Each tick mark represents the occurrence of an action potential. After each scan, the dot pattern was shifted 0.2 mm at right angles to the scanning direction. Each receptive field was on a distal fingerpad. Each cluster of action potentials in the right-hand rasters (6.2 mm dot spacing) of the SA1 and RA responses is, in effect, a receptive field plot. Note that although the SA1 and RA responses to the widely separated dots are similar, the SA1 afferent resolves the closely spaced dots much more effectively than does the RA afferent. This PC afferent (and all PC afferents) responds as intensely to the surface with 1.3 mm spacing (which feels quite smooth) as it does to the surface with 3.2 mm spacing (which feels very rough—about as rough as 36-grit sandpaper). Adapted from Connor and others (1990).
The consistency test is shown in Figure 3 for nine neural coding measures derived from the study by Connor and others (1990). As in all four studies described here, identical surfaces were used in the psychophysical and neurophysiological studies. The surfaces, which ranged from feeling almost glassy smooth to very rough, were scanned repeatedly across the receptive fields of monkey SA1, RA, and PC afferents to obtain a statistically accurate description of the population responses to these surfaces. Identical surfaces were also scanned across the receptive fields of human SA1, SA2, RA, and PC afferents (Phillips and others 1992). The result of the human studies was that, except for SA2 afferent responses, there were no significant differences between human and monkey neural responses (Johnson and others 2000).
Fig. 3.
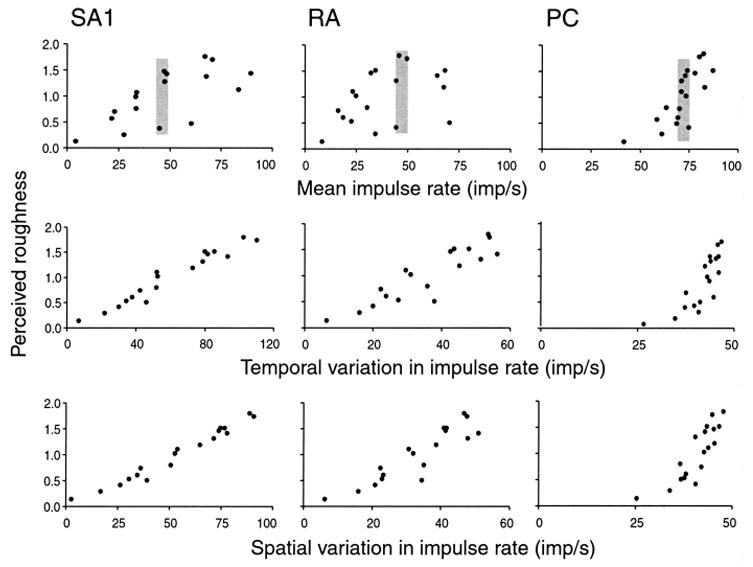
Consistency plots for nine possible neural coding measures. The ordinate of each graph represents the mean subjective roughness judgment for each of the 18 surfaces in the study by Connor and others (1990). The abscissa represents one of the neural response measures tested in this study. Mean impulse rate was the mean impulse rates of all afferents of a single type averaged across all stimulus sweeps. Temporal variation in firing rate was measured as the mean absolute difference in firing rates between periods separated by 100 ms. Spatial variation in firing rates was measured as the mean absolute difference in firing rates between afferents with receptive field centers separated by 2 to 3 mm. The gray bars highlight the fact that some of the smoothest and some of the roughest surfaces evoke nearly identical mean firing rates. Therefore, there is no consistent relationship between roughness judgments and mean firing rate. Note also that all Pacinian (PC) measures are confined to a very narrow range of values, which means that there is no consistent relationship between any PC measure and roughness perception. Rapidly adapting (RA) temporal and spatial measures are more poorly correlated with roughness than are the slowly adapting type 1 (SA1) measures, but the inconsistency is not sufficient to reject the hypothesis that RAs are responsible for roughness perception. Temporal and spatial response measures are about equally correlated because the surfaces are not well designed to distinguish between temporal and spatial codes (because the stimulus structure in the scanning, temporal direction is the same as in the orthogonal direction). Adapted from Connor and others (1990).
It is evident in Figure 3 that there is no consistent relationship between roughness perception and any measure of mean impulse rate. Spatial and temporal neural coding mechanisms based on PC responses failed because PCs are very sensitive and respond vigorously to smooth and rough surfaces alike (Fig. 2); there was little or no gradation in their spatial or temporal responses and therefore no basis for roughness perception. This rejection of all neural codes based on PC responses is consistent with the study by Lederman and others (1982) mentioned above, which showed that strong vibratory adaptation (that depressed the responses of PC afferents and reduced the subjective magnitudes of high-frequency stimuli) had no effect on perceived roughness. The most consistent relationships in the study were between spatial and temporal variations in SA1 impulse rates and the roughness judgments (0.98 and 0.97 correlation coefficients, respectively). The relationships were linear as well as consistent, even though nothing in the analysis predisposed the relationships to linearity; the putative neural measures were computed without reference to the psychophysical outcome. Comparable measures of RA impulse rates were more poorly correlated, but they cannot be said to have failed the consistency test in any clear and unambiguous way in this study. This study failed to distinguish between temporal and spatial measures because the temporal and spatial structures of the stimuli did not vary independently.
A second study in this series aimed to distinguish between temporal and spatial coding measures by varying the temporal and spatial properties independently; the surfaces were designed to produce results that could be consistent with either a spatial mechanism or a temporal mechanism but not both (Connor and Johnson 1992). The result was that subjects’ roughness judgments were positively correlated with temporal measures of variation in firing rates for half the surfaces (those in which dot spacing varied in the scanning direction) and negatively correlated for the other half (those in which dot spacing varied in the direction orthogonal to the scanning direction). Thus, there was no consistent relationship between any measure of temporal variation in the firing of either SA1 or RA afferents and roughness judgments. The same result was obtained for all measures of mean impulse rate, which eliminated measures based on mean impulse rate for the second time. This left spatial variation in either the SA1 or RA afferents as candidate mechanisms.
A third study aimed to distinguish between codes based on SA1 and RA afferent responses by varying dot height (Blake and others 1997a). Previous studies (Blake and others 1997b) had shown that RA responses saturate at dot heights greater than about 300 microns, whereas SA1 afferents respond with impulse rates proportional to dot height for dot heights greater than 600 microns (the saturation limit is not known). If roughness perception depends on RA responses, then roughness judgments should be independent of dot height, but they were not. The roughness judgments, like the SA1 responses, were proportional to dot height. The relationship between roughness judgments and SA1 spatial variation was linear, and the correlation was greater than 0.97 as in the previous two studies.
The fourth study was designed as a challenge to the SA1 spatial variation hypothesis (Yoshioka and others 2001). The SA1 innervation density is about 100 afferents per cm2 of skin area. Many fine surfaces that are very rough (e.g., fine sandpapers) have feature densities much higher than 100 per cm2. The question was whether a mechanism based on spatial variation in SA1 firing rates can account for the perceived roughness of surfaces whose spatial variation is much finer even than the afferent fiber spacing. This fourth study used 20 gratings with spatial periods ranging from 0.1 to 2.0 mm. As in previous studies, there was no consistent relationship between PC responses and roughness judgments, because the PCs were activated so strongly and uniformly by the fine and coarse gratings alike. SA1 afferents responded to the finely textured surfaces in a graded manner, and the mean absolute difference in SA1 firing rates between afferents (spatial variation) was correlated strongly (0.97) with subjective roughness estimates.
The correlation between SA1 spatial variation and roughness perception in all four studies is shown in Figures 4 and 5 in two forms. The correlation is shown as consistency plots in Figure 4. The linear correlation is 0.97 or greater for all four sets of data but, as well, the roughness judgments are proportional to SA1 spatial variation. Again, nothing about the analysis predisposed the outcome to linearity; a linear relationship emerged the first time SA1 spatial variation was computed. Figure 5 shows the comparison in a more conventional form. The psychophysical roughness judgments are shown on the left ordinate of each graph; the corresponding SA1 spatial variation is shown on the right ordinate. Because both ordinates are linear, the correspondence implies a linear relationship between SA1 spatial variation and roughness perception.
Fig. 4.
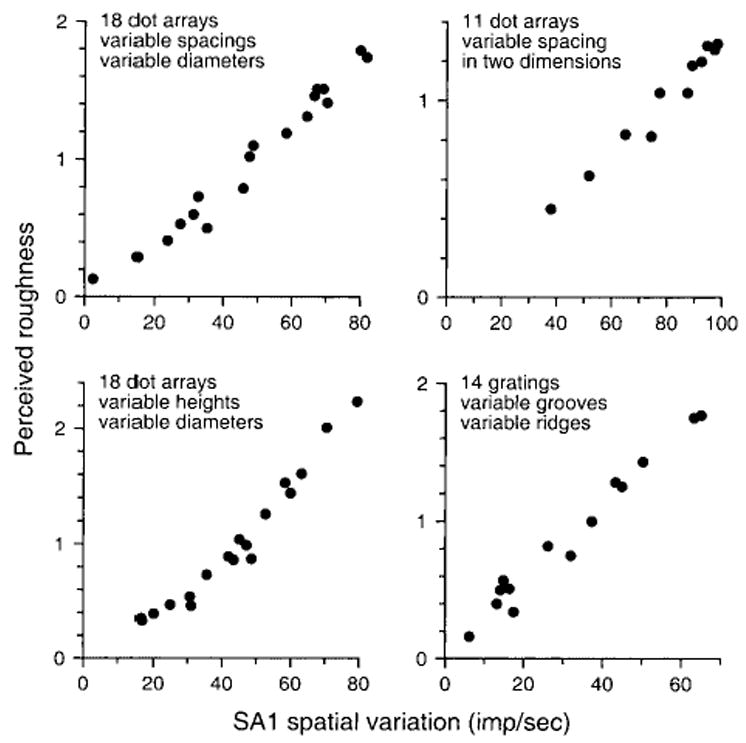
Consistency plots of slowly adapting type 1 (SA1) spatial variation versus subjective roughness from four studies with different stimulus patterns. The ordinate in each graph is the mean subjective report across all subjects in a single study. The abscissa is the mean absolute difference in firing rates between SA1 afferent fibers with receptive field centers separated by about 2 mm. Each dot represents the data from a single surface in the study. The data in the top left graph are from the study by Connor and others (1990), illustrated in Figures 1 to 3. The data in the top right graph are from the study by Connor and Johnson (1992), which was designed to distinguish between temporal and spatial neural codes. The data in the bottom left graph are from the study by Blake and others (1997a), which was designed to distinguish between neural codes based on SA1 and rapidly adapting (RA) responses. The data in the bottom right graph are from the study by Yoshioka and others (2001), which was designed to determine whether SA1 spatial variation could account for roughness perception when the feature separations are less than 1 mm. The product-moment correlation coefficient is 0.97 or greater in each graph.
Fig. 5.
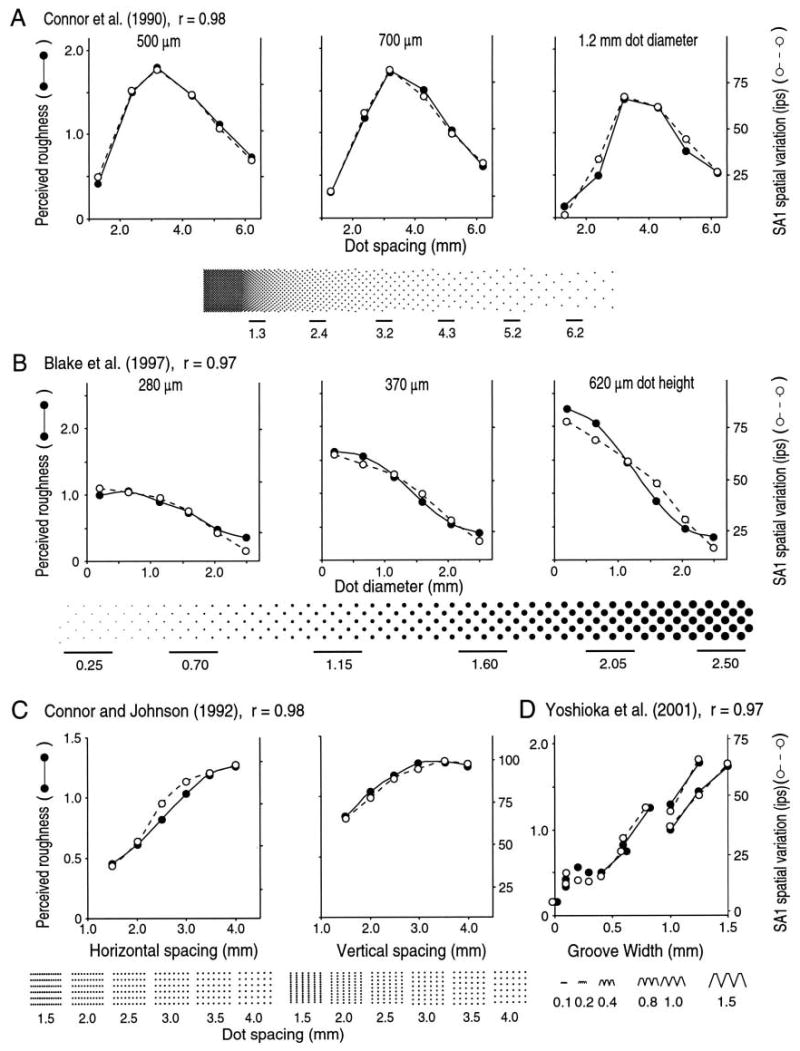
Roughness magnitude and spatial variation in slowly adapting type 1 (SAI) firing rates from four studies (see text). The left ordinate and filled circles in each graph represent mean roughness judgments for individual surfaces. The right ordinate and open circles represent spatial variation in SA1 impulse rates evoked by the same surfaces. The top row illustrates data from a study employing raised-dot patterns in which dot spacing and dot diameter were varied independently (Connor and others 1990). The middle row shows data from a study in which dot diameter and dot height were varied widely (Blake and others 1997b). The two left graphs, bottom row, show data from a study in which the horizontal dot spacing (i.e., dot spacing in the scanning direction) and vertical dot spacing (i.e., dot spacing orthogonal to the scanning direction) were varied independently (Connor and Johnson 1992). The right graph shows data from a study using scanned gratings in which the grating period ranged from 0.1 to 2.0 mm (Yoshioka and others 2001). The correlation between roughness judgments and this putative neural code was 0.97 or greater in all studies. Adapted from Yoshioka and others (2001).
The mean absolute difference in firing rates between SA1 afferents with receptive field centers separated by 2 to 3 mm may seem abstract, but it corresponds, in fact, to a simple neurophysiological mechanism (Connor and others 1990; Yoshioka and others 2001). Every neuron within the central nervous system whose receptive field includes regions of inhibition and excitation (which is, as far as is known, virtually all neurons in somatosensory cortex) computes a measure of the spatial variation in skin deformation. More precisely, the neuron’s discharge rate is proportional to the difference in discharge rates between afferents arising from the excitatory and inhibitory receptive field subregions. The principal importance of the mechanism is that it confers selectivity for particular stimulus features and their orientations. But the summed discharge rate of a population of such neurons can form the basis for roughness perception. In fact, neurons with exactly the properties hypothesized to account for roughness perception have been demonstrated in somatosensory cortex (DiCarlo and Johnson 2000). Such a mechanism has several things to recommend it. Like roughness perception, it is unidimensional and it is affected only secondarily by factors such as scanning velocity (DiCarlo and Johnson 1999). The combined psychophysical studies described above and the existence of neurons with the hypothesized properties suggest that roughness perception is based on the mean firing rate of a population of cortical neurons that compute SA1 spatial variation.
The Psychophysical Law
The question that motivated Fechner was whether there are simple, universal laws governing our subjective sense of the external world in the same way that there are simple, universal laws governing the external world itself. Fechner (1860) called this quest for the relationship between physical and subjective intensity “outer psychophysics” to distinguish it from “inner psychophysics,” which assumes the existence of an inner stimulus, E, as the source of subjective intensity. Fechner was aware that any attempt to link subjective intensity to physical intensity would have limited generality, but he was much more confident that general laws would prevail in inner psychophysics (Fechner 1860, p. 56): “While Weber’s law [and therefore, by Fechner’s reasoning, the logarithmic law] is of limited validity with respect to stimulus and sensation in the area of outer psychophysics, it probably has unlimited validity in the area of inner psychophysics.” The neural coding measure, c (equation 3 in this review), is equivalent to Fechner’s inner stimulus, E. Fechner even considered linearity as the possible inner law; that is, he considered the possibility that his logarithmic law might result from a logarithmic relationship between the inner and outer stimuli (E = k*log(S) and a linear relationship between subjective intensity and the inner stimulus (m = k*E) but rejected that idea in favor of a linear transducer function followed by a logarithmic law for the important, inner psychophysical relationships (Boring 1950, p. 292). Fechner seemed to have a clear notion of what had to be done to translate the study of outer psychophysics to the study of inner psychophysics (Fechner 1860, p. 56): “Quantitative dependence of sensation on the [outer] stimulus can eventually be translated into dependence on the [neural activity] that directly underlies sensation—in short, the psychophysical processes—and the measurement of sensation will be changed to one depending on the strength of these processes.” It was Mountcastle and his colleagues (Mountcastle and others 1963; Werner and Mountcastle 1965) who made this step by realizing that a correspondence between power law exponents for psychophysical and neurophysiological response functions implies linearity.
We were drawn to the same conclusion by the spontaneous appearance of linearity in the neural coding studies described in this article. The strength of these neural coding studies is 1) that a solid link has been established between SA1 spatial variation and roughness perception, 2) that the test used for hypothesis testing (consistency) makes no assumptions about the basic form of the psychophysical law, and 3) that linearity emerges directly in a comparison of subjective magnitude reports and SA1 spatial variation. All the available evidence points to linearity as the basic law of psychophysics. It would have been so from the beginning if Fechner had not rejected it in favor of a logarithmic law.
Footnotes
Supported by: NIH NS18787, NS34086, NS38034.
References
- Blake DT, Hsiao SS, Johnson KO. Neural coding mechanisms in tactile pattern recognition: the relative contributions of slowly and rapidly adapting mechanoreceptors to perceived roughness. J Neurosci. 1997a;17:7480–9. doi: 10.1523/JNEUROSCI.17-19-07480.1997. [DOI] [PMC free article] [PubMed] [Google Scholar]
- Blake DT, Johnson KO, Hsiao SS. Monkey cutaneous SAI and RA responses to raised and depressed scanned patterns: effects of width, height, orientation, and a raised surround. J Neurophysiol. 1997b;78:2503–17. doi: 10.1152/jn.1997.78.5.2503. [DOI] [PubMed] [Google Scholar]
- Boring EG. A history of experimental psychology. New York: Appleton-Century-Crofts; 1950. [Google Scholar]
- Connor CE, Hsiao SS, Phillips JR, Johnson KO. Tactile roughness: neural codes that account for psychophysical magnitude estimates. J Neurosci. 1990;10:3823–36. doi: 10.1523/JNEUROSCI.10-12-03823.1990. [DOI] [PMC free article] [PubMed] [Google Scholar]
- Connor CE, Johnson KO. Neural coding of tactile texture: comparisons of spatial and temporal mechanisms for roughness perception. J Neurosci. 1992;12:3414–26. doi: 10.1523/JNEUROSCI.12-09-03414.1992. [DOI] [PMC free article] [PubMed] [Google Scholar]
- DiCarlo JJ, Johnson KO. Velocity invariance of receptive field structure in somatosensory cortical area 3b of the alert monkey. J Neurosci. 1999;19:401–19. doi: 10.1523/JNEUROSCI.19-01-00401.1999. [DOI] [PMC free article] [PubMed] [Google Scholar]
- DiCarlo JJ, Johnson KO. Spatial and temporal structure of receptive fields in primate somatosensory area 3b: effects of stimulus scanning direction and orientation. J Neurosci. 2000;20:495–510. doi: 10.1523/JNEUROSCI.20-01-00495.2000. [DOI] [PMC free article] [PubMed] [Google Scholar]
- Draper NR, Smith H. Applied regression analysis. 3. New York: John Wiley; 1998. [Google Scholar]
- Fechner GT. In: Elements of psychophysics 1966. Adler HE, translator. New York: Holt, Rinehart and Winston; 1860. [Google Scholar]
- Hollins M, Bensmaïa SJ, Karlof K, Young F. Individual differences in perceptual space for tactile textures: evidence from multidimensional scaling. Percept Psychophys. 2000a;62:1534–44. doi: 10.3758/bf03212154. [DOI] [PubMed] [Google Scholar]
- Hollins M, Faldowski R, Rao S, Young F. Perceptual dimensions of tactile surface texture: a multidimensional-scaling analysis. Percept Psychophys. 1993;54:697–705. doi: 10.3758/bf03211795. [DOI] [PubMed] [Google Scholar]
- Hollins M, Fox A, Bishop C. Imposed vibration influences perceived tactile smoothness. Perception. 2000b;29:1455–65. doi: 10.1068/p3044. [DOI] [PubMed] [Google Scholar]
- Johnson JH, Turner CW, Zwislocki JJ, Margolis RH. Just noticeable differences for intensity and their relation to loudness. J Acoust Soc Am. 1993;93:983–91. doi: 10.1121/1.405404. [DOI] [PubMed] [Google Scholar]
- Johnson KO. Reconstruction of population response to a vibratory stimulus in quickly adapting mechanoreceptive afferent fiber population innervating glabrous skin of the monkey. J Neurophysiol. 1974;37:48–72. doi: 10.1152/jn.1974.37.1.48. [DOI] [PubMed] [Google Scholar]
- Johnson KO. The roles and functions of cutaneous mechanoreceptors. Curr Opin Neurobiol. 2001;11:455–61. doi: 10.1016/s0959-4388(00)00234-8. [DOI] [PubMed] [Google Scholar]
- Johnson KO, Hsiao SS. Evaluation of the relative roles of slowly and rapidly adapting afferent fibers in roughness perception. Can J Physiol Pharmacol. 1994;72:488–97. doi: 10.1139/y94-072. [DOI] [PubMed] [Google Scholar]
- Johnson KO, Yoshioka T, Vega-Bermudez F. Tactile functions of mechanoreceptive afferents innervating the hand. J Clin Neurophysiol. 2000;17:539–58. doi: 10.1097/00004691-200011000-00002. [DOI] [PubMed] [Google Scholar]
- Lamb GD. Tactile discrimination of textured surfaces: psychophysical performance measurements in humans. J Physiol. 1983;338:551–65. doi: 10.1113/jphysiol.1983.sp014689. [DOI] [PMC free article] [PubMed] [Google Scholar]
- Lederman SJ. Tactile roughness of grooved surfaces: the touching process and the effects of macro- and microsurface structure. Percept Psychophys. 1974;16:385–95. [Google Scholar]
- Lederman SJ. Tactual roughness perception: spatial and temporal determinants. Can J Psychol. 1983;37:498–511. [Google Scholar]
- Lederman SJ, Loomis JM, Williams DA. The role of vibration in the tactual perception of roughness. Percept Psychophys. 1982;32:109–16. doi: 10.3758/bf03204270. [DOI] [PubMed] [Google Scholar]
- MacKay DM. Psychophysics of perceived intensity: a theoretical basis for Fechner’s and Stevens’ laws. Science. 1963;139:1213–16. [Google Scholar]
- Meenes M, Zigler MJ. An experimental study of the perceptions of roughness and smoothness. Am J Psychol. 1923;34:542–9. [Google Scholar]
- Meftah EM, Belingard L, Chapman CE. Relative effects of the spatial and temporal characteristics of scanned surfaces on human perception of tactile roughness using passive touch. Exp Brain Res. 2000;132:351–61. doi: 10.1007/s002210000348. [DOI] [PubMed] [Google Scholar]
- Mountcastle VB, Poggio GF, Werner G. The relation of thalamic cell response to peripheral stimuli varied over an intensive continuum. J Neurophysiol. 1963;26:807–34. doi: 10.1152/jn.1963.26.5.807. [DOI] [PubMed] [Google Scholar]
- Phillips JR, Johansson RS, Johnson KO. Representation of Braille characters in human nerve fibers. Exp Brain Res. 1990;81:589–92. doi: 10.1007/BF02423508. [DOI] [PubMed] [Google Scholar]
- Phillips JR, Johansson RS, Johnson KO. Responses of human mechanoreceptive afferents to embossed dot arrays scanned across fingerpad skin. J Neurosci. 1992;12:827–39. doi: 10.1523/JNEUROSCI.12-03-00827.1992. [DOI] [PMC free article] [PubMed] [Google Scholar]
- Platt JR. Strong inference. Science. 1964;146:347–53. doi: 10.1126/science.146.3642.347. [DOI] [PubMed] [Google Scholar]
- Popper K. The logic of scientific discovery. New York: Basic Books; 1959. [Google Scholar]
- Sathian K, Goodwin AW, John KT, Darian-Smith I. Perceived roughness of a grating: correlation with responses of mechanoreceptive afferents innervating the monkey’s fingerpad. J Neurosci. 1989;9:1273–9. doi: 10.1523/JNEUROSCI.09-04-01273.1989. [DOI] [PMC free article] [PubMed] [Google Scholar]
- Schroder AC, Viemeister NF, Nelson DA. Intensity discrimination in normal-hearing and hearing-impaired listeners. J Acoust Soc Am. 1994;96:2683–93. doi: 10.1121/1.411276. [DOI] [PubMed] [Google Scholar]
- Stevens SS. On the theory of scales of measurement. Science. 1946;103:677–80. doi: 10.1126/science.103.2684.677. [DOI] [PubMed] [Google Scholar]
- Stevens SS. On the psychophysical law. Psychol Rev. 1957;64:153–81. doi: 10.1037/h0046162. [DOI] [PubMed] [Google Scholar]
- Stevens SS. The psychophysics of sensory function. In: Rosenblith WA, editor. Sensory communication. Cambridge, MA: MIT Press; 1961a. pp. 1–34. [Google Scholar]
- Stevens SS. To honor Fechner and repeal his law. Science. 1961b;133:80–6. doi: 10.1126/science.133.3446.80. [DOI] [PubMed] [Google Scholar]
- Stevens SS. Neural events and the psychophysical law. Science. 1970;170:1043–50. doi: 10.1126/science.170.3962.1043. [DOI] [PubMed] [Google Scholar]
- Stevens SS. Psychophysics: introduction to its perceptual, neural and social aspects. New York: John Wiley; 1975. [Google Scholar]
- Stevens SS, Harris JR. The scaling of subjective roughness and smoothness. J Exp Psychol. 1962;64:489–94. doi: 10.1037/h0042621. [DOI] [PubMed] [Google Scholar]
- Taylor MM, Lederman SJ. Tactile roughness of grooved surfaces: a model and the effect of friction. Percept Psychophys. 1975;17:23–36. [Google Scholar]
- Vega-Bermudez F, Johnson KO. SA1 and RA receptive fields, response variability, and population responses mapped with a probe array. J Neurophysiol. 1999;81:2701–10. doi: 10.1152/jn.1999.81.6.2701. [DOI] [PubMed] [Google Scholar]
- Werner G, Mountcastle VB. Neural activity in mechanoreceptive cutaneous afferents: stimulus-response relations, Weber functions, and information transmission. J Neurophysiol. 1965;28:359–97. doi: 10.1152/jn.1965.28.2.359. [DOI] [PubMed] [Google Scholar]
- Yoshioka T, Gibb B, Dorsch AK, Hsiao SS, Johnson KO. Neural coding mechanisms underlying perceived roughness of finely textured surfaces. J Neurosci. 2001;21:6905–16. doi: 10.1523/JNEUROSCI.21-17-06905.2001. [DOI] [PMC free article] [PubMed] [Google Scholar]