
Fig. 3.
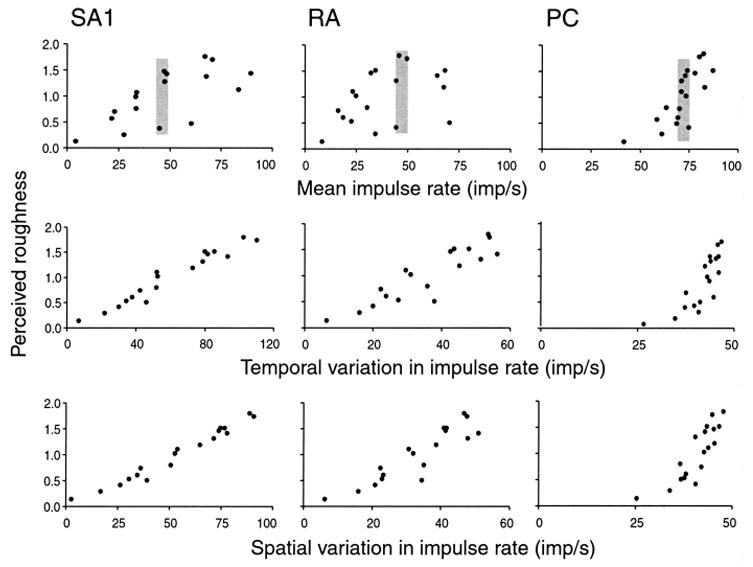
Consistency plots for nine possible neural coding measures. The ordinate of each graph represents the mean subjective roughness judgment for each of the 18 surfaces in the study by Connor and others (1990). The abscissa represents one of the neural response measures tested in this study. Mean impulse rate was the mean impulse rates of all afferents of a single type averaged across all stimulus sweeps. Temporal variation in firing rate was measured as the mean absolute difference in firing rates between periods separated by 100 ms. Spatial variation in firing rates was measured as the mean absolute difference in firing rates between afferents with receptive field centers separated by 2 to 3 mm. The gray bars highlight the fact that some of the smoothest and some of the roughest surfaces evoke nearly identical mean firing rates. Therefore, there is no consistent relationship between roughness judgments and mean firing rate. Note also that all Pacinian (PC) measures are confined to a very narrow range of values, which means that there is no consistent relationship between any PC measure and roughness perception. Rapidly adapting (RA) temporal and spatial measures are more poorly correlated with roughness than are the slowly adapting type 1 (SA1) measures, but the inconsistency is not sufficient to reject the hypothesis that RAs are responsible for roughness perception. Temporal and spatial response measures are about equally correlated because the surfaces are not well designed to distinguish between temporal and spatial codes (because the stimulus structure in the scanning, temporal direction is the same as in the orthogonal direction). Adapted from Connor and others (1990).