

Abstract
Two proteins are considered to have a similar fold if sufficiently many of their secondary structure elements are positioned similarly in space and are connected in the same order. Such a common structural scaffold may arise due to either divergent or convergent evolution. The intervening unaligned regions (“loops”) between the superimposable helices and strands can exhibit a wide range of similarity and may offer clues to the structural evolution of folds. One might argue that more closely related proteins differ less in their nonconserved loop regions than distantly related proteins and, at the same time, the degree of variability in the loop regions in structurally similar but unrelated proteins is higher than in homologs. Here we introduce a new measure for structural (dis)similarity in loop regions that is based on the concept of the Hausdorff metric. This measure is used to gauge protein relatedness and is tested on a benchmark of homologous and analogous protein structures. It has been shown that the new measure can distinguish homologous from analogous proteins with the same or higher accuracy than the conventional measures that are based on comparing proteins in structurally aligned regions. We argue that this result can be attributed to the higher sensitivity of the Hausdorff (dis)similarity measure in detecting particularly evident dissimilarities in structures and draw some conclusions about evolutionary relatedness of proteins in the most populated protein folds.
Keywords: protein evolution, structural alignment, Hausdorff metric, loops
INTRODUCTION
Correct functional and structural protein classification requires an understanding of the underlying phylogenetic relationships between existing proteins. The protein polypeptide chain folds into a stable, unique, highly ordered conformation, which is necessary for maintaining its particular function. Many observations strongly suggest that protein evolution takes place under strong structural constraints and, as a result, proteins that drifted apart over time due to divergent evolution may still exhibit structural resemblance despite the absence of detectable sequence similarity. Such proteins are examples of remote homologs sharing the same evolutionary origin. Homology in these cases can be inferred by similarity in function and/or by the presence of conserved atypical sequence or structural features.1 Structural similarity, however, does not necessarily imply evolutionary divergence. It is believed that similarity in overall protein topology can occur independently due to the limited number of topological arrangements or folding patterns.2– 6 This type of similarity caused by convergent evolution is usually referred to as “analogous.”
Several studies have addressed the problem of distinguishing structural similarity due to common origin versus convergent evolution. Russell et al.,5,7 for example, found that secondary structures and sequence similarity were more conserved in remote homologs compared to analogs, whereas substitution matrices derived from homologous proteins preserved amino acid chemical properties and performed quite well in homology recognition. The success rate in fold recognition experiments was also shown to be much higher for homologs compared to analogous fold pairs.7,8
At the same time, it has been observed that the degree of conservation of chemical properties in proteins decreases quite rapidly with decreasing sequence similarity for both homologs and analogs, which makes their populations almost indistinguishable at large evolutionary distances.9,10 Indeed, several observations have indicated that various measures of pairwise sequence and structure similarity such as sequence identity, root-mean-square superposition residual (RMSD), the proportion of conserved side-chain contacts, and others do not distinguish well between remote homologs and analogs, which suggests that other aspects of protein similarity should be taken into account.4,10,11
The correct classification of homologous and analogous proteins requires a choice of sensitive variables of structural, sequence, or functional similarity. So far, the comparative analysis of proteins has primarily focused on those regions that are recognizably conserved and aligned by various methods. The most commonly used measures of similarity were based on comparing the sequence and structural features in equivalent aligned positions. However, given an alignment, the conserved regions are separated by nonconserved ones, where the structures and sequences locally deviate from each other, so that they do not superpose well. Such regions, which mostly occur via insertion or deletion (indel) events, appear to be not very critical for structural integrity but may be quite crucial for inferring the phylogenetic history of a protein family. Modeling of insertion– deletion events in evolution is a particularly difficult task, and many researchers simply tend to ignore alignment uncertainty during the reconstruction of evolutionary events. Traditionally, in order to score insertions or deletions in sequence alignments, affine gap penalties have been used despite the fact that this simple model does not adequately describe the evolution of indels.12–14
It was observed several years ago that the probability of a gap in the alignment of two protein sequences is a function of evolutionary distance between two homologous proteins, and there exists a linear relationship between the number of residues in indels and evolutionary distance.15,16 One possible explanation of this observation would suggest an incremental change in loops by stepwise insertion or deletion processes.17 At the same time, it was shown that most of the structural variation in aligned regions of homologous proteins is strongly correlated to the changes in sequence,9,18 –21 while the structural variation among nonhomologous proteins is not coupled with the sequence similarity.20,21 Based on the aforementioned observations, one might argue that more closely related proteins might differ less in their nonaligned regions compared to the distantly related proteins; the degree of variability in loop regions in structural analogs should be higher than in homologous proteins and in general should not depend on evolutionary distance. Therefore, one might gauge the protein relatedness by using, in some way, the degree of difference displayed by the nonconserved loop regions.
In this article, we describe a new similarity measure that takes into account the degree of structural difference in nonconserved, looped out regions of proteins. This new measure is based on the Hausdorff metric, which is used in the branch of mathematics known as topology to define a distance measure between point sets of a metric space. Using the benchmark of homologous and analogous protein structures as a merit of success, we compare the loop-based Hausdorff measure (LHM) to the conventional quantities based on scoring the similarity in the aligned regions. We show that scoring based on loop regions of protein domains can be as sensitive as conventional scoring in discriminating analogous and homologous folds. Moreover, we show that the new similarity measure can be successfully applied to test the evolutionary relatedness between different proteins of the most populated super-folds.
MATERIALS AND METHODS
Test Set of Homologous and Analogous Protein Pairs
Crystal structure atomic coordinates were obtained from the Protein Data Bank (PDB).22 These files were processed and their data were added to the National Center for Biotechnology Information (NCBI) Macromolecular Modeling Database (MMDB),23 which is distributed with EN-TREZ (http://www.ncbi.nlm.nih.gov/entrez/). Domain boundaries from the MMDB have been identified using a compactness algorithm,24 and a nonredundant set of domains has been selected by single-linkage clustering based on a BLAST P-value of 10−40.11 Domains with discontinuous chain trace and domains with X-ray resolution of 3.0 Å or greater were discarded. Structural Classification of Proteins (SCOP) release 1.63 definitions for fold and superfamily categories were used to classify MMDB domains according to SCOP.25 Due to differences in domain definitions, SCOP domains were matched to MMDB domains to a threshold of 80% mutual overlap.
Structural alignments between the domains from the nonredundant set were computed by the VAST algorithm.26 Domains with missing coordinates in a crystal structure due to local regions of disorder in the polypeptide chain were excluded from the test set. Pairs of structurally aligned domains with more than 25% sequence identity in the aligned region and more than 80 residues long were disregarded according to a threshold of significant sequence similarity suggested earlier.27 After the filtering, we ended up with 9428 pairs of structurally aligned domains, where both domains from a pair belonged to the same SCOP superfamily (“homologous domain pairs”), and 10,451 domain pairs that had the same SCOP fold but belonged to different SCOP superfamilies (“analogous domain pairs”). The table of domain pairs with all sequence and structure similarity measures is available at http://www.ncbi.nlm.nih.gov/Structure/madej/loops04.htm.
Measures of Structural Similarity
When both domains in a pair have similar tertiary structures, it means that a number of the secondary structure elements (SSEs) are positioned similarly in space, so that they superpose well, with the same chain connectivity. A region between two consecutive aligned SSEs is called in this article a “loop region” (or simply a “loop”). Among similarity measures used in this article, three (percent identity, RMSD, and fraction aligned) are based on comparing the structures in the aligned regions, and the other three measures (sum of the loop lengths, fraction of loops aligned, and the LHM) quantify the difference in the loop regions. Root-mean-square deviation (RMSD) was computed for the VAST structure alignments using the superposition algorithm due to McLachlan.28 Since RMSD depends on the number of aligned residues,29 we use a “normalized RMSD,” which is the superposition RMSD divided by the number of aligned residues. “Fraction aligned” is calculated as a ratio between the number of residues aligned and the number of residues in the smaller of the two domains.
The first measure using the loops is calculated as a sum of loop lengths per aligned segment:
| (1) |
Here, and are the number of residues in non-aligned loop “i” of structures “A” and “B”, and ns is the number of aligned secondary structure elements, so that ns − 1 is the overall number of loop regions in a domain pair. The LS measure has an important property that any distance function should have, namely, that the smaller its value, the more similar the structures. Since LS measures the average number of nonaligned residues, the LS equal to zero would correspond to the situation when all loops are completely aligned and structures are globally similar. Another loop-based measure is the fraction of aligned loops out of the overall number of loops:
| (2) |
where nl is the number of nonaligned loops, meaning those that are not completely aligned by the VAST algorithm.
To quantify the structural difference between non-aligned loops, we use the LHM, which is based on the mathematical concept of Hausdorff metric.30 As we will only deal with finite sets, we present a simplified mathematical definition. Let A = {a1,…,am} and B = {b1,…,bn} be finite point sets in a Euclidean space. The Hausdorff distance between the sets A and B is then defined by:
| (3) |
Here, the terms d(ai,bj) denote the usual Euclidean distance between the points. In other words, the Hausdorff distance between the sets A and B is the smallest distance such that every point ai ∈ A is within this distance of some point bj ∈ B, and vice versa. Hausdorff distance can be defined under the assumption that the structural alignment between two domains is known and the Cα atoms for both structures are in a common coordinate frame. The LHM (for loops) is then defined as follows:
| (4) |
Here, hi = 0, if the ith loop regions do not have any unaligned residues; hi = dH(Ai,Bi), where Ai contains the set of Cα coordinates of nonaligned residues in the ith loop of the first structure in a pair, the last aligned residue from the preceding aligned region, and the first aligned residue from the following aligned region. Similarly, Bi is defined for the second structure in a pair. The sets (Ai, Bi) are defined to include two aligned residues, so that the measure can be defined even if one of the sets of nonaligned residues is empty.
We can also define a HM on the aligned regions in a structure alignment (AHM). In this case, instead of the sets that contain the coordinates for the Cα atoms in the loops, we use the coordinates for the Cα atoms in the aligned segments and average over the number of aligned segments. When used for the aligned regions, the AHM is highly correlated with the superposition RMSD and tends to be a little larger (HM, as well as RMSD, is measured in Angstroms).
It should be noted that our results are robust with respect to possible inaccuracies in terms of the N- and C-terminal extensions of the structurally aligned regions. Assuming the SSEs are aligned correctly, two types of extension errors can occur. The first one is where the alignment is not extended far enough to include structurally similar loops, and the second corresponds to the situation where the alignment is too extensive and includes structurally dissimilar loops. The first scenario would shift the distribution of LHM values upwards, but this shift can be considered minor due to overall structural similarity in loop regions. The second possibility can be disregarded as well, since it would manifest itself in large overall values of RMSD, whereas the average RMSD for our test set is under 3.0 Å, and less than 1% of the alignments have an RMSD over 5.0 Å.
Evaluation of Statistical Significance
To distinguish between the two groups of homologous and analogous domain pairs, we used discriminant analysis.31 This statistical technique constructs a discriminant function that divides the parameter space into regions so as to separate the groups as distinctly as possible. The analysis was done using the linear discriminant subroutine from the Splus2000 package with the default parameters. The method implemented in this subroutine constructs a linear discriminant function, computes the posterior probability of group membership for each observation, and assigns the observation to the group that has the highest probability. As a result, a classification matrix is produced, which gives the fraction of observations correctly assigned to each group by the discriminant function. In our case, a good classification would be quantified by high fractions for both correctly predicted homologous pairs and correctly predicted analogous pairs. The discriminant analysis allows us to separate groups of homologous and analogous domain pairs using different similarity measures and their combinations. The discriminant variables that describe each pair include percent identity in structure–structure alignment, normalized RMSD, HM calculated for aligned and loop regions, fraction aligned, sum of loop lengths, and fraction of loops aligned.
The correlation analysis between the measures of sequence and structural similarity was performed using Splus version 3.4. As a measure of correlation quality, we used the values of the Pearson correlation coefficient (ρ) and the squared correlation coefficient (ρ2). The latter shows the percentage of the scatter relative to the mean value explained by the linear model. The P-value under the null hypothesis that the correlation coefficient between two variables is zero has been estimated as well. The cases with the P-values less than 0.01 were considered as having statistically significant correlation.
RESULTS
Discrimination Between Homologous and Analogous Domains Using Different Measures of Structure and Sequence Similarity
Discrimination between homologous and analogous domains is a particularly difficult task requiring sensitive discriminant variables that can capture the subtle differences in structure and sequence between proteins with similar topology. It is a more difficult task than, say, distinguishing homologous proteins from the overall set of nonhomologous proteins. As can be seen from Table I, the different (dis)similarity scores vary in discrimination quality, and none of them achieves a perfect classification. Percent identity, HM, normalized RMSD, and fraction of loops aligned are among the most sensitive measures, whereas the HM based on loop regions does particularly well for predicting both homologous and analogous pairs. The HM calculated over the aligned part, however, shows almost as good discrimination as the same measure calculated for the looped out regions. The observed improvement in the prediction accuracy, therefore, could be due to the higher sensitivity of the HM in detecting particularly evident dissimilarities in structures for the overall test set, while the RMSD score gives almost equal weights on all parts of the alignment. A linear combination of two seemingly complementary scores of structural similarity based on aligned and loop regions (RMSD and LHM) improves the discrimination, in particular, the correct assignment of analogous pairs increases by more than 20% compared to the case when a similarity score is based solely on the aligned part.
TABLE I.
Main Diagonal of the Classification Table Produced by Discriminant Analysis for Each Discriminant Variable Used in the Study
| % Id | RMSD | LHM (AHM) | LS | FA | LA | RMSD + LHM | All | |
|---|---|---|---|---|---|---|---|---|
| Correct assignment of analogs (%) | 90 | 57 | 75 (71) | 65 | 69 | 84 | 79 | 89 |
| Correct assignment of homologs (%) | 59 | 66 | 64 (60) | 58 | 48 | 55 | 66 | 69 |
Abbreviations: percent identity (%Id); root-mean-square deviation (RMSD); loop-based Hausdorff measure (LHM); Hausdorff measure based on the aligned part (AHM); loop length measure (LS); fraction aligned (FA); fraction of loops aligned (LA).
For the last two columns, the linear combination of two (RMSD + LHM) and 6 main variables (ALL) are used in the discriminant function. Elements of the main diagonal give the percentage of pairs correctly assigned to each group by the discriminant function.
Table II presents the discrimination quality achieved with different variables for the most populated SCOP fold categories (superfolds) from our test set. In agreement with our previous results, loop-based measures are shown to perform comparably to measures that are calculated based on the aligned part. As can be seen from the Table II, for several folds, the RMSD score classifies homologous and analogous pairs better than other scores, which could be explained by the fact that the RMSD score more precisely captures the difference in the sets of long-range tertiary interactions stabilizing given superfold.
TABLE II.
Main diagonal of the Classification Table for 16 Superfolds (Percentage of Correctly Assigned Homologous–Analogous Pairs) for 2 Alignment-Based and 2 Loop-Based Similarity Measures
| SCOP Fold Name | %Id | RMSD | LHM | LA |
|---|---|---|---|---|
| Cupredoxin-like | 100/0 | 100/17 | 100/0 | 100/0 |
| β-Trefoil | 36/94 | 18/96 | 0/100 | 27/96 |
| OB-fold | 28/80 | 52/72 | 32/78 | 44/77 |
| TIM β/α-barrel | 10/100 | 5/100 | 0/100 | 2/100 |
| Profilin-like | 35/95 | 94/97 | 82/92 | 71/89 |
| β-Grasp (ubiquitin-like) | 55/91 | 98/91 | 71/84 | 53/64 |
| Adenine nucleotide α hydrolase-like | 57/70 | 83/65 | 51/75 | 43/89 |
| Thioredoxin fold | 100/0 | 100/5 | 100/0 | 100/0 |
| Ribonuclease H-like motif | 0/92 | 35/97 | 0/100 | 0/100 |
| Ntn hydrolase-like | 90/46 | 94/100 | 97/0 | 83/62 |
| Flavodoxin-like | 50/97 | 81/98 | 48/99 | 56/96 |
| Four-helical up-and-down bundle | 58/100 | 68/98 | 53/98 | 58/91 |
| Immunoglobulin-like β-sandwich | 58/93 | 53/95 | 39/94 | 41/93 |
| SH3-like barrel | 97/94 | 100/83 | 98/90 | 96/90 |
| Cystatin-like | 87/25 | 96/92 | 87/58 | 92/42 |
| Ferredoxin-like | 61/100 | 0/100 | 31/100 | 53/97 |
The complete table is available at http://www.ncbi.nlm.nih.gov/Structure/madej/loops04.htm.
Although the goal of this work has not been to achieve the highest possible discrimination quality per se, here we offer a comparison with the results of homolog–analog discrimination obtained by other independent methods. In order to do so, we need to reformulate the problem of classification of homologous and analogous pairs into the problem of discriminating homologous pairs from all other structurally similar pairs. For this purpose, we defined homologous pairs as true positives, analogous pairs as false positives, and calculated the coverage of true positives at 80% reliability level. Coverage was estimated as a fraction of all true positives found, and reliability was measured as a fraction of true positives found among all positively scored examples. As a result, we found that the linear combination of our 6 discriminant variables, with the linear coefficients given by the discriminant analysis,31 yields 70% coverage at the 80% reliability level. Dietmann and Holm,32,33 using neural networks to detect homology between different branches of a structural similarity tree, reported 65% coverage at the 80% reliability level. The output from their neural networks was then used to find an optimal partition of structural similarity trees in terms of separating clusters of homologous proteins from all others, which increased the classification accuracy up to 80% at the same level of reliability. The Markovian transition model of structural evolution, in turn, has been shown to find 48% of homologous pairs with 80% reliability.34
Gauging the Evolutionary Relationships of Protein Superfolds Using Loop (Dis)Similarity Scores
The maximum discrimination accuracy, as presented in Table III, varies greatly among the 16 largest SCOP fold categories with more than one superfamily. As can be seen from Table III, for the majority of superfolds, the fraction of correctly assigned pairs is greater than 70% for both homologs and analogs, indicating that the two groups of homologous and analogous pairs are fairly distinct and can be divided easily by the discriminant function. Even though the discrimination accuracy for 9 out of 16 folds is relatively high, for the rest of the folds, it remains low. To examine the factors that potentially can limit the quality of discrimination and to test the ability of our new measure in gauging homology, we performed a correlation analysis between measures of sequence and structure similarity for the sets of homologous and analogous pairs for each superfold.
TABLE III.
Classification Accuracy and Measures of Linear Correlation Between Structural and Sequence Similarity for Homologous and Analogous Pairs for 16 Superfolds
| SCOP Fold Name | Discrimination Accuracy | ρ(Rmsd) for Homologs | ρ(LHM) for Homologs | ρ(Rmsd) for Analogs | ρ(LHM) for Analogs |
|---|---|---|---|---|---|
| Cupredoxin-like | 98/58 | −0.59* | −0.72* | 0.63 | −0.81* |
| β-Trefoil | 64/95 | −0.90* | −0.74* | −0.15 | −0.42* |
| OB-fold | 56/79 | −0.52* | −0.52* | −0.26* | −0.35* |
| TIM β/α-barrel | 22/99 | −0.70* | −0.63* | −0.23* | −0.27* |
| Profilin-like | 94/97* | −0.82* | −0.79* | −0.32 | −0.25 |
| β-Grasp (ubiquitin-like) | 95/90* | −0.70* | −0.49* | −0.21* | −0.19* |
| Adenine nucleotide α hydrolase-like | 71/75* | −0.49* | −0.42* | 0.06 | 0.19 |
| Thioredoxin fold | 100/5 | −0.61* | −0.62* | 0.007 | −0.18 |
| Ribonuclease H-like motif | 35/89 | −0.71* | −0.73* | −0.11 | 0.14 |
| Ntn hydrolase-like | 100/92* | −0.81* | −0.73* | 0.06 | −0.1 |
| Flavodoxin-like | 83/97* | −0.66* | −0.59* | −0.18* | −0.08 |
| Four-helical up-and-down bundle | 84/100* | −0.67* | −0.48* | 0.002 | −0.06 |
| Immunoglobulin-like β-sandwich | 63/96 | −0.54* | −0.52* | −0.18* | −0.05* |
| SH3-like barrel | 98/98* | −0.35* | −0.40* | −0.21* | 0.04 |
| Cystatin-like | 92/100* | −0.34 | −0.36 | 0.25 | −0.02 |
| Ferredoxin-like | 82/100* | −0.46* | −0.38* | −0.07 | −0.02 |
The first column reports percentage of correctly assigned homologous–analogous pairs using a linear combination of 6 main discriminant parameters. The second and third columns show the Pearson correlation coefficients for the dependencies of RMSD and LHM on sequence identity calculated for homologous pairs. The last two columns list Pearson correlation coefficients for the same type of dependencies calculated for analogous pairs of each superfold. Asterisks next to the classification parameters indicate those cases where more than two thirds of homologs and analogs are classified correctly. The folds that have statistically significant linear correlation defined by P-value ≤ 0.01 are indicated by the asterisks next to their correlation coefficients.
As can be seen from Table III, despite the fact that different homologous pairs from the same superfold can belong to different SCOP superfamilies, the overall sequence–structure correlation described by the Pearson correlation coefficient is quite high for homologous pairs and for all but one case can be considered statistically significant. This result is consistent with previous observations about the linear relationship between sequence and structure similarity for families of homologous proteins and suggests similar mutation sensitivities (the amount of structural change per sequence change) among different superfamilies of the same fold.20,21 Interestingly enough, the LHM used as a structural similarity measure for homologous pairs yields almost as high of a correlation as the normalized RMSD, and the squared correlation coefficient (ρ2) can be as high as 0.62 and 0.81 for LHM and RMSD, respectively.
It is also evident from Table III that the sequence–structure correlation observed for analogous pairs of super-folds in general is much lower than is observed for homologous pairs. Comparing the results of discrimination and correlation analysis for the same superfold, one can see that the linear correlation between structure and sequence similarity for analogous pairs is not usually statistically significant for the folds with high discrimination accuracy, suggesting that the SCOP classification in many cases may reflect correct evolutionary relationships between existing proteins. At the same time, superfolds with the notable sequence–structure correlation for analogous pairs, such as cupredoxin, β-trefoil, OB-fold, and the TIM βα-barrel fold (top 4 rows in Table III), show limited discrimination quality between homologs and analogs. This observation supports the hypothesis about the possible common evolutionary origin for all proteins sharing these folds, even though they belong to different SCOP superfamilies.
This conclusion is also supported by the analysis of similarity– dissimilarity in the loop regions for the top superfolds. Figure 1, for example, shows the dependence of the LHM calculated for homologous and analogous pairs of TIM barrels on the sequence divergence. As can be seen from Figure 1, although the correlation between LHM and sequence identity is somewhat more pronounced for homologous pairs, the correlation observed for analogous pairs is also significant, even for sequence identity less than 25%. It should be noted that the correlation coefficients between percent identity and LHM for the top superfold’s analogous pairs are significantly higher than the correlation coefficients obtained with the RMSD measure.
Fig. 1.
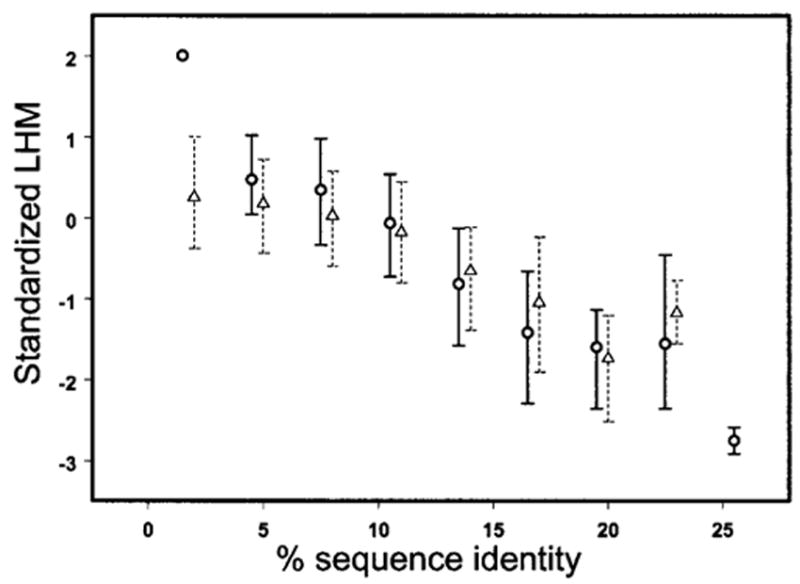
The standardized LHM is plotted against percent identity for homologous pairs (circles) and analogous pairs (triangles) of the TIM-barrel fold. The error bars are extended from the median values to the upper and lower quartiles. LHM is standardized by subtracting the mean value and dividing by the standard deviation of overall LHM distribution for TIM barrel fold pairs.
There is much data from the literature favoring the scenario of divergent evolution for the 4 aforementioned folds. For example, cupredoxin-like folds span a wide range of functions, ranging from electron carrier proteins and oxidases to the blood coagulation factors. The observation that the loop regions in cupredoxins change gradually with respect to the sequence led investigators to conclude that cupredoxins, blue oxidases, and related proteins have probably evolved from a common ancestor.35 Our data support this observation. As can be seen from Table III, the correlation coefficient between percent identity and LHM for cupredoxin’s homologs surpasses the one obtained with the normalized RMSD, which can be explained by the importance of loops of cupredoxin domains in catalysis and interdomain interactions. The correlation obtained with LHM for analogous pairs of this fold (although not supported by as much data as for the homologous pairs) also strongly suggests the common origin of different proteins sharing this fold.
Other investigators have analyzed the statistical significance of sequence similarity in structure–structure superpositions of β-trefoil proteins and concluded that many families sharing this fold, such as fibroblast growth factors, interleukin-1s, Kunitz soybean trypsin inhibitors, ricin-like toxins, and others, are homologous.36 At the same time, it has been demonstrated that many proteins from OB-fold have common features in their topology, nature of the ligands and the fold-related ligand-binding interfaces, all of which suggests an ancient origin of this fold.37 As regards the TIM barrels, statistically significant sequence evidence has been provided to support a common origin of at least 12 of the TIM barrel superfamilies from SCOP.38 The examination of structural alignments of TIM barrel representatives revealed similarity in the structural locations of catalytic residues and common conserved structural features, such as distinct bulges at the end of β-strands.38
Example: The AdoMet-Methyltransferases and Dehydrogenases
To illustrate the usefulness of the LHM, we present an example of presumably analogous proteins, AdoMet-methyltransferases and dehydrogenases. These two classes of proteins are structurally similar according to VAST, but belong to different SCOP fold and superfamily categories. The AdoMet-methyltransferases catalyze the transfer of a methyl group from an S-adenosyl-L-methionine (AdoMet) molecule to various other molecules such as DNA or another protein. The dehydrogenases are typical examples of the Rossmann fold and mostly include oxidoreductases catalyzing the conversion of numerous types of biomolecules. Both the methyltransferases and the dehydrogenases are diverse protein families of ancient origin that participate in a wide range of biochemical processes.
As a specific example, we consider VAST alignments between a methyltransferase (1KPG chain A) and two different dehydrogenases: sorbitol- and alcohol-dehydroge-nases, as shown in Figure 2 (1E3J chain A, 1JVB chain A). Although the sequence identity between the methyltransferase and the dehydrogenases is in the twilight zone at 19%, the common core elements and loop regions display a high degree of structural similarity, with an RMSD under 3.0 Å and LHM under 6.0 Å. There is a large insert in the methyltransferase, as can be seen at the top of Figure 2, but the LHM remains low because of the averaging over the other loops. One can obtain a multiple alignment by reindexing the 2 dehydrogenases with reference to the methyltransferase. The examination of this reindexed alignment reveals an unusual conserved bulge at the end of one β-strand, which corresponds to the conserved sequence motif “xxxGxG” described previously.39 This local structure, which is highlighted in Figure 2, forms a part of the binding pocket for the AdoMet-molecule in the methyltransferases and includes the coenzyme-binding region in dehydrogenases. The conserved sequence motif is thought to maintain the overall position of the coenzyme molecule, although the residues apparently do not directly interact with the ligand.40
Fig. 2.
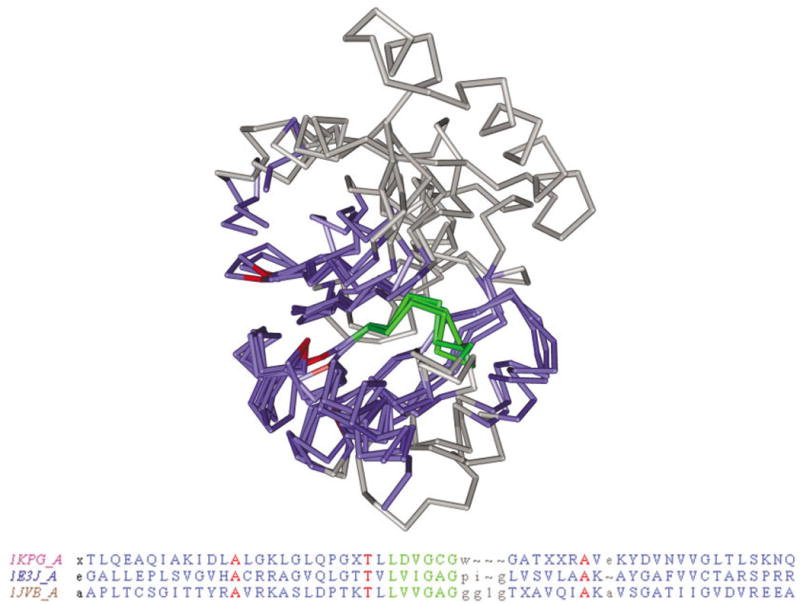
VAST alignments between an AdoMet-methyltransferase (1KPG chain A) and two domains from dehydrogenases: sorbitol dehydrogenase (1E3J chain A domain 2) and alcohol dehydrogenase. The nonaligned residues are shown in gray; aligned residues are colored with blue, red, and green. Red indicates identical sequence types, and an unusual sequence–structure feature involving 6 residues is highlighted by green (pattern “xxxGxG”). Nonaligned N- and C-terminal portions of the chains are not shown.
To analyze the frequency of occurrence of this sequence–structure motif, we searched all domain pairs (including also the VAST neighbors from different SCOP fold categories) for subsequences of 6 aligned residues with sequence motif “xxxGxG,” and with the Cα atom geometry constrained (within 3.0 Å) by a distance matrix derived from the β-bulge. We detected 248 occurrences of this motif among the approximately 10,000 homolog pairs and only 226 occurrences in 28,000 analog pairs defined as VAST neighbors; among the latter, 197 involved methyltransferase– dehydrogenase pairs. Thus, the evidence that we present here hints at a possible evolutionary relationship between the AdoMet methyltransferases and the dehydrogenase domains: their general structural similarity, similarity in the loop regions as shown by the low values of the LHM, conserved sequence motifs, and atypical conserved local conformations in the binding pockets of these proteins. Indeed, this case for homology is also supported by other studies in the literature.41,42
DISCUSSION AND CONCLUSIONS
Here, we have presented a new loop (dis)similarity measure based on the concept of the Hausdorff metric. Our results suggest the exceptional importance of comparative analysis of loop regions in gauging protein relatedness. This conclusion is supported by two key observations. First, the LHM and other loop measures are found to be almost as sensitive as the similarity measures based on the aligned regions in classification of homologous and analogous domain pairs. A linear combination of structure similarity scores based on aligned parts and loop regions (RMSD and LHM) considerably increases the discrimination for our test set compared to the case when the score is calculated from the aligned part alone (RMSD).
Second, we showed that the analysis of correlation between LHM and sequence identity for domain pairs classified as analogous by SCOP supports the model of gradual structural change versus sequence change for 4 superfolds: cupredoxin, β-trefoil, OB-fold, and the TIM βα-barrel. The sequence–structure correlation is statistically significant for these cases, and correlation coefficients are higher if structural similarity is measured by LHM rather than by the RMSD score based on the aligned part.
Indeed, loops apparently do not contribute much to the protein core stability, which, in turn, constitutes the most important constraint in the convergent evolution of structurally similar proteins. Relaxed evolutionary constraints on loops allow them to evolve rapidly and rather independently from the protein core.17 At the same time, potential constraints imposed on loops by the folding requirements of structurally similar but unrelated proteins would manifest themselves mostly in similar loop lengths and not necessarily in loop structural similarity. Therefore, one can speculate that statistically significant linear correlation between evolutionary distance (measured simply as sequence identity in our case) and loop structural similarity may arise only as a result of incremental changes in sequence and structure during divergent evolution. The aforementioned observations, together with the low discrimination quality between homologous and analogous pairs for the top 4 superfolds, allow us to suggest the common evolutionary origin between all protein domains within given folds. Various data from the literature support this hypothesis as well.
We should note, however, that low discrimination quality and high sequence–structure correlation are necessary but not sufficient conditions to hypothesize homology, and structurally similar pairs of homologous proteins should not automatically exhibit the limited classification accuracy and high sequence–structure correlation. For example, SH3 domains evolved through an early horizontal gene transfer between eukaryotes and prokaryotes, with the consequent independent evolution in eukaryota and bacteria.43 It resulted in substantial differences in function between SH3 domains of these two kingdoms, and this distinction has been recorded in the SCOP database, where prokaryotic and eukaryotic domains belong to different superfamilies. Our analysis, in turn, showed that almost all homologous and analogous pairs for the SH3 fold are classified correctly, resulting in 98% discrimination accuracy, although all of them are presumably homologous.
We envision several other practical applications of the LHM. As a measure of structural dissimilarity in non-aligned regions in structure–structure superpositions, it could be used to penalize structurally dissimilar aligned parts or loop regions in scoring the large-scale global structural similarities. It also would be important in clustering protein structures with similar overall topologies but different loop regions, and in evaluating the models obtained in threading or homology modeling. Statistics containing information on gap structural similarity from structure–structure alignments might be used for improving the gap penalties in sequence alignment methods. And last, phylogenetic analysis can benefit from the new scoring function, since it provides an alternative measure of relatedness between structurally similar proteins and presents a means for modeling insertion and deletion processes in evolution of protein structures.
Acknowledgments
We especially thank Stephen Bryant for insightful discussions. We are also grateful to John Spouge, Robert Polozov, and Yuri Wolf for helpful suggestions and remarks.
Footnotes
Grant sponsor: NIH Intramural Research Program.
References
- 1.Murzin AG. How far divergent evolution goes in proteins. Curr Opin Struct Biol. 1998;8:380–387. doi: 10.1016/s0959-440x(98)80073-0. [DOI] [PubMed] [Google Scholar]
- 2.Finkelstein AV, Ptitsyn OB. Why do globular proteins fit the limited set of folding patterns? Prog Biophys Mol Biol. 1987;50:171–190. doi: 10.1016/0079-6107(87)90013-7. [DOI] [PubMed] [Google Scholar]
- 3.Ptitsyn OB, Finkelstein AV. Similarities of protein topologies: evolutionary divergence, functional convergence or principles of folding? Q Rev Biophys. 1980;13:339–386. doi: 10.1017/s0033583500001724. [DOI] [PubMed] [Google Scholar]
- 4.Holm L, Sander C. Decision support system for the evolutionary classification of protein structures. Proc Int Conf Intell Syst Mol Biol. 1997;5:140–146. [PubMed] [Google Scholar]
- 5.Russell RB, Saqi MA, Sayle RA, Bates PA, Sternberg MJ. Recognition of analogous and homologous protein folds: analysis of sequence and structure conservation. J Mol Biol. 1997;269:423–439. doi: 10.1006/jmbi.1997.1019. [DOI] [PubMed] [Google Scholar]
- 6.Holm L, Sander C. Mapping the protein universe. Science. 1996;273:595–603. doi: 10.1126/science.273.5275.595. [DOI] [PubMed] [Google Scholar]
- 7.Russell RB, Saqi MA, Bates PA, Sayle RA, Sternberg MJ. Recognition of analogous and homologous protein folds—assessment of prediction success and associated alignment accuracy using empirical substitution matrices. Protein Eng. 1998;11:1–9. doi: 10.1093/protein/11.1.1. [DOI] [PubMed] [Google Scholar]
- 8.Panchenko AR, Marchler-Bauer A, Bryant SH. Combination of threading potentials and sequence profiles improves fold recognition. J Mol Biol. 2000;296:1319 –1331. doi: 10.1006/jmbi.2000.3541. [DOI] [PubMed] [Google Scholar]
- 9.Flores TP, Orengo CA, Moss DS, Thornton JM. Comparison of conformational characteristics in structurally similar protein pairs. Protein Sci. 1993;2:1811–1826. doi: 10.1002/pro.5560021104. [DOI] [PMC free article] [PubMed] [Google Scholar]
- 10.Russell RB, Barton GJ. Structural features can be unconserved in proteins with similar folds: an analysis of side-chain to side-chain contacts secondary structure and accessibility. J Mol Biol. 1994;244:332–350. doi: 10.1006/jmbi.1994.1733. [DOI] [PubMed] [Google Scholar]
- 11.Matsuo Y, Bryant SH. Identification of homologous core structures. Proteins. 1999;35:70–79. [PubMed] [Google Scholar]
- 12.Qian B, Goldstein RA. Distribution of indel lengths. Proteins. 2001;45:102–104. doi: 10.1002/prot.1129. [DOI] [PubMed] [Google Scholar]
- 13.Altschul SF. Generalized affine gap costs for protein sequence alignment. Proteins. 1998;32:88–96. [PubMed] [Google Scholar]
- 14.Wrabl JO, Grishin NV. Gaps in structurally similar proteins: towards improvement of multiple sequence alignment. Proteins. 2004;54:71–87. doi: 10.1002/prot.10508. [DOI] [PubMed] [Google Scholar]
- 15.Benner SA, Cohen MA, Gonnet GH. Empirical and structural models for insertions and deletions in the divergent evolution of proteins. J Mol Biol. 1993;229:1065–1082. doi: 10.1006/jmbi.1993.1105. [DOI] [PubMed] [Google Scholar]
- 16.Pascarella S, Argos P. Analysis of insertions/deletions in protein structures. J Mol Biol. 1992;224:461–471. doi: 10.1016/0022-2836(92)91008-d. [DOI] [PubMed] [Google Scholar]
- 17.Blouin C, Butt D, Roger AJ. Rapid evolution in conformational space: a study of loop regions in a ubiquitous GTP binding domain. Protein Sci. 2004;13:608–616. doi: 10.1110/ps.03299804. [DOI] [PMC free article] [PubMed] [Google Scholar]
- 18.Chothia C, Lesk AM. The relation between the divergence of sequence and structure in proteins. EMBO J. 1986;5:823–826. doi: 10.1002/j.1460-2075.1986.tb04288.x. [DOI] [PMC free article] [PubMed] [Google Scholar]
- 19.Hubbard TJ, Blundell TL. Comparison of solvent-inaccessible cores of homologous proteins: definitions useful for protein modelling. Protein Eng. 1987;1:159–171. doi: 10.1093/protein/1.3.159. [DOI] [PubMed] [Google Scholar]
- 20.Wood TC, Pearson WR. Evolution of protein sequences and structures. J Mol Biol. 1999;291:977–995. doi: 10.1006/jmbi.1999.2972. [DOI] [PubMed] [Google Scholar]
- 21.Koehl P, Levitt M. Sequence variations within protein families are linearly related to structural variations. J Mol Biol. 2002;323:551–562. doi: 10.1016/S0022-2836(02)00971-3. [DOI] [PMC free article] [PubMed] [Google Scholar]
- 22.Berman HM, Bhat TN, Bourne PE, Feng Z, Gilliland G, Weissig H, Westbrook J. The Protein Data Bank and the challenge of structural genomics. Nat Struct Biol. 2000;(Suppl 7):957–959. doi: 10.1038/80734. [DOI] [PubMed] [Google Scholar]
- 23.Chen J, Anderson JB, DeWeese-Scott C, Fedorova ND, Geer LY, He S, Hurwitz DI, Jackson JD, Jacobs AR, Lanczycki CJ, Liebert CA, Liu C, Madej T, Marchler-Bauer A, Marchler GH, Mazumder R, Nikolskaya AN, Rao BS, Panchenko AR, Shoemaker BA, Simonyan V, Song JS, Thiessen PA, Vasudevan S, Wang Y, Yamashita RA, Yin JJ, Bryant SH. MMDB: Entrez’s 3D-structure database. Nucleic Acids Res. 2003;31:474–477. doi: 10.1093/nar/gkg086. [DOI] [PMC free article] [PubMed] [Google Scholar]
- 24.Madej T, Gibrat JF, Bryant SH. Threading a database of protein cores. Proteins. 1995;23:356–369. doi: 10.1002/prot.340230309. [DOI] [PubMed] [Google Scholar]
- 25.Murzin AG, Brenner SE, Hubbard T, Chothia C. SCOP: a structural classification of proteins database for the investigation of sequences and structures. J Mol Biol. 1995;247:536–540. doi: 10.1006/jmbi.1995.0159. [DOI] [PubMed] [Google Scholar]
- 26.Gibrat JF, Madej T, Bryant SH. Surprising similarities in structure comparison. Curr Opin Struct Biol. 1996;6:377–385. doi: 10.1016/s0959-440x(96)80058-3. [DOI] [PubMed] [Google Scholar]
- 27.Sander C, Schneider R. Database of homology-derived protein structures and the structural meaning of sequence alignment. Proteins. 1991;9:56–68. doi: 10.1002/prot.340090107. [DOI] [PubMed] [Google Scholar]
- 28.McLachlan AD. Gene duplications in the structural evolution of chymotrypsin. J Mol Biol. 1979;128:49–79. doi: 10.1016/0022-2836(79)90308-5. [DOI] [PubMed] [Google Scholar]
- 29.Cohen FE, Sternberg MJ. On the prediction of protein structure: the significance of the root-mean-square deviation. J Mol Biol. 1980;138:321–333. doi: 10.1016/0022-2836(80)90289-2. [DOI] [PubMed] [Google Scholar]
- 30.Preparata FP, Shamos MI. Computational geometry, an introduction. New York: Springer-Verlag; 1985. [Google Scholar]
- 31.Flury B. Common principal component and related multivariate models. New York: Wiley; 1988. [Google Scholar]
- 32.Dietmann S, Holm L. Identification of homology in protein structure classification. Nat Struct Biol. 2001;8:953–957. doi: 10.1038/nsb1101-953. [DOI] [PubMed] [Google Scholar]
- 33.Dietmann S, Fernandez-Fuentes N, Holm L. Automated detection of remote homology. Curr Opin Struct Biol. 2002;12:362–367. doi: 10.1016/s0959-440x(02)00332-9. [DOI] [PubMed] [Google Scholar]
- 34.Kawabata T, Nishikawa K. Protein structure comparison using the Markov transition model of evolution. Proteins. 2000;41:108–122. [PubMed] [Google Scholar]
- 35.Murphy ME, Lindley PF, Adman ET. Structural comparison of cupredoxin domains: domain recycling to construct proteins with novel functions. Protein Sci. 1997;6:761–770. doi: 10.1002/pro.5560060402. [DOI] [PMC free article] [PubMed] [Google Scholar]
- 36.Ponting CP, Russell RB. Identification of distant homologues of fibroblast growth factors suggests a common ancestor for all beta-trefoil proteins. J Mol Biol. 2000;302:1041–1047. doi: 10.1006/jmbi.2000.4087. [DOI] [PubMed] [Google Scholar]
- 37.Arcus V. OB-fold domains: a snapshot of the evolution of sequence, structure and function. Curr Opin Struct Biol. 2002;12:794–801. doi: 10.1016/s0959-440x(02)00392-5. [DOI] [PubMed] [Google Scholar]
- 38.Copley RR, Bork P. Homology among (βα)(8) barrels: implications for the evolution of metabolic pathways. J Mol Biol. 2000;303:627–641. doi: 10.1006/jmbi.2000.4152. [DOI] [PubMed] [Google Scholar]
- 39.Malone T, Blumenthal RM, Cheng X. Structure-guided analysis reveals nine sequence motifs conserved among DNA amino-methyltransferases, and suggests a catalytic mechanism for these enzymes. J Mol Biol. 1995;253:618–632. doi: 10.1006/jmbi.1995.0577. [DOI] [PubMed] [Google Scholar]
- 40.Oppermann U, Filling C, Hult M, Shafqat N, Wu X, Lindh M, Shafqat J, Nordling E, Kallberg Y, Persson B, Jornvall H. Short-chain dehydrogenases/reductases (SDR): the 2002 update. Chem Biol Interact. 2003;143–144:247–253. doi: 10.1016/s0009-2797(02)00164-3. [DOI] [PubMed] [Google Scholar]
- 41.Tran PH, Korszun ZR, Cerritelli S, Springhorn SS, Lacks SA. Crystal structure of the DpnM DNA adenine methyltransferase from the DpnII restriction system of Streptococcus pneumoniae bound to S-adenosylmethionine. Structure. 1998;6:1563–1575. doi: 10.1016/s0969-2126(98)00154-3. [DOI] [PubMed] [Google Scholar]
- 42.Bujnicki JM. Comparison of protein structures reveals monophyletic origin of the AdoMet-dependent methyltransferase family and mechanistic convergence rather than recent differentiation of N4-cytosine and N6-adenine DNA methylation. In Silico Biol. 1999;1:175–182. [PubMed] [Google Scholar]
- 43.Ponting CP, Aravind L, Schultz J, Bork P, Koonin EV. Eukaryotic signalling domain homologues in archaea and bacteria: ancient ancestry and horizontal gene transfer. J Mol Biol. 1999;289:729–745. doi: 10.1006/jmbi.1999.2827. [DOI] [PubMed] [Google Scholar]