

Abstract
We sought to establish whether heme-thiolate monooxygenases oxidize α,β-unsaturated aldehydes generated during lipid peroxidation. Several recombinant P450s co-expressed with NADPH:P450 oxidoreductase were surveyed for aldehyde oxidation activity with anthracene-9-carboxaldehyde and 4-hydroxy-trans-2-nonenal (HNE). Murine P4502c29, human P4503A4, human P4502B6, and rabbit P4502B4 were good catalysts of aldehyde oxidation to carboxylic acids. Other P450s (e.g., P4501A2, 2E1 and 2J2) did not oxidize these aldehydes. P4502c29 and P4503A4 displayed Km/S0.5 values of approx. 1-20 μM. The product measured by HPLC that comigrates with authentic 4-hydroxynonenoic acid (HNA) had a mass spectrum identical to the standard. Using P4502c29, HNE was a mixed-competitive inhibitor of anthracene-9-carboxaldehyde oxidation, suggesting that both aldehydes are substrates for P4502c29. Specific inhibitors of aldehyde dehydrogenases and P450 were used to assess their role in the metabolism of HNE in primary rat hepatocytes. Inhibitors of aldehyde dehydrogenase (cyanamide) inhibited HNA formation by 60% and together cyanamide and miconazole (P450) caused over 85% inhibition of HNA formation. P450s are significant participants in metabolism of endogenous and exogenous unsaturated aldehydes in primary rat hepatocytes.
Keywords: P450; α,β-unsaturated aldehydes; carboxylic acids; anthracene-9-carboxaldehyde; 4-hydroxynonenal
Introduction
α,β-Unsaturated aldehydes are highly reactive molecules formed by biological and chemical processes. These compounds include aldehydes, e.g., 2-propenal (acrolein), trans-2-hexenal, and 4-hydroxy-trans-2-nonenal (HNE). Acrolein is a toxic environmental aldehyde, formed by combustion processes or metabolism of drugs like cyclophosphamide [1]. It is among the most chemically reactive aldehydes known. Trans-2-hexenal is a major plant natural product formed from oxidation of linolenic acid that provides the odor of apples and its closely related form is cis-2-hexanal which accounts for the smell of freshly cut grass. In vitro, HNE can be generated from the 9- and 13-hydroperoxides of the ω-6 polyunsaturated fatty acid (18:2, 20:4) linoleic acid [2,3]. The concentration of HNE is significantly increased in plasma, various organs, and cell types including liver cells under conditions of oxidative stress [3,4]. Significant levels of HNE (1-5 μM) generated during oxidative stress have been shown to be associated with onset and progression of cardiovascular and neurodegenerative diseases [5,6]. For example, modification of low density lipoproteins by HNE renders this lipoprotein more atherogenic and results in foam cell formation. Moreover, HNE-modified proteins have been detected in atherogenic lesions [7]. At low μM concentrations, HNE affects cell proliferation and shows genotoxic effects [8]. Unsaturated aldehydes are also prevalent in the environment and they display toxic effects in μM concentrations [3,5,6].
Because of their possible pathophysiological relevance, attention has been focused during the last decade on the ability of mammals to metabolize aldehydes, including HNE. In vitro, metabolic studies carried out with rat liver subcellular fractions showed that HNE was reduced to 1,4-dihydroxy-2-nonene (DHN) by cytosolic alcohol dehydrogenase [9] and oxidized by aldehyde dehydrogenases to 4-hydroxy-2-nonenoic acid (HNA). In addition to these products, the glutathione-HNE conjugates were rapidly formed during incubation of HNE with hepatocytes, enterocytes, and tumor cells [10,11]. In a study carried out after intravenous injection of HNE into rats, four mercapturic conjugates were characterized in the urine, namely 1,4-dihydroxynonene mercapturic acid, 4-hydroxynonenal mercapturic acid, 4-hydroxynonenoic acid mercapturic acid, and the corresponding lactone mercapturic acid derivatives [12]; glutathione conjugates of HNE and 1,4-dihydroxynonene were also observed. These results were further confirmed by De Zwart et al. [13], demonstrating that conjugation of HNE with GSH is a high capacity, first pass metabolic step in the elimination of this aldehyde.
Cytochrome P450s (P450) are enzymes that oxidize drugs and a wide variety of endogenous and exogenous compounds. They are integral membrane-bound heme-containing proteins, localized in the endoplasmic reticulum of hepatocytes [14] and extrahepatic tissues as a complex with NADPH:P450 oxidoreductase [15]. A number of reports have demonstrated that exposure to high concentrations of aldehydes, e.g. HNE, inactivate these hemoproteins in a mechanism-based reaction [16]. The potency of inactivation by HNE among P450s is varied, with P4502B4 and P4502B1 being inactivated to the greatest extent and 2C3, 1A2, 2E1, and 1A1 to a lesser extent. The Kinactivation for HNE is normally greater than 0.3 mM for these P450s. However, levels of lipid-derived aldehydes probably do not normally attain sufficiently high levels in vivo to cause extensive inactivation of the P450s. A role for cytochrome P450s in oxidative metabolism of endogenous and exogenous α,β-unsaturated aldehydes has not been fully established. In this study, we demonstrate that mammalian cytochrome P450s, namely, mouse P4502c29, and human P4503A4 and P4502B6, and rabbit P4502B4, catalyze the fascile oxidation of α,β-unsaturated aldehydes to their carboxylic acids at low μM concentrations of aldehyde substrate, while inactivation occurs at higher concentrations. Using mouse liver microsomes and primary hepatocytes in conjunction with selective P450 inhibitors, we show that, in addition to aldehyde dehydrogenase, hepatic P450s, such as P4502c29 and P4503a participate significantly in oxidative metabolism of these aldehydes and display low Km values for these reactions.
Materials and Methods
Chemicals and plasmids
An expression plasmid for murine P4502c29 was provided by J.A. Goldstein, National Institutes of Environmental Health Sciences, Research Triangle Park, NC [17]. The NADPH: P450 oxidoreductase expression plasmid was provided by Mark Doll and David Hein, Department of Pharmacology and Toxicology, University of Louisville School of Medicine. Preparations of Escherichia coli membranes containing recombinant NADPH:P450 oxidoreductase and either P4501A2, 2B6, 2E1, or 3A4 were prepared as described [18]. In these preparations, the ratio P450 to NADPH:P450 oxidoreductase was noted to be 0.8-2.0. Human P4502J2 and NADPH:P450 oxidoreductase expressed in insect cells was generously provided by Darryl Zeldin, National Institutes of Environmental Health Sciences, Research Triangle Park, NC. Anthracene-9-carboxaldehyde (9-AA) and anthracene-9-carboxylic acid (9-ACA) were purchased from Sigma-Aldrich Chem. St. Louis, MO and dissolved in DMSO before use. 3H-HNE was prepared as described previously [6], and HNE was purchased from Calbiochem, San Diego, CA. The HNA standard was generated by incubating HNE with yeast aldehyde dehydrogenase (Sigma Chemical Co., St. Louis, MO) and, after monitoring NAD+ reduction for completion of the reaction, the products were extracted into ethyl acetate (6,11).
E. coli growth conditions
Glycerol stocks containing dual expression plasmids, pCW2c29 and pACYC-1 Duet rat NADPH:P450 reductase gene in E. coli BL21 (DE3) served as innoculum for the expression experiment. Cells were grown overnight with vigorous shaking (250 rpm) at 37 °C in Luria broth containing 54 mg/mL of ampicillin and 34 mg/mL chloramphenicol. A 1/1000 dilution of E. coli cells was made into 500 mL of Terrific Broth and grown at 37 °C to an optical density of 0.6 at 600 nm. One hour prior to induction, the growth medium was supplemented with 0.5 mM δ-aminolevulinic acid. Enzyme expression was then induced with 1 mM isopropyl-β-D-thiogalactopyranoside and the culture moved to 30 °C at 190 rpm. After 48 h, the cells were harvested by centrifugation at 5000g for 10 min. The cell pellet was suspended in 100 mM Tris buffer, pH 7.8, containing 20 % glycerol (v/v), and 0.5 mM EDTA to achieve a volume equal to 15 % of the original volume of culture. The membranes (spheroplasts) were prepared as described with some modifications [19].
Preparation of mouse liver microsomal fractions
Male C57BL/6J mice (22 g to 27 g; Jackson Laboratories, Bar Harbor, MA) were fed ad libitum for 1 week with AIN76A diet (Purina Test Diet, Richmond, IN). All procedures were approved by the University of Louisville IACUC Committee and conform to the Public Health Service Policy on Humane Care and Use of Laboratory Animals. Animals were euthanized and the livers were perfused with ice-cold 0.9 % NaCl solution. Microsomes were prepared from liver by differential centrifugation [20].
Protein and P450 Assays
Total protein concentrations were determined by measuring formation of bicinchoninic acid-Cu+ complex at 562 nm (Pierce Chemical Co., Rockville, IL) . P450 content was determined using the CO-difference spectra of dithionite reduced P450 [21] using a Varian Model 50 spectrophotometer (Varian, Palo Alto, CA). The P450 content of liver microsomal fractions from untreated C57BL/6J mice was 0.23 nmol/mg.
Preparation of rat hepatocytes
Male Sprague-Dawley rats (180-200g; Hsd:SD, Harlan Indianapolis, IN) were used for liver perfusion as described previously [22]. Cell survival was determined by trypan blue exclusion [23] and hepatocytes having viability >90% were used for metabolism studies. The cells (0.5 × 10⁶ cells/mL) were placed in Williams E-F12 medium and placed in a shaking waterbath at 37 °C. HNE (50 μM) was added to the cells and the reactions were terminated at 0, 10, and 20 min with trichloroacetic acid (TCA) to achieve 7.5% TCA concentration. The resulting samples were frozen at -80° C prior to analysis by HPLC as described below. The inhibitors (0.5 mM miconazole, phenytoin, or cyanamide) were added just prior to HNE. When 0.5 mM troleandomycin was added as an inhibitor to the hepatocytes, the cells were incubated with troleandomycin 10 min prior to adding HNE.
Purification of rabbit liver cytochrome P4502B4 and NADPH:P450 oxidoreductase
P4502B4 was purified from rabbit liver as described by Dean and Gray [24] to a purity of approximately 18 nmol hemoprotein/mg protein. Rabbit liver NADPH: P450 oxidoreductase was purified by the method of Yasukochi and Masters [25] to a specific activity of 38.2 μmol cytochrome c reduced per min per mg flavoprotein. Both preparations displayed a single major protein band upon analysis by SDS-PAGE.
Cytochrome P450 activity assay
P4503A activity was determined in mouse liver microsomes by measuring O-dealkylation of the benzyl ether of resorufin to the fluorescent product, resorufin [26]. Reactions were carried out at 37°C in 2 mL volume with 1 mM NADPH, and 0.25 mg/mL (50 nM P450) microsomal protein in 0.1 M potassium phosphate buffer, pH 7.4. The production of resorufin was monitored at an excitation wavelength of 535 nm and emission wavelength of 586 nm with a luminescence spectrometer (Model LS50B, Perkin-Elmer, Boston, MA). A standard curve for the product, resorufin, was constructed to calculate enzyme activity normalized to microsomal protein concentration.
Anthracene-9-carboxaldehyde oxidation assay
The oxidation of anthracene-9-carboxaldehyde (9-AA) by P450 enzymes (Figure 1) was determined by measuring the formation of anthracene-9-carboxylic acid (9-ACA) as described by Watanabe et al. [27] and Marini et al. [28]. In brief, the incubation mixture included recombinant P450s (50 nM) or mouse liver microsomes (0.25 mg/mL, ∼50 nM P450), an NADPH-regenerating system consisting of 0.25 mM NADPH, 4.25 mM isocitric acid, 50 mM MgCl2, and 1.3 Units/mL isocitrate dehydrogenase, 0.025 mM 9-AA, and 0.1 M potassium phosphate buffer, pH 7.4. The reaction was carried out at 30 °C for 10-30 min and terminated with 1 mL of 0.5 N NaOH. Unmetabolized substrate was extracted with 4 mL ethyl acetate. Oxidized product was extracted from 1 mL of aqueous phase with 4 mL ethyl acetate following acidification with 1 mL of 0.5 N HCl. The fluorescence of the organic phase was measured with a spectrofluorimeter (Model LS50B, Perkin-Elmer, Boston, MA) and 9-ACA formation determined at 255 nm excitation and 458 nm emission wavelengths. The fluorescence excitation and emission spectra of the metabolites was nearly identical to authentic anthracene-9-carboxylic acid. The 9-AA oxidation assay was used as an initial indication of aldehyde metabolism by P450s.
Figure 1. Oxidation of α,β-unsaturated aldehyde substrates to carboxylic acids.

A. anthracene-9-carboxaldehyde. B. 4-hydroxy-trans-2-nonenal.
Metabolism of HNE by P450s
HNE metabolism (Figure 1) was performed by incubating 50 μM [3H] HNE with either E. coli expressed P450 (50 nM) or mouse microsomal protein (0.25 mg/mL, ∼50 nM P450). Incubations were carried out in 0.1 M potassium phosphate buffer, pH 7.6, containing 0.5 mM NADPH in a 1 mL reaction volume for 20 min at 37 °C in a waterbath with orbital shaking at 200 rpm. The NADPH regenerating system with HNE was not used with HNE due to the formation of additional analytes associated with the isocitrate/isocitrate dehydrogenase mixture. Recombinant P450s (50 nM), purified rabbit P4502B4 (200 nM P450 plus 600 nM NADPH:P450 oxidoreductase) or mouse liver microsomes (0.25 mg protein/mL) were analyzed for aldehyde oxidation activity. The reaction was initiated by adding 50 μM [3H] HNE. The reactions were terminated after 20 min incubation by flash freezing sample tubes in liquid nitrogen. The frozen samples were thawed upon adding TCA and the protein fraction sedimented at 13,000g for 5 min at 4 °C. The supernatant was injected onto the HPLC column after an aliquot was removed to measure radioactivity in a Packard Tricarb 2100TR scintillation counter (Packard Instrument Co., Downers Grove, IL) with Ultimagold (Packard Instrument Co., Downers Grove, IL) as the scintillation cocktail prior to separation by high performance liquid chromatography. The recovery of [3H] radioactivity from the reaction mixtures were > 98% and the recoveries from HPLC were determined to be > 95%. All of the P450s displayed linear reactions to 20 min with HNE.
Inhibition of aldehyde metabolism by P450 inhibitors
Metabolic assays with either 9-AA or HNE were performed with either membranes containing expressed P450 or mouse liver microsomes as described above, except for the addition of selective inhibitors. Miconazole, phenytoin and troleandomycin (0.5 mM) were used to inhibit P4502c29 and P4503a, while , and cyanamide was used as an inhibitor of aldehyde dehydrogenase, respectively. Miconazole (0.5 mM) was utilized as a general inhibitor of P450. Troleandomycin was preincubated with microsomal or expressed P450 fractions and NADPH for 10 min before 9-AA or [3H]HNE was added. Miconazole, phenytoin, and cyanamide were added to the reaction immediately prior to aldehyde substrate.
Kinetic analysis of 9-AA metabolism by P4502c29
The reaction contained prepared sonicated membranes (containing both 50 nM P4502c29 and approx. 100 nM NADPH:P450 oxidoreductase), 0.1 M potassium phosphate buffer pH 7.4, and the NADPH-regenerating system. The membranes were co-incubated with 50 μM or 100 μM HNE and increasing concentrations of 9-AA for 10 min at 30 °C shaking at 200 rpm. The reaction was terminated with 0.1 M NaOH and product extracted with ethyl acetate as described above. Fluorimetric measurements were performed as described above. Analysis of the data was performed using the Kineti77 program [29].
High performance liquid chromatography
The HPLC system consisted of a Waters automated gradient controller with dual model 510 pumps (Milford, MA), a Waters manual injector (2 mL loop) and a C18 reversed phase column (5 μM, 250 mm × 4.6 mm Varian, Walnut Creek, CA) connected to a radioactivity detector (Radiometric Flo-one ß model A-515 detector, Packard Instrument Co., Downers Grove, IL) or to a fraction collector (Biorad Model 2210 Biorad, Hercules, CA). The mobile phase was a linear gradient ranging from 100 % solvent A (0.1 % (v/v) TFA in water) to 100 % solvent B (40 % solvent A, 60 % acetonitrile). Solvents were delivered at a flow rate of 1 mL/min for 75 min as follows: linear gradients from 100 % to 76 % solvent A (0-15 min), from 76 % A to 74 % A (15-40 min), from 74% to 40% A (40-45 min), from 40% to 0% A (45-60 min), and then eluted with 100 % A (60-75 min). The conditions were changed to 100% A over 10 minutes prior to starting the next run. The incubation and HPLC analysis were performed in triplicate.
Gas Chromatography-Mass Spectrometry of HNE Metabolites
For GC-MS analyses, the samples were derivatized in 20 μL of acetonitrile with 20 μL of N,O-bis(trimethylsilyl)-trifluoroacetamide (BSTFA) for 1 h at 60 °C as described previously [30]. The mixture was cooled to room temperature and 1 μL aliquots were used for analysis. The GC-EI/MS analysis was performed using an Agilent 6890/5973 GC/MS system (Agilent Technologies) under 70 eV electron ionization conditions. The compounds were separated on a bonded phase capillary column (DB-5MS, 30 m × 0.25 mm ID × 0.25 μM film thickness from J7W Scientific Folsom, CA, USA. The GC injection port and interface temperature were set to 280 °C, with helium gas (carrier) maintained at 14 psi. Injections were made in the splitless mode with the inlet port purged for 1 min following injection. The GC oven temperature was held initially at 100°C for 1 min, then increased at a rate of 10 °C min-1 to 280 °C, which was held for 5 min. Under these conditions, the retention time for HNA derivative was 9.67 min .
Statistical analysis
Experiments were conducted in triplicate and the means and standard deviations (SD) were determined. Where appropriate a Student’s t-Test was used for statistical analysis with p ≤ 0.05 as the criterion for significance.
RESULTS
Evaluation of P450s capable of catalyzing anthracene-9-carboxaldehyde oxidative metabolism to its carboxylic acid product
Watanabe et al. [31] showed that P4502c29 is an aldehyde oxygenase utilizing a cannabinoid aldehyde at low μM concentrations as a substrate. Therefore, we sought to evaluate the ability of a number of P450s for their ability to oxidize a synthetic aldehyde substrate, 9-AA [27, 28]. Several P450s rapidly metabolized the aldehyde compound, while others apparently did not oxidize this aldehyde to its carboxylic acid (Table 1). For example, 9-AA oxidation activity for human P4503A4, human 2B6, and mouse P4502c29 was appreciable, while the ability of P4501A2, 2B4, 2E1 and 2J2 to oxidize this model aldehyde was negligible. There were also significant levels of activity seen with liver microsomes from mice (1.5 nmol/min/nmol P450).
Table 1.
Catalytic activities of mouse and human P450s expressed in E. coli
| P450 | 9-AA Oxidation Activity (nmol/min/nmol P450) | HNA formation (nmol/min/nmol P450) |
|---|---|---|
| P4502c29 | 7.4 | 0.96 |
| P4503A4 | 7.6 | 2.39 |
| P4502B6 | 2.3 | 0.13 |
| P4502B4 | ND | 0.36 |
| P4502J2 | <0.1 | <0.1 |
| P4501A2 | <0.1 | <0.1 |
| P4502E1 | <0.1 | <0.1 |
| Microsomes | 1.5 | 0.37 |
The activities are expressed as turnover numbers, means of 4 assays with SD < 5% of the average. Mouse liver microsomal fractions were prepared from animals fed AIN76A diet for 7 days. The concentration of 9-AA used was 25 μM and of HNE was 50 μM. ND, not detected.
We sought to determine the kinetics of anthracene-9-carboxaldehyde (9-AA) oxidative metabolism by murine P4502c29, as well as the human P4503A4 (Figure 2). The P450s were incubated with varying concentrations of 9-AA at 30 °C and subsequently analyzed to determine the Km for 9-AA oxidation to 9-ACA. 9-ACA is the fluorescent oxidative metabolite of 9-AA that can be easily measured by its fluorescence excitation at 255 nm and emission at 458 nm. Recombinant mouse P4502c29 expressed with NADPH:P450 oxidoreductase in E. coli membranes oxidized 9-AA to 9-ACA with a Kcat of 7.4 min-1 and a Km of 0.7-0.9 μM with apparent normal Michaelis-Menten kinetics, while human P4503A4 had a Kcat of 7.6 min-1 and an S0.5 of 15 μM and displayed positive cooperativity with the substrate. These reactions were inhibited by more than 98 % by addition of either 0.5 mM miconazole or by omission of NADPH from the reaction mixture (results not shown).
Figure 2. Concentration-dependence of oxidative metabolism of anthracene-9-carboxaldehyde by P4502c29 and P4503A4.

The concentration of the substrate 9-AA was varied and the initial rates of oxidation were measured in the presence of an NADPH-regenerating system, NADPH, and either recombinant P4502c29 or P4503A4 and NADPH:P450 oxidoreductase. The P450 concentrations were 50 nM and both P450s were expressed into E. coli membranes with their flavoprotein oxidoreductase, NADPH:P450 oxidoreductase. The data were averages collected in triplicate and analyzed using a double reciprocal plot the Km/S0.5 values are shown. The control activities are shown in Table 2.
Analysis of HNE metabolites generated by CYPs
HPLC and gas chromatography-mass spectrometry were used to characterize the oxidative metabolites of HNE formed by various recombinant cytochromes P450 (Figure 3C). [3H]-HNE at concentration of 50 μM was incubated with several of the P450s and NADPH-P450 oxidoreductase for 20 min in the presence of NADPH. Preliminary experiments with the recombinant samples demonstrated that the rates of HNE metabolism were linear for this time period. A representative chromatogram of HNE and its metabolites separated by HPLC when oxidized in a reconstituted system containing 200 nM purified rabbit P4502B4, 600 nM NADPH:P450 oxidoreductase, 50 μM dilauryl phosphatidylcholine, 0.5 mM NADPH, and 50 μM HNE is shown (Figure 3C). Spontaneous decomposition of HNE during the extraction and resolution procedure was minimal, as shown by the limited formation of any analytes that were retained slightly longer than HNE at the zero time point (Figure 3A). Moreover, when NADPH-P450 oxidoreductase and dilauroylphosphatidyl choline were reconstituted in the absence of P450, little product was formed (Figure 3B). Identical results were obtained when either the NADPH, the oxidoreductase, or P4502B4 was omitted (results not shown). When all three components were reconstituted over a 20 min incubation period, 3 % of the total [3H] HNE was converted to a product with a retention time (tR) of 56 minutes (Figure 3C, Table 1), indicating that this rabbit P450 effectively metabolized HNE to one major product. Based on the co-migration of the authentic HNA standard generated with yeast aldehyde dehydrogenase, we tentatively assigned the identity of the product with a retention time (tR) generated by P4502B4 to 4-hydroxy-nonenoic acid (Figure 3C). An unknown metabolite (3 % conversion, putative lactone) eluted slightly more slowly than the substrate HNE (tR 60 min for the unknown and tR 58 min for HNE); this analyte was present at zero time with purified, reconstituted P4502B4 and did not increase with time. Inclusion of 0.5 mM miconazole as a P450 inhibitor with the fully reconstituted P4502B4 system completely inhibited HNA formation, but had little or no effect on the amount of unknown product generated (Figure 3D), suggesting that it may not be generated enzymatically. NADPH and HNE incubated alone for 20 min did not result in analytes other than the small amount of an unknown metabolite (data not shown). These results demonstrate that reconstitution of purified rabbit P4502B4 with NADPH:P450 oxidoreductase and lipid results in metabolism of HNE to its carboxylic acid, HNA. Similar results were obtained with other P450s tested using 3H-HNE, except that several P450s displayed products eluting in the region near that seen with the unknown metabolite and several displayed products more polar than HNA. The characterization of these reactions will be described elsewhere. These results demonstrate that P4502B4 forms 4-hydroxynonenoic acid, HNA, as a metabolite of HNE.
Figure 3. The reconstitution of HNE oxidation catalyzed by rabbit cytochrome P4502B4.
Purified rabbit P4502B4 was used to catalyze the NADPH-dependent oxidation of 50 μM [3H]HNE in the presence of purified NADPH:P450 oxidoreductase and dilaurylphosphatidylcholine at 37 °C. The P4502B4 concentration was 200 nM and the amount of NADPH:P450 oxidoreductase (600 nM) was that amount to cause maximal 7-benzyloxyresufin debenzylation in the presence of dilaurylphosphatidylcholine (data not shown). The reaction was linear to 20 min. After terminating the reactions with an equal volume of 1% TFA in water, HNE and its products were analyzed by HPLC with a radiochemical detector (Methods). A, Zero time sample; B, 20-min time point with oxidoreductase reconstituted with dilaurylphosphatidylcholine; C, 20-min time point with reconstituted P4502B4, oxidoreductase and dilaurylphosphatidylcholine; D, 20-min time point with reconstituted P4502B4, oxidoreductase and dilaurylphosphatidylcholine in the presence of 0.5 mM miconazole.
Mass spectral analysis of products of aldehyde oxidation by P450s
Based on the fluorescence spectra of the products formed from 9-AA, the products in the alkaline phase of the reaction appear to be identical to that of the carboxylic acid 9-ACA, demonstrating the identity of the product of the oxidation of 9-AA. However, in order to validate that the major product formed from HNE is 4-hydroxy-2-nonenoic acid (HNA), we used HPLC to analyze the ability of P4502c29, P4503A4, P4502B4, and P4502B6 to metabolize HNE to its carboxylic acid. The product that co-migrates on HPLC analysis with the ALDH-biosynthesized carboxylic acid metabolite was collected and derivatized with N-methyl-N-(t-butylidimethylsilyl)-trifluoroacetamide prior to analysis by GC-MS. The mass spectra of the ALDH-biosynthesized product, HNA, is identical to that of the putative HNA product formed by P4502c29 (Figure 4). A faint parent peak was noted at m/z 316, and major ions at m/z of 301 (M-CH3) and at m/z 245 (M-C5H11). The mass spectra of the products formed by P4503A4 and P4502B2 were nearly identical to that observed in the presence of P4502c29 (data not shown), documenting that a primary oxidation product formed from HNE by several P450s was identified as HNA, the expected oxidation product.
Figure 4. Mass spectra of HNA generated from P4502c29-dependent metabolism of [3H]HNE and NADPH.

Samples obtained during the metabolism of P4502c29 and NADPH:P450 oxidoreductase in membranes obtained from the E. Coli expression system were analyzed by HPLC and the fractions co-eluting with HNA were collected, the products extracted with methylene chloride and, after derivatization, subjected to gas chromatography/mass spectral analysis as described in Methods. A, Authentic HNA; B, HNA produced by Cyp2c29.
Evaluation of P450s in oxidative metabolism of HNE to form its carboxylic acid products
Using a fixed concentration of 50 μM HNE, we examined several P450s as catalysts for oxidation of this aldehyde to its carboxylic acid. After metabolism, the products were analyzed by HPLC with radiometric product detection (Figure 3, see Methods). The reactions with either P4502c29 or 3A4 were shown to be linear to 20 min with 50 μM HNE substrate. In addition to the reconstituted rabbit P450, some human and murine P450s also catalyzed HNE metabolism (Table 1). The rates of HNE oxidation shown in Table 1 were in the order of P4503A4>2c29>2B6-2B4. P4501A2, 2E1 and 2J2 were analyzed and they did not appreciably oxidize HNE (Table 1).
Kinetic Analysis of HNE-inhibition of 9-ACA metabolism catalyzed by P4502c29
The fact that P4502c29 mediated the oxidation of both 9-AA and HNE to their carboxylic acids led us to measure the steady-state kinetic parameters for P4502c29 oxidation of 9-ACA formation in the presence of increasing concentrations of HNE. Previous studies by Coon and coworkers established that P4502E1 is inactivated at high concentrations of HNE (140-400 μM [16]), providing a direct tool for us to determine the mechanism of HNE as an inhibitor of 9-ACA formation by P4502c29. Since α,β-unsaturated aldehydes may inactivate these P450s, we incubated most of the P450s shown in Table 1 with 4-hydroxynonenal, acrolein, and trans-2-hexenal to assess whether they are irreversible inhibitors (data not shown). After 20 minutes incubation, the samples were diluted 10-fold and the 9-ACA formation or other enzyme assay measured. Acrolein and trans-2-hexenal had no effect on any P450 tested, but in the case of HNE, there was some inhibition, but it was dependent on the initial concentration of HNE added.
Analysis of 9-AA oxidation by P4502c29 revealed a pattern of mixed competitive inhibition by HNE (Figure 5A & B). The apparent Ki of HNE for P4502c29 was approximately 35 μM calculated from the double reciprocal plot (1/v vs. 1/[I]; see inset Figure 5A). In separate studies not shown, we determined an apparent Km for HNE oxidation to the carboxylic acid by P4502c29 of ∼15 μM (data not shown). These results suggest that at low concentrations, HNE is a substrate for P4502c29 and competes competitively with 9-AA as a substrate (Figure 5B). At HNE concentrations above 300 μM, significant inactivation of many P450s occurs [16].
Figure 5. Kinetic analysis of 4-hydroxynonenal inhibition of 9-AA oxidation catalyzed by P4502c29.


The concentration-dependence of 4HNE inhibition of anthracene-9-carboxaldehyde oxygenation was performed as described in Methods. The maximal velocity was observed to be 105 nmol product formed per 10 minutes per mg protein; the kcat was approximately 7.1 min-1. A. ○, 0 μM HNE; Δ, 25 μM HNE, □, 50 μM HNE. Inset: double reciprocal plot of 1/rate of metabolism vs. 1/9-AA concentration. B. Scheme for mixed competitive inhibition.
Oxidation of 9-AA by mouse liver microsomes
The oxidation of 9-AA by liver microsomal protein (0.25 mg/mL) from mice fed with 0.5% butylated hydroxyanisole in AIN76A diet was also determined (Table 1). The rate of formation of 9-ACA was 1.5 nmol/min/nmol P450. In order to deduce which P450s may be involved in this reaction in mouse liver microsomes, we used selective cytochrome P450 inhibitors previously established to be effective in primary hepatocytes [32]. Miconazole (500 μM) caused approximately 50% inhibition, as expected (Figure 6). Lower concentrations of miconazole (100 μM) caused around 20-25% inhibition suggesting that P4503a enzymes may be involved in 9-AA oxidation (data not shown). Phenytoin (500 μM) is a competitive substrate for P4502c29 [33] and caused approximately 40% inhibition of 9-AA oxidation activity. On the other hand, troleandomycin is a specific mechanism-based inhibitor for P4503A enzymes [32,33] and incubation of 500 μM troleandomycin, 0.5 mM NADPH, and liver microsomes for 10 min prior to 9-AA oxidation assays resulted in 40 % inhibition of the reaction in mouse liver microsomes. The aldehyde dehydrogenase inhibitor cyanamide did not significantly inhibit microsomal oxidation of 9-AA, suggesting that there was little or no contribution of ALDH in the microsomal preparation (Table 2). These results suggest that both murine P4502c29 and P4503a14 (or related P450s) likely catalyzed the oxidation of 9-AA with liver microsomes from C57BL/6J mice.
Figure 6. Effects of specific inhibitors on mouse liver microsomal aldehyde oxidation activity for 9-AA and HNE.

Liver microsomes from C57BL/6J mice fed AIN76A diet containing 0.5 % butylated hydroxyanisole was used to perform the two oxidation activities. Specific P450 inhibitors were added to the reaction mixtures (either 0.5 mM miconazole, 0.5 mM phenytoin, or preincubation of liver microsomes and NADPH with 0.5 mM troleandomycin prior to adding aldehyde substrate). The enzyme activities (18 ± 3 pmol/min/mg protein; 78 ± 11 pmol/min/nmol P450) were the average of three assays ± SD as described in Methods.
Table 2.
Effect of alcohol dehydrogenase, aldehyde dehydrogenase, and P450 inhibitors on recombinant P4503A4 activity.
| Inhibitor (100 μM) | % of control activity |
|---|---|
| Control | 100 |
| miconazole | 15 |
| troleandomycin | 3 |
| cyanamide | 92 |
| benomyl | 37 |
| 4-methylpyrazole | 2 |
The activity of P4503A4 was measured at 25° C using the 7-benzyloxyresorufin as substrate in the presence of 0.5 mM NADPH and E. coli membranes expressing both P4503A4 and NADPH:P450 oxidoreductase (Materials and Methods). The activities were the mean of three assays and SD < 5-8% of the average value. The control activity was 78 pmol/min/nmol P450.
Microsomal metabolism of HNE
The oxidation of HNE by mouse liver microsomal protein was also determined by HPLC as described previously [6]. The reaction was performed by incubating 50 μM [3H]HNE, NADPH, and microsomes. HNE was oxidized at a rate of 0.37 nmol/min/nmol P450. As with the E. coli-expressed P4502c29, the mouse liver microsomal fractions generated an unknown metabolite (tR = 62 min). In addition, a very polar metabolite (tR ∼ 4 min) was observed near the beginning of the gradient, which has not been characterized to date. Miconazole, a general P450 inhibitor, caused approx. 40% inhibition of HNE oxidative metabolism to HNA by mouse liver microsomal protein fractions (Figure 6B). The P4502c29 inhibitor phenytoin caused 70% inhibition of total HNE metabolism suggesting a major role for P4502c29, while troleandomycin, a specific inhibitor of P4503a, caused only 40% inhibition, demonstrating the importance of two murine P450s, P4503a and P4502c29, in the oxidation of HNE.
Metabolism of HNE in primary cultures of rat hepatocytes
Studies by Petersen and coworkers [34] demonstrated that primary cultures of rat hepatocytes metabolize HNE to its carboxylic acids by oxidative reactions, its dihydroxy form through reductive reactions and its glutathione adduct through GSH conjugation reactions. Based on use of inhibitors, they concluded that aldehyde dehydrogenases were the major catalysts of the oxidative reaction, but our results suggest that some P450s are sensitive to the known inhibitors of aldehyde dehydrogenases (100 μM benomyl causes 65% inhibition of P4503A4) and alcohol dehydrogenase (1 μM 4-methylpyrazole causes 98% inhibition of P4503A4, Table 2). Micronazole and troleandomycin are known to be potent inhibitors of P4503A [32,33]. Only cyanamide was shown to be a specific inhibitor of aldehyde dehydrogenase at 500 μM, and did not inhibit benzyloxyresorufin O-debenzylase activity of P4503A4.
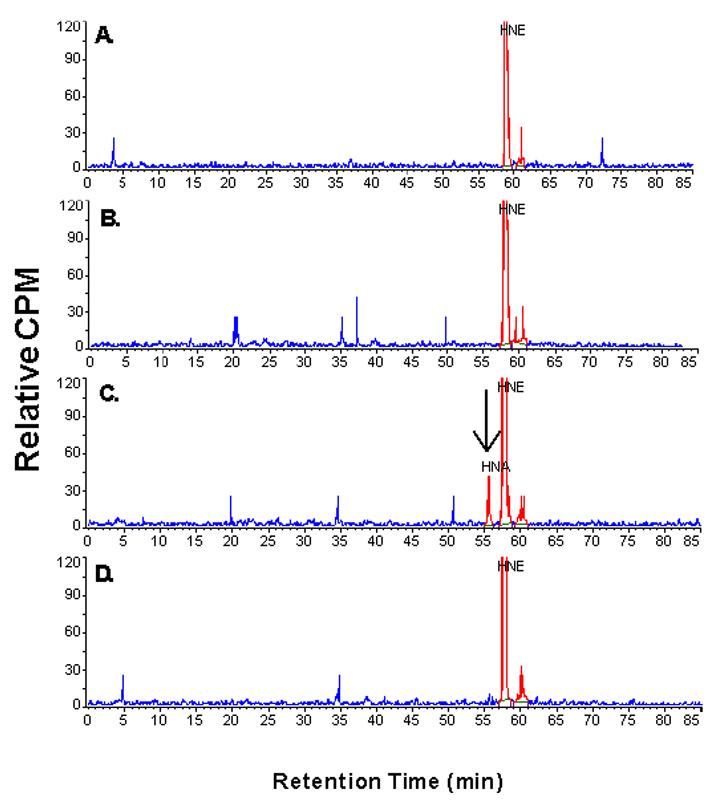
Since two major classes of enzymes catalyze the oxidation of aldehydes to carboxylic acids, namely aldehyde dehydrogenases and the P450s, we sought to test the relative participation of these two systems in aldehyde oxidation in a cellular model. Specific inhibitors of ALDH (cyanamide) and P450s (miconazole and troleandomycin) were utilized to determine the relative participation of these enzymes in the metabolism of [3H]HNE in primary cultures of rat hepatocytes. Because P4503A4 is inhibited by 4-methylpyrazole and benomyl (Table 2), we did not utilize these inhibitors believed to be specific for alcohol dehydrogenase and aldehyde dehydrogenase, respectively. The HPLC profile for the HNE metabolites formed in rat hepatocytes (Figure 7A), polar metabolites (tR 5 min), GSH conjugates of HNE (tR 41.5, 45, and 49 min), DHN (tR 55 min), HNA (tR 57 min) and the slower eluting metabolite (tR 62 min), similar to that reported by Petersen and coworkers (34).
Figure 7. Use of specific inhibitors of aldehyde dehydrogenase (cyanamide) and P450 (miconazole and troleandomycin) on HNE metabolism in primary hepatocytes from Sprague-Dawley rats.


Primary rat hepatocytes were prepared as described in Methods with a viability of >95% and immediately treated with HNE. The reactions were quenched by adding 1% TFA and frozen at -80 °C. The products were measured using HPLC and radioactivity determined using a Radiomatic detector. A. HPLC elution profile for HNE metabolized by rat hepatocytes. B. Effect of inhibitors (0.5 mM) of aldehyde dehydrogenase (cyanamide) or P450 (miconazole or troleandomycin) on formation of HNA. Four preparations of rat hepatocytes was used to obtain statistical significance. *, p = 0.05; **, p = 0.001.
We treated hepatocytes with an ALDH inhibitor (cyanamide), a general P450 inhibitor (miconazole), or the specific P4503A inhibitor (troleandomycin) at 500 μM, concentrations shown to maximally inhibit ALDHs or P450s in microsomes or expressed recombinant P450s, respectively (results not shown). The effect of these inhibitors on production of various unconjugated hepatocyte metabolites are shown in Figure 7B. Addition of the ALDH inhibitor cyanamide caused a 55% inhibition of HNA production, while miconazole caused ∼25% inhibition of HNA formation (not statistically significant). When cyanamide and miconazole were added together, HNA formation was inhibited by 85%. Troleandomycin, the inhibitor of P4503a, stimulated HNA formation 175%. Miconazole or miconazole plus cyanamide decreased formation of the polar metabolite, but increased GSH conjugate formation (data not shown). These results demonstrate that the increase in GSH conjugates when P450 and ALDH are inhibited is most likely the result of all three pathways of metabolism being similar in their metabolic rate and affinity, and that the glutathione S-transferases utilized the remaining unreacted HNE.
Discussion
A typical reaction catalyzed by P450s is the hydroxylation of an unfunctionalized alkyl group. However, examples are also known in which P450s catalyze the oxidation of aldehydes to acids with the incorporation of molecular oxygen into the products [36]. Several critical P450-catalyzed reactions have been shown to involve oxidation of aldehydes or hemiacetals, namely the aromatase and sterol 14α-demethylase reactions. The formation of estrogen requires oxidation of the 19-methyl group of 4-androstenedione to a methyl alcohol derivative, followed by two consecutive oxidation steps to form an intermediate aldehyde and carboxylic acid derivative. The thermodynamics of dehydration drives this reaction to produce aromatization of the A-ring of 4-androstenedione. A similar reaction also occurs for removing the 14α-methyl group of sterols via this same reaction pathway to form the essential sterol ergosterol; inhibition of this P450 in microorganisms has been shown to be an effective method to inhibit the growth of fungi. In mammals, the oxidation of aromatic aldehydes, such as 11-oxo-Δ8-tetrahydrocannabinol, to its acid is primarily catalyzed in mice by hepatic P4502E1 [37]. Also, hepatic microsomes from various animals possess the ability to oxidize xenobiotic aldehydes to carboxylic acids (Figure 1) by the P450 system [27]. More recently, model substrates, 9-AA and 4-biphenylaldehyde, have been used to measure the activity of several P450s [28,29]. These fluorogenic substrates provide simple methods to measure the acid products formed from the P450-dependent oxidation of aromatic aldehydes.
Our studies addressed the possible role of various P450s in the metabolism of aromatic α,β-aldehydes (e.g., anthracene-9-carboxaldehyde) and the aliphatic α,β-aldehydes (e.g., HNE). Our initial observation of murine P4502c29-catalyzed oxidation of HNE suggested that P450s may be involved in HNE metabolism in the heart and liver in vivo, where it is reportedly expressed [17]. P4502c29 was initially identified as a microsomal aldehyde oxygenase (P450 MUT-2) by Yamamoto et al. [38], who observed that P4502c29 was the primary microsomal P450 responsible for oxidation of a cannabinoid aldehyde. We observed that P450s of the 2B, 2C, and 3A subfamilies also catalyzed oxygenation of aromatic aldehydes to their carboxylic acids. These results collectively demonstrate that P450s also contribute to aldehyde oxidation, as suggested by Marini et al. [28]. However, other P450s, P4501A2, 2E1 and 2J2 were analyzed and appear to be poor catalysts of HNE oxidation (Table 1). Our studies suggest that some of the P450s produce products in addition to HNA; their chemical characterization will be the focus of future studies. Furthermore, we provide data showing that HNE is a competitive substrate for 9-AA metabolism by P4502c29 and suggests that other short chain aldehydes may be substrates for the P450. The Km values for these P450s reactions were in the range of 1-20 μM.
To evaluate the relative participation of P450s and aldehyde dehydrogenases in oxidation of aromatic and aliphatic α,β-aldehydes, we studied their activity with murine liver microsomes or expressed recombinant P450s and its flavoprotein oxidoreductase. The oxygenase activity of liver microsomes was found to be inhibited > 50% by 0.5 mM miconazole, an inhibitor of most P450s. Using specific inhibitors, we also showed the participation of P4503a (troleandomycin) and P4502c29 (phenytoin) activity in mouse liver microsomes. We observed the presence of an appreciable NADP+-dependent oxidation of 9-AA to 9-ACA in the cytosolic fractions of mouse liver microsomes that was inhibited by cyanamide and benomyl (data not shown). Studies were performed to evaluate the specificity of known inhibitors of aldehyde metabolizing enzymes using cyanamide (ALDH), 4-methylpyrazole (alcohol dehydrogenase), and benomyl (ALDH). P4503A4 was shown to be potently inhibited by both 4-methylpyrazone and benomyl, suggesting that cyanamide was the only ALDH specific inhibitor that can be used to distinguish ALDHs from P450s. These inhibitors were utilized in experiments with primary cultures of rat hepatocytes to evaluate the relative participation of ALDH and P450s in HNE metabolism. Cyanamide inhibited HNA formation by > 55% and miconazole only inhibit HNA formation around 25-30%, but troleandomycin actually stimulated the formation of HNA, suggesting that P4503a enzymes may be involved in further metabolism of HNA or DHN. Inhibition of the P4503a reactions apparently increased the steady-state concentration of HNE and led to more formation of HNA as a result. The production of polar products (tR 5 min) derived from HNE in hepatocytes was inhibited by miconazole, suggesting that these products are formed by P450s. However, these polar metabolites may also be due to tritiated water released during oxidative metabolism. Finally, the GSH-conjugates were increased by P450 inhibitors, suggesting that upon blocking the P450 reactions, more substrate is available for GSH conjugation of HNE (data not shown). These results demonstrate that in hepatocytes these three pathways involving glutathione S-transferases, aldehyde dehydrogenases, and cytochromes P450 apparently function at similar rates. Cytochrome P450s account for a significant portion of the oxidative metabolites of HNE; Petersen and coworkers [34] may have underestimated their role in rat hepatic metabolism due to the sensitivity of P4503A to the ALDH and alcohol dehydrogenase inhibitors used. However, future experiments employing mass balance of radiolabeled metabolites is necessary to fully establish this conclusion and its physiological significance.
In summary, our results showing that several P450s are efficient catalysts in the oxidative transformation of lipid-derived aldehydes to carboxylic acids adding a new facet to the biological activity of these metabolites. Our studies suggest that P450-mediated metabolism operates in parallel with other metabolic transformations of aldehydes; hence, the P450s could serve as reserve or compensatory mechanisms when other high capacity pathways of aldehyde elimination are compromised due to disease or toxicity. Finally, because HNE like unsaturated aldehydes, such as acrolein, trans-2-hexenal, and crotonaldehyde, are also food constituents or environmental pollutants, P450s may be significant regulators of toxicity due to xenobiotic aldehydes as well.
Acknowledgements
Supported by USPHS grant P01 ES11860 (RAP/AB). The authors express appreciation for K. Cameron Falkner for his helpful discussions about biochemical kinetic analysis.
Abbreviations
- 9-AA
anthracene-9-carboxaldehyde
- 9-ACA
anthracene-9-carboxylic acid
- DHN
1,4-dihydroxy-trans-2-nonene
- HNA
4-hydroxy-trans-2-nonenoic acid
- HNE
4-hydroxy-trans-2-nonenal
- Km
Michaelis constant
- S0.5
the concentration of substrate to achieve half maximal velocity.
Footnotes
Publisher's Disclaimer: This is a PDF file of an unedited manuscript that has been accepted for publication. As a service to our customers we are providing this early version of the manuscript. The manuscript will undergo copyediting, typesetting, and review of the resulting proof before it is published in its final citable form. Please note that during the production process errors may be discovered which could affect the content, and all legal disclaimers that apply to the journal pertain.
REFERENCES
- [1].Sladek NE. Anticancer Drugs: Reactive Metabolism and Drug Interactions. 1994. Metabolism and pharmacokinetic behavior of cyclophosphamide and related oxazaphosphorines; pp. 79–156. [Google Scholar]
- [2].Schneider C, Tallman KA, Porter NA, Brash AR. J.Biol.Chem. 2001;276:20831–20838. doi: 10.1074/jbc.M101821200. [DOI] [PubMed] [Google Scholar]
- [3].Esterbauer H, Schaur RJ, Zollner H. Free Radic.Biol.Med. 1991;11:81–128. doi: 10.1016/0891-5849(91)90192-6. [DOI] [PubMed] [Google Scholar]
- [4].Poli G, Schaur RJ. IUBMB.Life. 2000;50:315–321. doi: 10.1080/713803726. [DOI] [PubMed] [Google Scholar]
- [5].Awasthi YC, Sharma R, Cheng JZ, Yang Y, Sharma A, Singhal SS, Awasthi S. Mol. Aspects Med. 2003;24:219–230. doi: 10.1016/s0098-2997(03)00017-7. [DOI] [PubMed] [Google Scholar]
- [6].Srivastava S, Conklin DJ, Liu SQ, Prakash N, Boor PJ, Srivastava SK, Bhatnagar A. Atherosclerosis. 2002;158:339–360. doi: 10.1016/s0021-9150(01)00454-3. [DOI] [PMC free article] [PubMed] [Google Scholar]
- [7].Esterbauer H, Wag G, Puhl H. Br.Med.Bull. 1993;49:566–576. doi: 10.1093/oxfordjournals.bmb.a072631. [DOI] [PubMed] [Google Scholar]
- [8].Eckl PM, Ortner A, Esterbauer H. Mutat.Res. 1993;290:183–192. doi: 10.1016/0027-5107(93)90158-c. [DOI] [PubMed] [Google Scholar]
- [9].Esterbauer H, Zollner H, Lang J. Biochem.J. 1985;228:363–373. doi: 10.1042/bj2280363. [DOI] [PMC free article] [PubMed] [Google Scholar]
- [10].Siems WG, Grune T, Beierl B, Zollner H, Esterbauer H. EXS. 1992;62:124–135. doi: 10.1007/978-3-0348-7460-1_13. [DOI] [PubMed] [Google Scholar]
- [11].Ramana KV, Bhatnagar A, Srivastava S, Yadav UC, Awasthi S, Awasthi YC, Srivastava SK. J.Biol.Chem. 2006;281:17652–17660. doi: 10.1074/jbc.M600270200. [DOI] [PubMed] [Google Scholar]
- [12].Alary J, Bravais F, Cravedi JP, Debrauwer L, Rao D, Bories G. Chem.Res.Toxicol. 1995;8:34–39. doi: 10.1021/tx00043a004. [DOI] [PubMed] [Google Scholar]
- [13].de Zwart LL, Hermanns RC, Meerman JH, Commandeur JN, Vermeulen NP. Xenobiotica. 1996;26:1087–1100. doi: 10.3109/00498259609167424. [DOI] [PubMed] [Google Scholar]
- [14].Black SD. FASEB J. 1992;6:680–685. doi: 10.1096/fasebj.6.2.1537456. [DOI] [PubMed] [Google Scholar]
- [15].Nelson DR, Strobel HW. Mol.Biol.Evol. 1987;4:572–593. doi: 10.1093/oxfordjournals.molbev.a040471. [DOI] [PubMed] [Google Scholar]
- [16].Kuo CL, Vaz AD, Coon MJ. J.Biol.Chem. 1997;272:22611–22616. doi: 10.1074/jbc.272.36.22611. [DOI] [PubMed] [Google Scholar]
- [17].Luo G, Zeldin DC, Blaisdell JA, Hodgson E, Goldstein JA. Arch.Biochem.Biophys. 1998;357:45–57. doi: 10.1006/abbi.1998.0806. [DOI] [PubMed] [Google Scholar]
- [18].Guengerich FP, Martin MV. Methods in Enzymology. 1999;100:x–y. doi: 10.1016/s0076-6879(96)72006-2. [DOI] [PubMed] [Google Scholar]
- [19].Guengerich FP, Martin MV. Methods Mol.Biol. 2006;320:31–37. doi: 10.1385/1-59259-998-2:31. [DOI] [PubMed] [Google Scholar]
- [20].Remmer H, Greim H, Schenkman JB, Estabrook RW. Methods in Enzymology. 1967;10:703–708. [Google Scholar]
- [21].Omura T, Sato R. J.Biol.Chem. 1964;239:2370–2378. [PubMed] [Google Scholar]
- [22].Skett P, Bayliss M. Xenobiotica. 1996;26:1–7. doi: 10.3109/00498259609046683. [DOI] [PubMed] [Google Scholar]
- [23].Henly DC, Phillips JW, Berry MN. J.Biol.Chem. 1996;271:11268–11271. doi: 10.1074/jbc.271.19.11268. [DOI] [PubMed] [Google Scholar]
- [24].Dean WL, Gray RD. Biochem.Biophys.Res.Commun. 1982;107:265–271. doi: 10.1016/0006-291x(82)91699-0. [DOI] [PubMed] [Google Scholar]
- [25].Yasukochi Y, Masters BS. J.Biol.Chem. 1976;251:5337–5344. [PubMed] [Google Scholar]
- [26].Prough RA, Burke MD, Mayer RT. Methods Enzymol. 1978;52:372–377. doi: 10.1016/s0076-6879(78)52041-7. [DOI] [PubMed] [Google Scholar]
- [27].Watanabe K, Matsunaga T, Kimura T, Funahashi T, Funae Y, Ohshima T, Yamamoto I. Drug Metab Pharmacokinet. 2002;17:516–521. doi: 10.2133/dmpk.17.516. [DOI] [PubMed] [Google Scholar]
- [28].Marini S, Grasso E, Longo V, Puccini P, Riccardi B, Gervasi PG. Xenobiotica. 2003;33:1–11. doi: 10.1080/0049825021000017894. [DOI] [PubMed] [Google Scholar]
- [29].Clark AG, Carrol N. Biochem.J. 1986;233:325–331. doi: 10.1042/bj2330325. [DOI] [PMC free article] [PubMed] [Google Scholar]
- [30].Srivastava S, Dixit BL, Cai J, Sharma S, Hurst HE, Bhatnagar A, Srivastava SK. Free Rad. Biol. Med. 2000;29:642–651. doi: 10.1016/s0891-5849(00)00351-8. [DOI] [PubMed] [Google Scholar]
- [31].Watanabe K, Narimatsu S, Yamamoto I, Yoshimura H. J.Biol.Chem. 1991;266:2709–2711. [PubMed] [Google Scholar]
- [32].Chauret N, Gauthier A, Martin J, Nicoll-Griffith DA. Drug Metab Dispos. 1997;25:1130–1136. [PubMed] [Google Scholar]
- [33].Jackson JP, Ferguson SS, Moore R, Negishi M, Goldstein JA. Mol. Pharmacol. 2004;65:1397–1404. doi: 10.1124/mol.65.6.1397. [DOI] [PubMed] [Google Scholar]
- [34].Maurice M, Pichard L, Daujat M, Fabre I, Joyeux H, Domergue J, Maurel P. FASEB J. 1992;6:752–758. doi: 10.1096/fasebj.6.2.1371482. [DOI] [PubMed] [Google Scholar]
- [35].Hartley DP, Ruth JA, Petersen DR. Arch. Biochem. Biophys. 1995;316:197–205. doi: 10.1006/abbi.1995.1028. [DOI] [PubMed] [Google Scholar]
- [36].Guengerich FP. Chem.Res.Toxicol. 2001;14:611–650. doi: 10.1021/tx0002583. [DOI] [PubMed] [Google Scholar]
- [37].Watanabe K, Narimatsu S, Matsunaga T, Yamamoto I, Yoshimura H. Biochem.Pharmacol. 1993;46:405–411. doi: 10.1016/0006-2952(93)90516-y. [DOI] [PubMed] [Google Scholar]
- [38].Yamamoto I, Watanabe K. Seikagaku. 1991;63:504–507. [PubMed] [Google Scholar]