

Abstract
Here we use textures made up of widely spaced Gabor patches to compare infant and adult sensitivity to the global organization of the elements comprising the textures. Visual Evoked Potentials (VEPs) were recorded to alterations between random images and images containing varying proportions of patches that were of the same orientation. The patches were placed on rectangular, hexagonal or random lattices. Texture-specific responses were robust in adults and their VEP threshold was reached when 1 to 17% of the patches had the same orientation in the structured image. Infant thresholds were approximately 20–60%. While infants are capable of detecting the global structure of our textures, their sensitivity is low. In adults we found, unexpectedly, that sensitivity and response gain were higher for horizontal compared to vertical global orientations. Infant sensitivity was the same for the two orientations. Comparable orientation anisotropies have not been previously reported for gratings, suggesting that the Gabor-defined textures are tapping different mechanisms. There were small, but measurable effects of the lattice type in adults, with rectangular lattice producing the largest responses.
Keywords: Texture, orientation, visual cortex, development, Visual Evoked Potential
1. Introduction
The detection of locally parallel structure, sometimes referred to as texture flow, is a fundamental aspect of the perception of object shape and surface layout (Ben-Shahar, 2003, Hel Or & Zucker, 1989, Knill, 2001, Li & Zaidi, 2000). Changes in the orientation and spatial frequency distribution of the retinal image are systematically related to object shape and to the geometry of the projection onto the retina. Extracting regularities in the distribution of orientation and spatial frequency changes across the image is thus critical for recovering object shape or the three-dimensional layout of surfaces (Gibson, 1950). In addition, different materials lead to qualitative differences in the projected distributions of orientation and spatial frequency on the retina. The discrimination of material properties thus requires sensitivity to the statistical distribution of these properties.
The extraction of the dominant orientation or spatial frequency content of a retinal image patch can be accomplished by oriented filters of very limited extent. The determination of the orientation and spatial frequency modulations caused by object shape and projective geometry, on the other hand, must be extracted over substantially larger regions of the image. Similarly, reliable estimates of material properties also require integration of orientation and spatial frequency statistics over extended regions of the image. The ability to determine shape, layout and material properties thus requires sensitivity to local orientation and spatial frequency information plus specific processes for integrating these parameters across the image.
Oriented receptive fields are present at birth in the primary visual cortex of non-human primates (Chino, Smith, Hatta & Cheng, 1997) and thus part of the machinery for shape and material processing should be in place at the start of visual experience. Integration of orientation information over long distances, on the other hand, is believed to depend, at least in part, on intra-cortical connections that link iso-orientation columns (Gilbert & Wiesel, 1989, Malach, Amir, Harel & Grinvald, 1993, Rockland & Lund, 1982, Rockland & Lund, 1983), as well as feedback connections between visual areas (see Angelucci, Levitt, Walton, Hupe, Bullier & Lund (2002) for a recent review). Feedback connections from V2 to V1, like intrinsic horizontal connections within areas, have recently been shown to occur predominantly for similar orientations (Shmuel, Korman, Sterkin, Harel, Ullman, Malach & Grinvald, 2005). Moreover, the targeting of feedback connections to V1 in that study is spatially anisotropic, at least in the owl monkey, consistent with selective targeting of collinearly arranged orientation columns. This pattern of anatomical connections suggests that textures comprised of iso-oriented stimuli may evoke different responses than textures made up of orientation mixtures and further, that responses may depend on the particular spatial configurations present in the texture. As a practical matter, tasks that involve comparisons of orientation information across large distances may serve as functional probes of the integrity of long-range horizontal and feedback intracortical connections.
Long-range intracortical connections appear to have a protracted developmental sequence relative to feed-forward connections (Burkhalter, 1993, Burkhalter, Bernardo & Charles, 1993, Singer, 1995) and are highly susceptible to abnormal post-natal experience (Callaway & Katz, 1991, Tychsen, Wong & Burkhalter, 2004, White, Coppola & Fitzpatrick, 2001, Zufferey, Jin, Nakamura, Tettoni & Innocenti, 1999). Thus tasks that rely on long-range integration mechanisms may show extended development and plasticity. Very little is known about the quality of integrative orientation processing during early development. Interactions between receptive field centers and their surround, which are believed to rely on a combination of horizontal and feedback connections are selectively immature in macaque V2 as opposed to V1 (Zhang, Zheng, Watanabe, Maruko, Bi, Smith & Chino, 2005). At a functional level, an early study (Humphrey, Muir, Dodwell & Humphrey, 1988) found that four month-old infants could discriminate arrays of radially ordered lines from random ones. The contour-in-noise task (Field, Hayes & Hess, 1993, Kovacs & Julesz, 1993), which relies on long-range integration of collinear elements, shows a protracted developmental sequence in both humans (Kovacs, Kozma, Feher & Benedek, 1999, Pennefather, Chandna, Kovacs, Polat & Norcia, 1999) and non-human primates (Kiorpes & Bassin, 2003). More difficult to interpret in the context of long-range integration are the studies of behavioral sensitivity for texture-defined forms, a common task in the adult psychophysical literature (Nothdurft, 1985a, Nothdurft, 1985b, Nothdurft, 1991, Wolfson & Landy, 1995, Wolfson & Landy, 1998). Atkinson & Braddick (1992) showed that the ability to discriminate texture-defined forms against a differently oriented background is present by 14 to 18 weeks of age, while other studies (Rieth & Sireteanu, 1994, Sireteanu & Rieth, 1992) found this ability starting to emerge at only 9 to 12 months of age, with adult-like performance being achieved around school age. The discrimination of a segmented image from a uniform one can, in principle, be accomplished by local mechanisms sensitive to orientation changes at the borders of the texture-defined object and it is thus unclear the extent to which such tasks require integration over larger regions of the image.
In a previous study (Norcia, Pei, Bonneh, Hou, Sampath & Pettet, 2005), we investigated the ability of 2 to 8 month-olds to discriminate textures that differed only in their orientation statistics. The textures used in our previous study were composed of rectangular arrays of Gabor patches that were either all of the same orientation or all of a random orientation. Furthermore, the patches were widely spaced: the center-to-center distances between patches were 3 wavelengths of the 1.5 cpd carrier spatial frequency. Differential responses to organized versus random patterns required the integration of orientation across at least two patches and a considerable distance. This degree of separation is sufficiently large to emphasize integration via horizontal or feedback connections (Angelucci et al., 2002, Cavanaugh, Bair & Movshon, 2002). We found specific components of the Visual Evoked Potential (odd-harmonics) that captured differences in the response between systematically ordered textures and random ones and thus sensitivity to the global structure of the texture. Specifically, in both infants and adults, the VEP response to an exchange of an organized texture with a random one contained significant odd-harmonic components. Exchanges between two random patterns led to response that contained only even harmonics. The odd-harmonic components arose due to the responses after a transition from organized to random images being different from those occurring after the transition from random to organized. The local contrast changes cause by the image alternations were the same in the organized/random stimuli and in the random/random stimuli and thus the odd harmonics were due to the detection of “conjunctions” of like orientations in the organized image. Using the VEP, we found sensitivity to the spatial distribution of single-scale orientation information as early as two months of life. Sensitivity to collinear contour stimuli was demonstrable only after 6 months of age.
In our previous study (Norcia et al., 2005), we alternated images that contained patches that were all of the same orientation with images that were completely random. Here we estimated the sensitivity of adult and 6 month old infants by measuring evoked responses to a series of pattern exchanges that differed in the fraction of patches that were plotted at the same orientation in the oriented member of the alternation. Our previous study also contrasted texture-related responses to those generated in a contour integration paradigm that required the specific ability to integrate information that was approximately collinear. Infant responses were substantially smaller to these stimuli than they were to textures. In the present study we assessed the importance of element collinearity and spatial regularity in adults prior to choosing a more limited set of stimulus conditions that could be successfully tested in infants. We found modestly larger responses for the regular arrays that led to collinear arrangements of next neighbors and these patterns were therefore used to test infants. Finally, we compared response amplitude and sensitivity for horizontal and vertical global orientations and found and unexpected effect: responses were larger and sensitivity was higher for horizontal versus vertical texture orientations in adults. Both orientations were therefore tested in the infants.
2. Methods
2.1 Observers
VEPs were recorded in 15 adults with normal or corrected to normal vision, and in a group of 29 typically developing infants from 20 to 38 weeks old (mean age 6.3 months). We obtained informed consent from the adult participants and from one of the parents of each infant after an explanation of the nature and possible consequences of the study. The research followed the tenets of the World Medical Association Declaration of Helsinki and the local Institutional Review Board approved the research protocol.
2.2 Stimuli
Stimuli were presented on a Power Macintosh G4 computer using conventional raster graphics methods (800×600 pixels at a 72 Hz refresh-rate) on a monochrome monitor (Richardson Electronics MR-2000 MedHB, video bandwidth 150 MHz). Textures were composed of Gabor patches (sine-wave gratings windowed by a Gaussian envelope). The carrier spatial frequency of each Gabor patch was 2 c/deg and the envelope allowed approximately 2 cycles to be visible. The Gabor-patch contrast was 80% using the Michelson definition, the mean luminance was 120 cd/m2 and the viewing distance was 70 cm. The textures were presented in a circular field (diameter of 15.6 deg) surrounded by a rectangular mean luminance surround.
2.3 Fixed parameter textures
In the first part of the adult experiment, globally organized textures comprised of Gabor patches were alternated every 250 ms (2 Hz temporal frequency) with fields having the same number of patches, centered on the same locations, but in which the individual patches were randomly oriented. A new random pattern was used for each alternation. Each trial consisted of a consecutive sequence of these alternating patterns lasting 10 sec. The stimulus was presented for 1 sec before the start of the data analysis to allow settling of the initial contrast transient generated by the onset of the patterns from an otherwise blank field. An additional 1 sec of display was appended at the end of the trial. The displays thus lasted 12 sec, with the middle 10 sec being used for data analysis.
The organized textures consisted either of vertically or horizontally oriented Gabor patches displayed on one of three lattices that differed in the relative positions of the patches with respect to one another (see Figure 1 for illustrations of the different patch organizations). The rectangular lattice resulted in a configuration where each patch in the interior of the texture was flanked by patches of the same orientation at equal distances in its end- and side-zones. The end-zone patches were collinear and the axis of global collinearity was the same as the axis of the carrier orientation. In the hexagonal lattice condition, none of the neighboring patches were collinear, but there were collinear patches located in every other row (at a distance of 6 wavelengths of the carrier). In the random lattice, there was no systematic placement of patches with respect to end- or size-zones. The center-to-center spacing was varied for the different lattices in order to keep the total number of patches and the average patch density in the display constant. The center-to-center separation between each Gabor was 3.2 wavelengths (λ) of the carrier spatial frequency in the rectangular lattice conditions, 3.46λ in the hexagonal lattice conditions and 3.01λ in the random lattice conditions. For each of the three lattices, we created texture-absent control conditions in which two patterns having all randomly oriented patches were alternated, as described above. The texture-present test conditions and texture absent control conditions had the same number of patches with the same relative spacings. Trials for each of the conditions were randomly interleaved during recording sessions for all observers in blocks of 5 trials.
Figure 1.

Illustration of the three lattice configurations. Left. Rectangular lattice with vertical global orientation. Middle. Hexagonal lattice. Right. Random lattice. The center-to-center separation between adjacent Gabors was 3.2 wavelengths of the carrier spatial frequency (λ) in the rectangular lattice conditions, 3.4.6λ in the hexagonal lattice conditions and 3.0.1 λ in the random lattice conditions. For all three lattice test stimuli, the corresponding control stimuli were obtained by randomizing the individual Gabor patch orientations on the same grid locations.
2.4 Swept parameter textures
In addition to measuring responses to organized textures where all of the elements were either horizontal or vertical, we also measured how responses depended on the degree of global organization. This was manipulated by randomizing the orientations of a specific proportion of patches. The percentage of patches retaining the global orientation was termed the coherence of the organized texture. Hence, global organization of a texture became more visible as its coherence increased. In adults, we tested coherences ranging from 0 to 100%, and in infants from 30 to 100%. For both groups, the coherence range was divided into ten linearly spaced levels, each one used to create a one-second-long alternating stimulus step, as described above. These ten steps were presented in a consecutive sequence, in order of increasing or decreasing visibility, to create a 10-second recording trial, again preceded and succeeded by 1 sec of stimulus without recording. The textures were alternated at 1 Hz for the infants and 2 Hz for the adults.
2.5 Procedure
In the adults, we recorded 9 fixed-texture conditions and 6 swept-coherence conditions in one session, randomizing the order of presentation of the single conditions for each observer. The fixed conditions consisted of horizontal, vertical and random global organizations for the rectangular, hexagonal and random lattices. The swept conditions excluded the random organization.
We collected 10 trials for each fixed condition and 15 trials for the sweep conditions. The observers were instructed to fixate a patch in the center of the screen and to avoid blinking or movement.
We recorded from the infants using four of the swept coherence conditions in two different sessions: sweeps with increasing or decreasing visibility of a vertical pattern in one session and sweeps with increasing or decreasing visibility of a horizontal pattern in another session. We used rectangular lattices for all the conditions. The order of presentation was randomized across observers and sessions. All infants completed the four conditions. For the infant group, we collected 5 to 12 trials in each condition using a small noisy toy suspended over the center of the screen to control fixation and as an accommodative cue for the plane of the monitor. An experimenter standing behind the video monitor controlled fixation by observing the centration of the corneal reflex of the monitor in the infant’s pupils. When the infant broke fixation, data collection was paused while the stimulus idled, alternating at the coherence level one step before that reached when the break occurred. Recording resumed after fixation was regained, and the stimulus continued sweeping through the remaining coherence levels.
2.6 EEG Recording
Brain electrical activity was recorded with Grass gold-cup electrodes placed on the scalp with a conductive gel (10–20, D.O. Weaver). In the adults, a row of 7 electrodes, each referenced to Cz was placed symmetrically at a level of Oz. The lateral electrodes were 3, 6, and 9 cm to the right and left of Oz. For the infants, only the central three channels were used (O1, Oz and O2). Electrode impedance was between 3 and 10 Kilo-ohms. The EEG was amplified by a factor of 50,000 for the adults and 20,000 times for the infants (Grass Model 12 amplifiers with analog filter settings of 0.3 to 100 Hz, measured at −6 dB points). The EEG was digitized to 16 bits accuracy at a sampling rate of 432 Hz.
2.7 VEP signal analysis
For the fixed parameter recordings, time-locked average waveforms were computed for each observer and grand averages were computed across observers. The time-averages were digitally filtered using an inverse Discrete Fourier Transform that computed a synthesis of the first 53 harmonics of the stimulus frequency. The epoch length for the transform was 2 sec and the EEG noise at the odd multiples of 0.5 Hz was excluded from the synthesis, since no driven activity occurred at these frequencies. Significance of the difference potentials was assessed using a permutation test based on that of (Blair & Karniski, 1993).
In addition, spectral analyses for single-observer data was performed using an adaptive filter (Tang & Norcia, 1995). The first 6 harmonics were selected for quantitative analysis, since virtually all configuration-specific activity occurred below 6 Hz, even though the transient response contained frequencies up to 25–30 Hz. In the fixed trials, the amplitude and phase for each 10 sec record was averaged coherently across trials within an observer. That is, the real and imaginary components for each trial were first averaged separately before computing the amplitude and phase for a given stimulus condition and observer. Group average amplitudes for the different harmonics and stimulus conditions were then computed without considering phase (scalar average).
For the swept trials, the recordings were partitioned into ten 1 sec bins corresponding to each of the coherence level steps in the stimulus, and the amplitude and phase values were averaged across trials for each of these bins. Group averages were computed in a similar way --- each observer’s complex amplitudes were averaged coherently (vector average) on a bin-by-bin basis. Vector averaging of the amplitude versus coherence functions was necessary because of the low signal-to-noise ratio of the infant records. Error statistics for the swept-parameter group averages were computed using the T2circ statistic (Victor & Mast, 1991). The presence of a statistically significant response at a given harmonic indicated that the 95% confidence interval around the mean amplitude determined by the value of the T2circ statistic (an F-ratio) did not include zero. Error bars in the figures depicting sweep responses are vector standard errors, some of which cross zero when the vector mean amplitude is small. Vector mean amplitude goes to zero, in the limit, for EEG noise. The plotting of the signal values relative to the stimulus values took into account the delays inherent in the adaptive filter.
2.8 Threshold and gain estimation from the swept response functions
The group VEP amplitude-versus-coherence functions were used to estimate coherence thresholds and response gain (slope) for the different stimulus conditions and observer groups. For each swept stimulus condition, channel, and harmonic, thresholds of the average response function was estimated by linear regression of amplitudes from the bins in which the response decreased monotonically to the point of stimulus invisibility. The range of bins eligible for regression depended on the statistical significance and phase-consistency of the response according to an algorithm adapted from previous studies of grating responses (Norcia, Clarke & Tyler, 1985, Norcia, Tyler, Hamer & Wesemann, 1989). The regression range was limited to those bins where the following criteria were met: 1) response p-value in each bin was at most 0.16; 2) the difference in response phase for each pair of consecutive bins was between 80° and −100°, where phase increases with response latency; 3) at least one pair of consecutive bins had response T2circ p-values of 0.077 or less; and 4) to exclude spike artifacts, the amplitude of the bin immediately before and the bin immediately after any given bin in the range could not both be less than 0.3 times the amplitude of that given bin. Once the regression range was established, the threshold stimulus value was determined by extrapolating the regression line to zero response amplitude. When applied to spectral data from background EEG, these criteria yield a less than 5% false alarm rate over a full set of harmonics and channels (data not shown).
To estimate the standard errors of thresholds and slopes from the regression analysis of the group average sweep response functions, we used a jackknife procedure (Sprent, 2000). First, for the full group of observers, we determined the range of bins for regression using the algorithm above, and calculated the threshold, T, and slope, S. Then, using the same regression range, we re-calculated a set of n (the number of observers) estimates of threshold and slope, Ti and Si, each obtained by regressing the group response function obtained by deleting the ith observer. The standard error of the threshold, Tse, was:
where Tμ was the mean of the Ti. The standard error of the slope was obtained by the same formula, substituting Si for Ti. For paired comparisons of group thresholds (or slopes) between two stimulus conditions, we calculated ΔTi along with the two individual threshold estimates obtained by deleting each observer. ΔTse, the standard error of ΔT, the mean threshold difference, was obtained using the same formula as above. The significance of a threshold (or slope) difference, given a null hypothesis of no difference, was quantified by p, the two-tailed cumulative probability of observing a standard normal deviate larger than the absolute value of ΔT/ΔTse.
3 Results
3.1 Fixed-texture responses
Average waveforms for the adult observers for horizontal global orientations are shown in Figure 2 for the three lattice types (black traces) and their respective controls (gray traces). Data from the Oz derivation are shown. In the responses to the control stimuli (Figure 2, gray traces), alternations between two randomly organized textures elicited a positive peak at around 100 msec after each stimulus transition that was followed by a shallow negativity. The response magnitudes and waveforms for the control conditions were very similar across the three lattice types. This indicates that the spacing parameters were calibrated correctly and that in the absence of global structure, patch density --- rather than lattice geometry --- dominates response amplitude and waveform.
Figure 2.

Response waveforms from channel Oz for three horizontal lattice types: top; rectangular, middle; hexagonal, and bottom’ random. Each waveform represents the response to each cycle of organized/random alternation, averaged over the 10 seconds of each trial, averaged over trials for each observer, and averaged over observers. The dark bars at the top of each plot axis indicate epochs of significant difference by permutation testing across observers (p<0.05, corrected for multiple comparisons) between the test (black traces) and control conditions (gray traces). For all lattices, the responses to the organized/random transitions differ from those generated by random/random transitions. Responses to vertical lattices (not shown) were similar, but somewhat weaker.
Alternations between organized and random textures in the test stimuli, on the other hand, produced a characteristically asymmetric VEP response for all three lattice organizations (Figure 2, black traces). When compared to each control condition, the peak response about 100 msec after the transition to the organized state (at 0 msec) is larger, as is the subsequent negative wave between 130 and 300 msec. The offset of the global structure at 250 msec also leads to a significantly more negative response than is seen in the control condition. This effect is maximal around 160 msec after the offset of the global pattern. The responses from each of the horizontal lattices in Figure 2 had more points of significant difference than those from the vertical lattice conditions.
The effect of global orientation is shown for the rectangular lattice in Figure 3 for the full seven channel array. Data from the random-texture control condition are plotted in blue, the vertical lattice condition in red and the horizontal lattice condition in green. The responses from the horizontal and vertical lattice conditions differ from the control condition both after the random-organized transition at 0 msec (gray shading) and after the organized-random transition at 250 msec. The responses from the horizontal lattice condition show the largest differences from the control condition, particularly around 150 msec after the offset of the global structure (400 msec time point).
Figure 3.

Effect of lattice orientation and organization. Group results are plotted for the seven-channel array for data recorded with the rectangular lattice structure. Electrode positions are labeled according to the International 10–10 nomenclature. Data from the random-texture control condition are plotted in blue, the vertical lattice condition in red and the horizontal lattice condition in green. The responses from the horizontal and vertical lattice conditions differ from the control condition both after the random-organized transition at 0 msec (gray shading) and after the organized-random transition at 250 msec. The responses from the horizontal lattice condition show the largest differences from the control condition, particularly around 150 msec after the offset of the global structure (400 msec time point).
The most notable waveform difference between horizontal and vertical lattice orientations occurs in the size of the offset response that is larger for the horizontal lattice (negative peak at 400 msec in plot, 250 msec after the offset of global structure).
3.2 Frequency domain analysis of texture-related response
In the frequency domain, the response asymmetry in the test conditions is reflected by the presence of significant odd-harmonic responses of the 2 Hz stimulus frequency, with the first (2Hz) and third (6 Hz) harmonics predominating in the adults. The control condition responses, on the other hand, are dominated by even harmonic responses. These differences between test and control response spectra are summarized for each of the lattice types and stimulus orientations in Figure 4, which plots averages (across the 15 observers) of the scalar response amplitudes for the first four stimulus harmonics collected from Oz. Responses were largest overall at Oz (see Figure 3), but effects related to the various stimulus conditions did not depend on the recording channel. Subsequent analyses were therefore restricted to responses from Oz.
Figure 4.

Scalar response amplitudes, averaged across adult observers, for response spectrum components at the harmonics of the stimulus frequency. Original waveforms were obtained from channel Oz. For all three lattice types (the three groups of bars within each panel), the odd harmonics (panels A and C) show large differences between the control conditions (white bars) and each of the two globally organized test conditions (horizontal, black and vertical, gray). The difference between the two orientations was larger for the odd harmonics that it was for the even harmonics. Also, amplitudes in the random lattice conditions were slightly smaller overall.
Test stimuli responses (Figure 4, black and gray bars) at the first and third harmonics (left panels) were larger than control responses (white bars) for all lattice types and orientations, while those at the second and fourth harmonic were similar across conditions, indicating that the odd harmonics specifically index sensitivity to the global organization of the textures. Across test conditions, the odd-harmonic amplitudes were largest for the horizontal lattices (black bars), especially when the third harmonic (Figure 4C) is considered. We used repeated-measure multi-variate analysis of variance (MANOVA) to test the significance of effects due to lattice orientation (horizontal or vertical), lattice type (random, hexagonal or rectangular), and harmonic (odd or even). The dependent measure was a three-dimensional vector of response amplitudes from the three lowest-order response harmonics: the 1st, 3rd, and 5th for the odd components, and the 2nd, 4th and 6th for the even components. Control data (white bars) were not included in the MANOVA.
As expected from Figure 4, the odd-harmonic amplitudes were significantly lower than the even harmonic amplitudes, F(3,12)= 9.63, p=0.002. There was also a significant effect of lattice type, F(6,9)=4.59, p=0.02, with the random lattice having the smallest amplitudes. Finally, there was a highly significant interaction between lattice orientation and harmonic type: horizontal lattices elicited larger responses than vertical in the odd harmonics, but not in the even harmonics, F(3,12)=12.52, p<0.001.
To ensure that the lattice orientation effect was not due to non-linearities in the video monitor that are specific to stimulus orientation, we recorded from three observers with the monitor tilted by 90 deg. In each case, responses from the visually horizontal stimuli were larger than the vertical stimuli.
3.3 Swept texture response functions: adults
We next sought to estimate sensitivity to the orientation regularity of the textures by measuring evoked response amplitudes over the full range of stimulus coherence. This analysis also compared responses from horizontal and vertical lattices, but only for the random and rectangular configurations. The direction of the sweep was also examined, but preliminary analyses indicated that the effect of sweep direction was small so we therefore collapsed across this variable.
VEP amplitude in the adults was an approximately linear function of texture coherence for the first and third harmonics (Figure 5). The first harmonic is several times larger than the third harmonic (note different scales). Prompted by the differences observed in the fixed coherence experiment, we first compared the coherence response functions for horizontal (Figure 5A and C, gray symbols) and vertical global organizations (Figure 5A and C, black symbols). For the first harmonic (Figure 5A), extrapolation of the response to zero amplitude using the linear portions of the functions yielded thresholds of 17.18 ± 3.93% for the vertical orientation and 14.64 ± 2.37% for the horizontal orientation. These thresholds were not significantly different (p=0.55). The slope of the response function was slightly steeper for the horizontal textures, but the effect was not significant (p=0.18). The third harmonic showed a large difference in the gain of the response function, with horizontal textures leading to higher gains and a threshold estimated at 1.23 ± 6.9% (Figure 5C). Responses to the vertical texture condition were too weak to pass the criteria for delimiting the boundaries of the regression analysis (see Methods, section 2.8), so gain was not quantified and no threshold was determined.
Figure 5.

Average adult response functions (channel Oz) from the swept coherence study. Symbols show average amplitudes of spectral components at the first (top panels) and third (bottom panels) harmonics of the organized/random alternation rate. Left panels show the two orientation conditions collapsed across the two lattice conditions, and the right panels show the two lattice conditions averaged over the two orientation conditions. All curves are the average of two matched conditions, one that swept the coherence from low to high visibility, and the other that swept from high to low visibility. The solid lines indicate the regression functions used to determine the threshold and slope of the responses.
When we compared the two lattice types (Figure 5B and D), we observed a small, but significant difference in the slope of the first harmonic response functions between the rectangular (Figure 5B, black symbols) and random lattices, (Figure 5B, gray symbols) with the function being steeper for the rectangular lattice: 0.018 ± 0.003 versus 0.015 ± 0.003; p=0.0097.1 The third harmonics showed a non-significant trend in the same direction: 0.005 ± 0.002 versus 0.003 ± 0.001; p=0.094. Thresholds for the first harmonic were 15.414 ± 3.217 for the rectangular lattice and 15.527 ± 4.143 for the random lattice. Thresholds for the third harmonic were measurable for both lattice types when we pooled across orientation (Figure 5D) and were 12.811 ± 4.753 for the rectangular lattice and −1.765 ± 15.126 for the random lattice. Threshold estimates made after pooling response function across all conditions (sweep direction, orientation and lattice type) led to a first harmonic threshold 15.961 ± 2.917 and a third harmonic threshold of 10.186 ± 6.146.
3.4 Swept texture response functions: infants
Due to the limited testing time that was possible with the infants, they were tested with only the rectangular lattice. The rectangular lattice was used because it led to the largest responses in adults. A slower alternation rate was used, based on preliminary data and due to the very sluggish infant response to these stimuli (Norcia et al., 2005).
The infant response functions showed lower signal to noise ratio overall and vector averaging across observers was needed to obtain reliable response functions for the group. The response function for the horizontal lattice condition (Figure 6, gray symbols) was a nearly linear function of coherence with an estimated threshold of 59.0 ± 6.42%. The response function for the vertical lattice condition (Figure 6, black symbols) showed two response limbs. One limb lies at coherence values above 75% where it matches the horizontal function. These points have the highest the signal-to-noise ratios. Below this coherence, the vertical function has several points whose amplitudes are significantly different from zero based on the T2circ statistic (Victor & Mast, 1991) and are therefore signal. If the first limb of the function is used to estimate a threshold, a value of 19.59 ± 26.22% is obtained. The threshold for vertical patterns, while being lower than that for horizontal patterns, was not significantly different than that for horizontal patterns (p= 0.15). We did not compare gain for horizontal and vertical patterns due to the differences in the shape of the response function for the two orientations.
Figure 6.
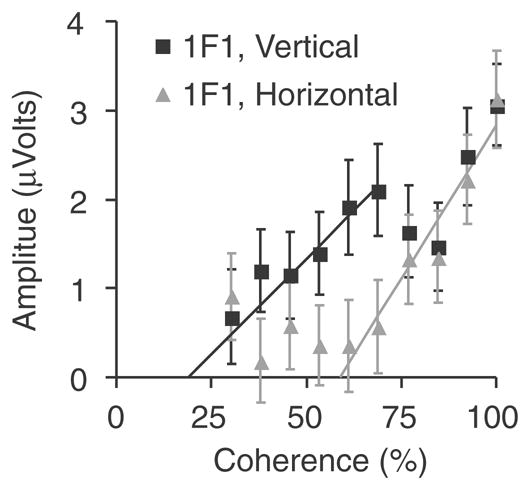
Average infant response functions (channel Oz) from the swept coherence study, averaged over two coherence sweep directions. The black symbols plot data from the vertical lattice orientation and the gray curve plots data from the horizontal lattice orientation. The solid lines indicate the regression functions used to determine the threshold and slope of the responses.
4. Discussion
As was noted in our previous study (Norcia et al., 2005), the VEP response of both infants and adults is sensitive to the global organization of textures composed of single-scale oriented elements. Sensitivity to the global organization is indicated by the presence of measurable odd harmonic components in the response to organized/random transitions that are absent in the responses to random/random transitions. The adult response contained odd harmonic content that was largest at the 2 Hz fundamental, with third harmonic amplitudes being several times lower. Despite the lower amplitude at the third harmonic, these responses were highly reliable and thresholds measured at the third harmonic for horizontal patterns were lower than those for patterns of either orientation measured at the first harmonic. By varying the orientation coherence of our textures, we have found that infants appear to be sensitive to only highly coherent patterns. Infant thresholds were only measurable at the fundamental frequency, which was 1 Hz. The lack of higher frequency components in the infant responses is consistent with the very sluggish waveforms we observed in our previous study.
The voltage-versus-coherence functions were approximately linear for both first and third harmonics in the adults over the full range of coherences, although the third harmonic response for vertical patterns was very weak. Infant coherence response functions were monotonically increasing for the horizontal patterns, but not for the vertical patterns. The fact that there are several significant points in the middle range of coherence for the vertical pattern suggests that infants, unlike adults may have a vertical rather than horizontal global orientation bias in their response.
Our adult coherence thresholds are roughly similar to those measured psychophysically for concentric arrays of Gabor patches (Achtman, Hess & Wang, 2003). They found best thresholds of around 7–10%. The precise value of the VEP threshold one chooses for comparison either with previous psychophysical data or infant data depends on which harmonic is chosen. Thresholds measured at the first harmonic were around 14%, and those measured at the third harmonic were around 1% for the horizontal pattern. It would seem that our third harmonic thresholds are much better than those of Achtman et al., (2003). However, the third harmonic threshold has a standard error of 7%, The 5% confidence limit on the upper bound of the adult threshold at the third harmonic is 1.2% + 1.64*7% or 12.2% which is in line with the psychophysical thresholds. The substantial error on the third harmonic threshold leads to physically impossible, negative-valued lower bound estimates of the threshold. This problem is likely due to our use of a very large coherence range (0–100%) to measure the voltage versus coherence function. While this strategy is a good one for measuring gain, it is less optimal for estimating threshold, because there are few actual data samples in the near threshold range. Concentrating the sweep on a finer sampling of low coherence values is likely to have lead to lower errors for the adult threshold.
Comparing infant and adult thresholds for the horizontal patterns is straight-forward for the first harmonic data: infant and adult statistical uncertainties are comparable and the linear regression is a good fit to both response functions. Standard propagation of errors indicates that adult thresholds at the first harmonic are better than those of the infants by a factor of 4.0+0.8. Comparison of infant and adult thresholds using the adult third harmonic data is more complex. Propagation of errors to estimate uncertainty on the infant/adult sensitivity ratio using the lower valued third harmonic threshold of the adults does not make sense because of the problem of negative lower bound thresholds. We can however place a conservative limit on this ratio by comparing the probable upper bound of the adult threshold (12.2%) to the probable lower bound of the infants which is 48.5% (59% −1.64*6.4%). This comparison shows that it is unlikely that adults are less than a factor of 4 times more sensitive than infants. We therefore conclude that infant and adult thresholds differ by a factor of 4 or more for the horizontal patterns.
The non-monotonic response function for vertical patterns in the infants complicates the interpretation of thresholds for these patterns. The monotonically increasing range is small and signal-to-noise ratio is low in the first-limb of the response function. The regression technique is known to have biases towards over-extrapolation in cases like this (Norcia et al., 1989). This bias effect, combined with the large statistical uncertainty of the measurement (26%) makes the estimate vertical sensitivity much more uncertain than that for horizontal sensitivity. Because of this large uncertainty, any comparison of infant and adult sensitivity is likely to be inaccurate.
The high degree of uncertainty on the infant vertical threshold also limits the ability to detect differences in sensitivity between the two orientations, if they are present. The probable upper bound sensitivity for vertical patterns in the infants is 62% (19.6% +1.64*26%) which is consistent with the mean value for horizontal patterns of 59%. While infant horizontal thresholds are numerically higher than those for vertical patterns, the thresholds are not significantly different. This contrasts with the adults where sensitivity is measurably higher for horizontal patterns (1.23% +/− 6/9% vs 17.18% +− 3.93%).
4.1 Relationship to previous studies of development
Two other orientation integration tasks similar to ours have been used to study development. A habituation-dishabituation study (Humphrey et al., 1988) that contrasted arrays of radially arranged line-segments from random ones found that 4 month-old infants could discriminate the two organizations, but thresholds were not determined. Two other studies have used Glass patterns in older children (Lewis, Ellemberg, Maurer, Dirks, Wilkinson & Wilson, 2004, Lewis, Ellemberg, Maurer, Wilkinson, Wilson, Dirks & Brent, 2002) and have found that thresholds are still immature in mid-childhood. Glass patterns are composed of arrays of dot pairs with the orientation-axis of the dot pairs being constrained to a global rule such as co-circularity. The overall structure of the Glass pattern can only be detected by long-range integration.
Patients with amblyopia, a failure of neural development, have elevated orientation discrimination thresholds for disordered Gabor-patch arrays that resemble our random-lattice configurations (Simmers & Bex (2004), but see Mansouri, Allen, Hess, Dakin & Ehrt (2004)). This suggests that normal experience during a developmental critical period may be necessary for global orientation mechanisms to mature. The deficits in amblyopia, coupled with the marked immaturity of the VEP to similar stimuli, suggest that long-range integration of orientation information is vulnerable to abnormal visual experience during development. The texture coherence VEP may thus provide an objective means to assess these disruptions as they occur during development and as they are potentially modified by treatment.
4.2 Relationship to other studies of spatial integration of orientation information
Spatial integration of orientation information relates more generally to other aspects of object and surface processing such as the continuity of contours (Beck, Rosenfeld & Ivry, 1989, Field et al., 1993, Knill, 2001, Kovacs & Julesz, 1993). One of the issues addressed in this literature is the specificity long-range integration mechanisms for collinearity of elements. The integration of Gabor-defined contours is robust when the elements along the path are collinear (neighboring elements aligned end-to-end) but not when they are aligned side-to-side (Field et al., 1993). A similar effect was seen with line segments (Beck et al., 1989). Contour integration tolerates polarity inversion of the elements along the contour (Field et al., 1993, Field, Hayes & Hess, 2000), but is quite sensitive to displacement of the elements off the spine of the contour (Hayes, 2000). Discrimination of the global orientation of a field of randomly placed Gabor patches is, on the other hand, as accurate as that obtained with gratings (Dakin & Watt, 1997), suggesting that the precise location of the local elements may not be critical limiting factor in determining the orientation discrimination threshold for textures.
In the present study, we examined the possible role of the relative position of elements within our textures by varying the type of lattice on which the elements were spaced and found small but measurable effects on response gain. A possible basis for this effect is a bias in the spatial pattern of feedback (Shmuel et al., 2005) and horizontal intrinsic connections (Bosking, Zhang, Schofield & Fitzpatrick, 1997, Schmidt, Kim, Singer, Bonhoeffer & Lowel, 1997, Sincich & Blasdel, 2001). These connections preferentially connect like-orientation orientation columns that are spatially aligned along the orientation axis. This arrangement may allow for differential encoding of collinear stimuli. The effects of different lattice organizations on human sensitivity to Gabor-defined textures has not been previously studied. Previous psychophysical studies have used either a rectangular lattice (Bonneh & Sagi, 1998, Bonneh & Sagi, 1999), a random lattice (Dakin, 2001, Dakin & Watt, 1997, Mansouri et al., 2004, Simmers & Bex, 2004) or polar lattices (Achtman et al., 2003). Given that textures, while rich in locally parallel structure do not contain an especially large proportion of collinear elements (Ben-Shahar, 2003), it is perhaps not surprising that the effect of the lattice type is small for these stimuli.
4.3 Effect of global orientation
We have found that supra-threshold response magnitude in adults depends on the absolute orientation of the organized texture, with horizontal configurations leading to the largest amplitudes. This effect was not present in infants, who showed, if anything the opposite trend. In our previous study (Norcia et al., 2005), we randomized the global orientation after every image update and therefore did not analyze responses to the separate global orientations.
Orientation biases have been observed previously in the VEP using grating stimuli (Arakawa, Tobimatsu, Kurita-Tashima, Nakayama, Kira & Kato, 2000, Frost & Kaminer, 1975, Maffei & Campbell, 1970, Moskowitz & Sokol, 1985, Nelson, Kupersmith, Seiple, Weiss & Carr, 1984, Sokol, Moskowitz & Hansen, 1987, Sokol, Moskowitz & Hansen, 1989). However these biases are consistent with the well-known “oblique effect” which involves a superiority of sensitivity to both horizontal and vertical orientations relative to oblique ones (see Li, Peterson & Freeman (2003) for a recent review of the neural basis of the oblique effect). A direct comparison of the amplitude and latency of the grating VEPs also showed no significant differences between horizontal and vertical patterns in normal adults (Logi, Pellegrinetti, Bonfiglio, Baglini, Siciliano, Ludice & Sartucci, 2001)
What could underlie the orientation bias we have observed? Our stimuli differ from gratings in that the orientation of the organized patterns can only be detected by integration of orientation information across at least pairs of patches separated by a distance of several carrier wavelengths. It is possible that the orientation bias we have observed is a property of long-range integration mechanisms. The specificity of intra-cortical connections for similar orientation domains could account for sensitivity to organized versus random textures via neural interactions that are different or more prevalent than those occurring between dissimilar orientation domains. However, an additional mechanism is needed to account for the orientation bias we have observed. At present, no comparable bias has been reported in either the system of horizontal connections or feedback connections. A horizontal/vertical orientation bias has however been reported in a recent fMRI study (Knyazeva, Fornari, Meuli, Innocenti & Maeder, 2006). That study found that horizontal drifting gratings produced larger activations than did vertical ones in extra-striate areas located in the lingual gyrus, middle occipital gyrus and cuneus which they suggest indicated sources in V2 and V3. No comparable bias has been observed with gratings in V1 (Furmanski & Engel, 2000), although an oblique effect was present. The mechanism underlying the effect of global orientation observed in the present study thus remains unknown, but may involve specializations specific to extra-striate cortex.
Acknowledgments
Supported by EY015790, Cure Autism Now (FP) and the Smith-Kettlewell Eye Research Institute. We would like to thank Margaret McGovern for her assistance in conducting the infant experiments.
Footnotes
Note that amplitudes at 100% coherence in the sweep response functions of Figure 5 are expected to be lower than the corresponding amplitudes in Figure 4. The sweep response amplitudes for our threshold regression analysis were obtained by averaging complex Fourier coefficients (see Methods, §2.7) before computing the amplitude of the average; the data in Figure 4 represent the averages of scalar amplitudes (obtained for each observer prior to averaging), which were the dependent variables in the associated MANOVA. In general, phase variability between observers tends to make the amplitude of the complex average smaller than the average of the scalar amplitudes.
Publisher's Disclaimer: This is a PDF file of an unedited manuscript that has been accepted for publication. As a service to our customers we are providing this early version of the manuscript. The manuscript will undergo copyediting, typesetting, and review of the resulting proof before it is published in its final citable form. Please note that during the production process errors may be discovered which could affect the content, and all legal disclaimers that apply to the journal pertain.
Contributor Information
Francesca Pei, Department of Physiology and Biochemistry, University of Pisa.
Mark W. Pettet, The Smith-Kettlewell Eye Research Institute
Anthony M. Norcia, The Smith-Kettlewell Eye Research Institute
References
- Achtman RL, Hess RF, Wang YZ. Sensitivity for global shape detection. J Vis. 2003;3(10):616–624. doi: 10.1167/3.10.4. [DOI] [PubMed] [Google Scholar]
- Angelucci A, Levitt JB, Walton EJ, Hupe JM, Bullier J, Lund JS. Circuits for local and global signal integration in primary visual cortex. J Neurosci. 2002;22(19):8633–8646. doi: 10.1523/JNEUROSCI.22-19-08633.2002. [DOI] [PMC free article] [PubMed] [Google Scholar]
- Arakawa K, Tobimatsu S, Kurita-Tashima S, Nakayama M, Kira JI, Kato M. Effects of stimulus orientation on spatial frequency function of the visual evoked potential. Exp Brain Res. 2000;131(1):121–125. doi: 10.1007/s002219900274. [DOI] [PubMed] [Google Scholar]
- Atkinson J, Braddick O. Visual segmentation of oriented textures by infants. Behav Brain Res. 1992;49(1):123–131. doi: 10.1016/s0166-4328(05)80202-5. [DOI] [PubMed] [Google Scholar]
- Beck J, Rosenfeld A, Ivry R. Line segregation. Spat Vis. 1989;4(2–3):75–101. doi: 10.1163/156856889x00068. [DOI] [PubMed] [Google Scholar]
- Ben-Shahar O. The perceptual organization of texture flow: a contextual inference approach. IEEE Trans Pattern analysis and machine intelligence. 2003;25:401–417. [Google Scholar]
- Blair RC, Karniski W. An alternative method for significance testing of waveform difference potentials. Psychophysiology. 1993;30(5):518–524. doi: 10.1111/j.1469-8986.1993.tb02075.x. [DOI] [PubMed] [Google Scholar]
- Bonneh Y, Sagi D. Effects of spatial configuration on contrast detection. Vision Res. 1998;38(22):3541–3553. doi: 10.1016/s0042-6989(98)00045-5. [DOI] [PubMed] [Google Scholar]
- Bonneh Y, Sagi D. Configuration saliency revealed in short duration binocular rivalry. Vision Res. 1999;39(2):271–281. doi: 10.1016/s0042-6989(98)00112-6. [DOI] [PubMed] [Google Scholar]
- Bosking WH, Zhang Y, Schofield B, Fitzpatrick D. Orientation selectivity and the arrangement of horizontal connections in tree shrew striate cortex. J Neurosci. 1997;17(6):2112–2127. doi: 10.1523/JNEUROSCI.17-06-02112.1997. [DOI] [PMC free article] [PubMed] [Google Scholar]
- Burkhalter A. Development of forward and feedback connections between areas V1 and V2 of human visual cortex. Cereb Cortex. 1993;3(5):476–487. doi: 10.1093/cercor/3.5.476. [DOI] [PubMed] [Google Scholar]
- Burkhalter A, Bernardo KL, Charles V. Development of local circuits in human visual cortex. J Neurosci. 1993;13(5):1916–1931. doi: 10.1523/JNEUROSCI.13-05-01916.1993. [DOI] [PMC free article] [PubMed] [Google Scholar]
- Callaway EM, Katz LC. Effects of binocular deprivation on the development of clustered horizontal connections in cat striate cortex. Proc Natl Acad Sci U S A. 1991;88(3):745–749. doi: 10.1073/pnas.88.3.745. [DOI] [PMC free article] [PubMed] [Google Scholar]
- Cavanaugh JR, Bair W, Movshon JA. Selectivity and spatial distribution of signals from the receptive field surround in macaque V1 neurons. J Neurophysiol. 2002;88(5):2547–2556. doi: 10.1152/jn.00693.2001. [DOI] [PubMed] [Google Scholar]
- Chino YM, Smith EL, 3rd, Hatta S, Cheng H. Postnatal development of binocular disparity sensitivity in neurons of the primate visual cortex. J Neurosci. 1997;17(1):296–307. doi: 10.1523/JNEUROSCI.17-01-00296.1997. [DOI] [PMC free article] [PubMed] [Google Scholar]
- Dakin SC. Information limit on the spatial integration of local orientation signals. J Opt Soc Am A Opt Image Sci Vis. 2001;18(5):1016–1026. doi: 10.1364/josaa.18.001016. [DOI] [PubMed] [Google Scholar]
- Dakin SC, Watt RJ. The computation of orientation statistics from visual texture. Vision Res. 1997;37(22):3181–3192. doi: 10.1016/s0042-6989(97)00133-8. [DOI] [PubMed] [Google Scholar]
- Field DJ, Hayes A, Hess RF. Contour integration by the human visual system: evidence for a local “association field”. Vision Res. 1993;33(2):173–193. doi: 10.1016/0042-6989(93)90156-q. [DOI] [PubMed] [Google Scholar]
- Field DJ, Hayes A, Hess RF. The roles of polarity and symmetry in the perceptual grouping of contour fragments. Spat Vis. 2000;13(1):51–66. doi: 10.1163/156856800741018. [DOI] [PubMed] [Google Scholar]
- Frost BJ, Kaminer JJ. The orientation anisotropy and orientation constancy: a visual evoked potential study. Perception. 1975;4(1):51–58. doi: 10.1068/p040051. [DOI] [PubMed] [Google Scholar]
- Furmanski CS, Engel SA. An oblique effect in human primary visual cortex. Nat Neurosci. 2000;3(6):535–536. doi: 10.1038/75702. [DOI] [PubMed] [Google Scholar]
- Gibson JJ. The Perception of the Visual World. Boston: Houghton Mifflin; 1950. [Google Scholar]
- Gilbert CD, Wiesel TN. Columnar specificity of intrinsic horizontal and corticocortical connections in cat visual cortex. J Neurosci. 1989;9(7):2432–2442. doi: 10.1523/JNEUROSCI.09-07-02432.1989. [DOI] [PMC free article] [PubMed] [Google Scholar]
- Hayes A. Apparent position governs contour-element binding by the visual system. Proc Biol Sci. 2000;267(1450):1341–1345. doi: 10.1098/rspb.2000.1148. [DOI] [PMC free article] [PubMed] [Google Scholar]
- Hel Or Y, Zucker SW. Texture fields and texture flows: sensitivity to differences. Spat Vis. 1989;4(2–3):131–139. doi: 10.1163/156856889x00086. [DOI] [PubMed] [Google Scholar]
- Humphrey G, Muir D, Dodwell P, Humphrey D. The perception of structure in vectorpatterns by 4-month-old infants. Canadian Journal of Psychology. 1988;42:35–43. doi: 10.1037/h0084179. [DOI] [PubMed] [Google Scholar]
- Kiorpes L, Bassin SA. Development of contour integration in macaque monkeys. Vis Neurosci. 2003;20(5):567–575. doi: 10.1017/s0952523803205101. [DOI] [PubMed] [Google Scholar]
- Knill DC. Contour into texture: information content of surface contours and texture flow. J Opt Soc Am A Opt Image Sci Vis. 2001;18(1):12–35. doi: 10.1364/josaa.18.000012. [DOI] [PubMed] [Google Scholar]
- Knyazeva MG, Fornari E, Meuli R, Innocenti G, Maeder P. Imaging of a synchronous neuronal assembly in the human visual brain. Neuroimage. 2006;29(2):593–604. doi: 10.1016/j.neuroimage.2005.07.045. [DOI] [PubMed] [Google Scholar]
- Kovacs I, Julesz B. A closed curve is much more than an incomplete one: effect of closure in figure-ground segmentation. Proc Natl Acad Sci U S A. 1993;90(16):7495–7497. doi: 10.1073/pnas.90.16.7495. [DOI] [PMC free article] [PubMed] [Google Scholar]
- Kovacs I, Kozma P, Feher A, Benedek G. Late maturation of visual spatial integration in humans. Proc Natl Acad Sci U S A. 1999;96(21):12204–12209. doi: 10.1073/pnas.96.21.12204. [DOI] [PMC free article] [PubMed] [Google Scholar]
- Lewis TL, Ellemberg D, Maurer D, Dirks M, Wilkinson F, Wilson HR. A window on the normal development of sensitivity to global form in Glass patterns. Perception. 2004;33(4):409–418. doi: 10.1068/p5189. [DOI] [PubMed] [Google Scholar]
- Lewis TL, Ellemberg D, Maurer D, Wilkinson F, Wilson HR, Dirks M, Brent HP. Sensitivity to global form in glass patterns after early visual deprivation in humans. Vision Res. 2002;42(8):939–948. doi: 10.1016/s0042-6989(02)00041-x. [DOI] [PubMed] [Google Scholar]
- Li A, Zaidi Q. Perception of three-dimensional shape from texture is based on patterns of oriented energy. Vision Res. 2000;40(2):217–242. doi: 10.1016/s0042-6989(99)00169-8. [DOI] [PubMed] [Google Scholar]
- Li B, Peterson MR, Freeman RD. Oblique effect: a neural basis in the visual cortex. J Neurophysiol. 2003;90(1):204–217. doi: 10.1152/jn.00954.2002. [DOI] [PubMed] [Google Scholar]
- Logi F, Pellegrinetti A, Bonfiglio L, Baglini O, Siciliano G, Ludice A, Sartucci F. Effects of grating spatial orientation on visual evoked potentials and contrast sensitivity in multiple sclerosis. Acta Neurol Scand. 2001;103(2):97–104. doi: 10.1034/j.1600-0404.2001.103002097.x. [DOI] [PubMed] [Google Scholar]
- Maffei L, Campbell FW. Neurophysiological localization of the vertical and horizontal visual coordinates in man. Science. 1970;167(917):386–387. doi: 10.1126/science.167.3917.386. [DOI] [PubMed] [Google Scholar]
- Malach R, Amir Y, Harel M, Grinvald A. Relationship between intrinsic connections and functional architecture revealed by optical imaging and in vivo targeted biocytin injections in primate striate cortex. Proc Natl Acad Sci U S A. 1993;90(22):10469–10473. doi: 10.1073/pnas.90.22.10469. [DOI] [PMC free article] [PubMed] [Google Scholar]
- Mansouri B, Allen HA, Hess RF, Dakin SC, Ehrt O. Integration of orientation information in amblyopia. Vision Res. 2004;44(25):2955–2969. doi: 10.1016/j.visres.2004.06.017. [DOI] [PubMed] [Google Scholar]
- Moskowitz A, Sokol S. Effect of stimulus orientation on the latency and amplitude of the VEP. Invest Ophthalmol Vis Sci. 1985;26(2):246–248. [PubMed] [Google Scholar]
- Nelson JI, Kupersmith MJ, Seiple WH, Weiss PA, Carr RE. Spatiotemporal conditions which elicit or abolish the oblique effect in man: direct measurement with swept evoked potential. Vision Res. 1984;24(6):579–586. doi: 10.1016/0042-6989(84)90112-3. [DOI] [PubMed] [Google Scholar]
- Norcia AM, Clarke M, Tyler CW. Digital filtering and robust regression techniques for estimating sensory thresholds from the evoked potential. IEEE Eng Med Biol Magazine. 1985;4:26–32. doi: 10.1109/MEMB.1985.5006224. [DOI] [PubMed] [Google Scholar]
- Norcia AM, Pei F, Bonneh Y, Hou C, Sampath V, Pettet MW. Development of sensitivity to texture and contour information in the human infant. J Cogn Neurosci. 2005;17(4):569–579. doi: 10.1162/0898929053467596. [DOI] [PubMed] [Google Scholar]
- Norcia AM, Tyler CW, Hamer RD, Wesemann W. Measurement of spatial contrast sensitivity with the swept contrast VEP. Vision Res. 1989;29(5):627–637. doi: 10.1016/0042-6989(89)90048-5. [DOI] [PubMed] [Google Scholar]
- Nothdurft HC. Orientation sensitivity and texture segmentation in patterns with different line orientation. Vision Res. 1985a;25(4):551–560. doi: 10.1016/0042-6989(85)90159-2. [DOI] [PubMed] [Google Scholar]
- Nothdurft HC. Sensitivity for structure gradient in texture discrimination tasks. Vision Res. 1985b;25(12):1957–1968. doi: 10.1016/0042-6989(85)90020-3. [DOI] [PubMed] [Google Scholar]
- Nothdurft HC. Texture segmentation and pop-out from orientation contrast. Vision Res. 1991;31(6):1073–1078. doi: 10.1016/0042-6989(91)90211-m. [DOI] [PubMed] [Google Scholar]
- Pennefather PM, Chandna A, Kovacs I, Polat U, Norcia AM. Contour detection threshold: repeatability and learning with ‘contour cards’. Spat Vis. 1999;12(3):257–266. doi: 10.1163/156856899x00157. [DOI] [PubMed] [Google Scholar]
- Rieth C, Sireteanu R. Texture segmentation and ‘pop-out’ in infants and children: the effect of test field size. Spat Vis. 1994;8(2):173–191. doi: 10.1163/156856894x00323. [DOI] [PubMed] [Google Scholar]
- Rockland KS, Lund JS. Widespread periodic intrinsic connections in the tree shrew visual cortex. Science. 1982;215(4539):1532–1534. doi: 10.1126/science.7063863. [DOI] [PubMed] [Google Scholar]
- Rockland KS, Lund JS. Intrinsic laminar lattice connections in primate visual cortex. J Comp Neurol. 1983;216(3):303–318. doi: 10.1002/cne.902160307. [DOI] [PubMed] [Google Scholar]
- Schmidt KE, Kim DS, Singer W, Bonhoeffer T, Lowel S. Functional specificity of long-range intrinsic and interhemispheric connections in the visual cortex of strabismic cats. J Neurosci. 1997;17(14):5480–5492. doi: 10.1523/JNEUROSCI.17-14-05480.1997. [DOI] [PMC free article] [PubMed] [Google Scholar]
- Shmuel A, Korman M, Sterkin A, Harel M, Ullman S, Malach R, Grinvald A. Retinotopic axis specificity and selective clustering of feedback projections from V2 to V1 in the owl monkey. J Neurosci. 2005;25(8):2117–2131. doi: 10.1523/JNEUROSCI.4137-04.2005. [DOI] [PMC free article] [PubMed] [Google Scholar]
- Simmers AJ, Bex PJ. The representation of global spatial structure in amblyopia. Vision Res. 2004;44(5):523–533. doi: 10.1016/j.visres.2003.10.010. [DOI] [PubMed] [Google Scholar]
- Sincich LC, Blasdel GG. Oriented axon projections in primary visual cortex of the monkey. J Neurosci. 2001;21(12):4416–4426. doi: 10.1523/JNEUROSCI.21-12-04416.2001. [DOI] [PMC free article] [PubMed] [Google Scholar]
- Singer W. Development and plasticity of cortical processing architectures. Science. 1995;270(5237):758–764. doi: 10.1126/science.270.5237.758. [DOI] [PubMed] [Google Scholar]
- Sireteanu R, Rieth C. Texture segregation in infants and children. Behav Brain Res. 1992;49(1):133–139. doi: 10.1016/s0166-4328(05)80203-7. [DOI] [PubMed] [Google Scholar]
- Sokol S, Moskowitz A, Hansen V. Electrophysiological evidence for the oblique effect in human infants. Invest Ophthalmol Vis Sci. 1987;28(4):731–735. [PubMed] [Google Scholar]
- Sokol S, Moskowitz A, Hansen V. Evoked potential and preferential looking correlates of the oblique effect in 3-month-old infants. Doc Ophthalmol. 1989;71(3):321–328. doi: 10.1007/BF00170980. [DOI] [PubMed] [Google Scholar]
- Sprent P. Applied nonparametric statistical methods. Boca Raton, LA: Chapman and Hall/CRC; 2000. [Google Scholar]
- Tang Y, Norcia AM. An adaptive filter for steady-state evoked responses. Electroencephalogr Clin Neurophysiol. 1995;96(3):268–277. doi: 10.1016/0168-5597(94)00309-3. [DOI] [PubMed] [Google Scholar]
- Tychsen L, Wong AM, Burkhalter A. Paucity of horizontal connections for binocular vision in V1 of naturally strabismic macaques: Cytochrome oxidase compartment specificity. J Comp Neurol. 2004;474(2):261–275. doi: 10.1002/cne.20113. [DOI] [PubMed] [Google Scholar]
- Victor JD, Mast J. A new statistic for steady-state evoked potentials. Electroencephalogr Clin Neurophysiol. 1991;78(5):378–388. doi: 10.1016/0013-4694(91)90099-p. [DOI] [PubMed] [Google Scholar]
- White LE, Coppola DM, Fitzpatrick D. The contribution of sensory experience to the maturation of orientation selectivity in ferret visual cortex. Nature. 2001;411(6841):1049–1052. doi: 10.1038/35082568. [DOI] [PubMed] [Google Scholar]
- Wolfson SS, Landy MS. Discrimination of orientation-defined texture edges. Vision Res. 1995;35(20):2863–2877. doi: 10.1016/0042-6989(94)00302-3. [DOI] [PubMed] [Google Scholar]
- Wolfson SS, Landy MS. Examining edge- and region-based texture analysis mechanisms. Vision Res. 1998;38(3):439–446. doi: 10.1016/s0042-6989(97)00153-3. [DOI] [PubMed] [Google Scholar]
- Zhang B, Zheng J, Watanabe I, Maruko I, Bi H, Smith EL, 3rd, Chino Y. Delayed maturation of receptive field center/surround mechanisms in V2. Proc Natl Acad Sci U S A. 2005;102(16):5862–5867. doi: 10.1073/pnas.0501815102. [DOI] [PMC free article] [PubMed] [Google Scholar]
- Zufferey PD, Jin F, Nakamura H, Tettoni L, Innocenti GM. The role of pattern vision in the development of cortico-cortical connections. Eur J Neurosci. 1999;11(8):2669–2688. doi: 10.1046/j.1460-9568.1999.00683.x. [DOI] [PubMed] [Google Scholar]