

Abstract
Purpose
To evaluate heritability of intrinsic radiosensitivity, induction of apoptosis in lymphocyte subpopulations was determined on samples from related individuals belonging to large kindred-families.
Methods and Materials
Quiescent lymphocytes from 334 healthy individuals were gamma-irradiated in vitro. Apoptosis was determined 18 hours post-irradiation by 8-color flow cytometry. Radiosensitivity was quantified from dose-effect curves. Intra-familial correlations and heritability were computed on 199 father-mother-offspring trios using the programs. SOLAR and SAGE. Segregation analyses were conducted using SAGE.
Results
Marked differential susceptibility of naïve and memory T lymphocytes was demonstrated, and although age and sex were significant covariates, their effects only accounted for a minor part of the inter-individual variation. Parent-offspring and sib-sib correlations were significant for radiosensitivity of B cells, T4, T8, and of effector memory (EM) T4- and T8 subpopulations. In the T4-EM subpopulation, the phenotype showed correlations most consistent with dominant or additive genetic effects and segregation analysis was consistent with the contribution of a bi-allelic dominant locus.
Conclusions
Heritability was demonstrated for the susceptibility to ionizing radiation induced apoptosis of lymphocyte populations and segregation of the T4-EM radiosensitivity phenotype was consistent with a simple Mendelian transmission model involving one major gene.
Keywords: Individual radiosensitivity, radiation biology, family studies, apoptosis
Introduction
Association between major changes in chromosomal radiosensitivity and increased susceptibility to cancer has been demonstrated for several rare cancer prone monogenic conditions, most notably Ataxia Telangiectasia, Bloom’s syndrome, Fanconi anemia, and breast cancer 1–3. It has also been suggested that chromosomal radiosensitivity may be an inherited trait in families of breast cancer patients 4 and that G2 chromosomal radiosensitivity shows significant heritability in a cohort of Danish families of survivors of childhood cancer 5. In mice, the Prkdc-gene was identified as a candidate for a gene controlling in vivo thymocyte sensitivity to radiation induced apoptosis, as well as for a gene controlling radiation lymphomagenesis6. These observations support the possibility that subtle inter-individual variation in radiosensitivity in humans may contribute to cancer susceptibility in the general population and that this trait may in part be genetically determined.
Numerous in vitro methods have been developed and applied to quantify individual cellular radiosensitivity. However, often these methods may involve laborious experimental procedures7–10 with large experimental variance, rendering them inadequate for robust in vitro phenotyping of large numbers of samples. Immunophenotyping by flow-cytometry was proposed to enable the monitoring of ionizing radiation induced apoptosis (IRIA) of specific lymphocyte populations on a large number of human samples and individuals 11–13. It was shown that T4 lymphocytes are more resistant than T8 lymphocytes, in turn more resistant than B cells. Differential sensitivity to apoptosis of lymphocyte populations may have a physiological relevance since apoptosis is known to play a crucial role in the development and regulation of immune system response.
Because the proportions of the three main lymphocyte types exhibit substantial variations among individuals, the characterization of the radiosensitivity of the blood cells of an individual requires that each population be characterized independently. We have previously developed a six-color immunophenotyping strategy that enabled the simultaneous but independent monitoring of apoptosis in T4- and T8 lymphocytes and B cells, thus precisely characterizing the differential radiosensitivity of these three lymphocyte populations. This technique revealed that the principal source of IRIA phenotypic variance could be attributed to inter-individual differences. In addition, an age effect was detected for T8 lymphocytes IRIA, and sex was shown to have a notable influence on T4 lymphocytes IRIA. These combined effects remained small, since, after correction for age and sex, variance decomposition of the IRIA data demonstrated, with high significance, that between 79 and 85% of the experimental variance could still be attributed to inter-individual differences.
The marked differences in radiosensitivity of the three major types of lymphocytes could be influenced by differences in IRIA of their subpopulations. This hypothesis is supported by the observation that, in the mouse, survival of naïve T lymphocytes was 8 times lower than memory T lymphocytes after in vivo irradiation 14 and that in humans, naïve subpopulations appeared to be more susceptible to irradiation than memory subpopulations 15.
To investigate this hypothesis, we extended the immunophenotyping panel by adding CD62L and CD45RA antibodies to the assay comprising already AnnexinV, CD3, CD19, CD4, CD8, and Hoechst33258. Using this modified AnnexinV assay, simultaneous quantification of apoptosis in naïve- and different memory T lymphocyte subsets was achieved independently. This technique was applied to blood samples from healthy related individuals within large families that were collected specifically for this study. Quiescent primary lymphocytes were phenotyped, and analyses of the resulting data were performed taking in account donor familial relationships to further document the involvement of genetic polymorphism in individual IRIA variability.
Materials and methods
Samples—study population
Inclusion of volunteers in the research protocol followed a medical interview and informed, written consent in accordance with Paris-Cochin ethical board (IRB) approval. A total of 334 healthy adults with ages ranging from 18 to 93 years (mean 47.6 years) provided blood samples. Of the individuals, 177 were females and 157 were males. 325 individuals were related, and members of 38 large families. Venous blood was drawn from healthy normal volunteers and all the blood samples were processed to frozen PBL samples within 6 hours (average 180 minutes). A total of 354 blood samples were included in this study (9 individuals were sampled twice).
Composition of experimental groups
354 samples were run in groups of 10 to 15 samples in series of experiments following either of two different experimental designs. In the first experimental design, samples of related individuals (father-mother-offspring) were grouped, and processed simultaneously. In the second experimental design, samples were randomized before grouping of samples into series that were processed simultaneously. About 100 father-mother-offspring trios were processed through each experimental design. Each group of samples comprised at least 4 and up to 12 non related individuals.
Sample preparation and flow cytometry
Isolation of peripheral blood lymphocytes (PBL), storage, sample preparation and irradiation followed methods, as described 11
Eighteen hours after irradiation, cells were labeled by addition of AnnexinV-fluorescein isothiocyanate (AnV-FITC; BD), CD62L-phycoerythrin (CD62L-PE; kindly provided by Dr. M. Roederer, VRC-NIH), CD3-phycoerythrin-texas-red (CD3-PETxR; Coulter); CD19-phycoerythrin-cyanin 5 (CD19-PECy5; Dako,), CD4-phycoerythrin-cyanin 7 (CD4-PECy7; BD) CD45RA-allophycocyanin (CD45RA-APC; BD) and CD8 allophycocyanin-cyanin 7 (CD8-APCCy7; BD), incubated for 20 min at room temperature and washed once with AnnexinV-buffer11.
Subsequently, 50 μL of AnnexinV-buffer, containing 0.2 μg/mL Hoechst 33258 (Molecular Probes), were added. CompBeads (BD) were used for fluorescence spill compensation of each individual experiment. Samples were analyzed using a Cyan LX (Dako). Detector response was standardized using single-peak Rainbow fluorescent particles (RFP-30-5A; SpheroTech). Uncompensated 10-parameter, listmode data (including forward- and side scatter; FSC and SSC) was acquired using Summit software; files contained an average of 1.9×10⁵ events.
Data Analysis
Batch analysis was performed using FlowJo (TreeStar). Non-lymphocyte events were excluded by an appropriate scattergate, shaped to include apoptotic lymphocytes (lower FSC, higher SSC). Dead cells were excluded on HO33258 fluorescence positivity. T and non-T lymphocytes were identified on the basis of PETxR fluorescence (CD3). A PECy7 (CD4) versus APCCy7 (CD8) histogram allowed identification of T4 and T8 lymphocytes. An APC (CD45RA) versus PE (CD62L) histogram allowed discrimination between naïve (Naïve; CD62L+CD45RA+), central-memory (CM; CD62L+CD45RA-), effector-memory (EM; CD62L-CD45RA-), and terminal-effector (TE; CD62L-CD45RA+) T4 and T8. Finally, B cells (B) were determined on a bivariate histogram of APC (CD45RA) vs. PECy5 (CD19) of non-T lymphocytes. To all populations, the same gate (bivariate plot of FSC versus FITC fluorescence (AnV)) was applied to identify apoptotic cells.
Measurement of IRIA
Dose-effect curves were generated for the evaluation of radiosensitivity 11. For every individual, the coefficient of the exponential regression was recorded as radiosensitivity-phenotypic value for each of the cell populations.
As previously 11, correction for inter-experiment variability was achieved by normalization based on mean phenotype values per experiment. Normalization values were obtained by averaging at least 4 unrelated individuals (mean 5) in the first series of experiments, and at least 7 (mean 9) in the second series. Related individuals were excluded to prevent a reduction of the contribution of genetic variance in the overall phenotypic variance. This approach reduced inter-experimental variance by a factor 2 (from 0.37 to 0.18) in the first series, and removed inter-experimental variance in the second series (from 0.16 to 0.00).
Genetic analysis of IRIA data
We used the mean of duplicate measurements as the phenotypic value for all of the individuals measured twice. Covariate screening and calculation of total heritability was done using SOLAR v2 (S.F.B.R., 2005). Genetic analyses were conducted using the program SAGE v5.1 (S.A.G.E., 2005). We first computed the familial correlations among pairs of first-degree relatives using the program FCOR, which corrects the standard errors for non-independence of relative pairs. We conducted segregation analysis using the program SEGREG, which applies the Class D regressive models (Bonney 16, 17). We assumed 3 types of individuals in the population, AA, AB, and BB with means μAA, μAB, μBB, and common variance, σ2. Under a Mendelian model, the types correspond to the three genotypes. We estimated qA, the frequency of the A allele and assumed that the proportions of AA, AB, and BB are in Hardy-Weinberg equilibrium. We defined the transmission probabilities τ 1, τ 2, and τ 3, which are the probabilities that a parent with genotype AA, AB, and BB, transmits allele A, respectively. We also allowed for a residual sib-sib (ρss) and parent-offspring (ρpo) correlation. We applied a power transformation using the George-Elston method 18 with parameters λ1 (power parameter) and λ2 (shift parameter).
For the “no major gene” model, the three τ’s are constrained to be equal, indicating that parental type does not affect offspring type. For the Mendelian model, the τ’s are constrained to their theoretical values of 1, 0.5, and 0. To test for dominance or recessive effects, models with two means (i.e. two genotypes constrained to be the same) were compared to models with three means. We assumed that there were no correlations between spouses and that sib-sib and parent-offspring correlations were equal. We compared models where the trait was adjusted for age and sex prior to analysis to models where age and sex were included in the model. Analysis was conducted with and without power transformation of the trait. Since the families were unselected for the trait, no ascertainment correction was included.
Both the “no major gene” and Mendelian major gene models are nested in a general model where the three τ’s s are unconstrained, although τ 2 is a function of τ 1, τ 3 and q 19. Likelihood ratio tests were computed as −2 times the difference in likelihoods between the general and restricted models. The test statistic follows a chi-square with degrees of freedom equal to the difference in number of parameters estimated under the two models. The no major gene chi-square test has 2 degrees of freedom. For the Mendelian cases, some parameters are constrained to boundaries, and the thresholds are taken from mixtures of chi-square distributions 20. Akaike Information Criterion A can be used to select the most parsimonious model and is helpful for comparing non-nested models.
Results
Phenotyping
For determination of IRIA susceptibility we applied a panel of markers that provided reliable identification of naïve (Naïve), central memory (CM), effector memory (EM), and terminal effector (TE) T4-, and T821, as well as that of B cells. Figure 1 provides a representative example of data analysis for a sample that was irradiated at 1Gy.
Figure 1.
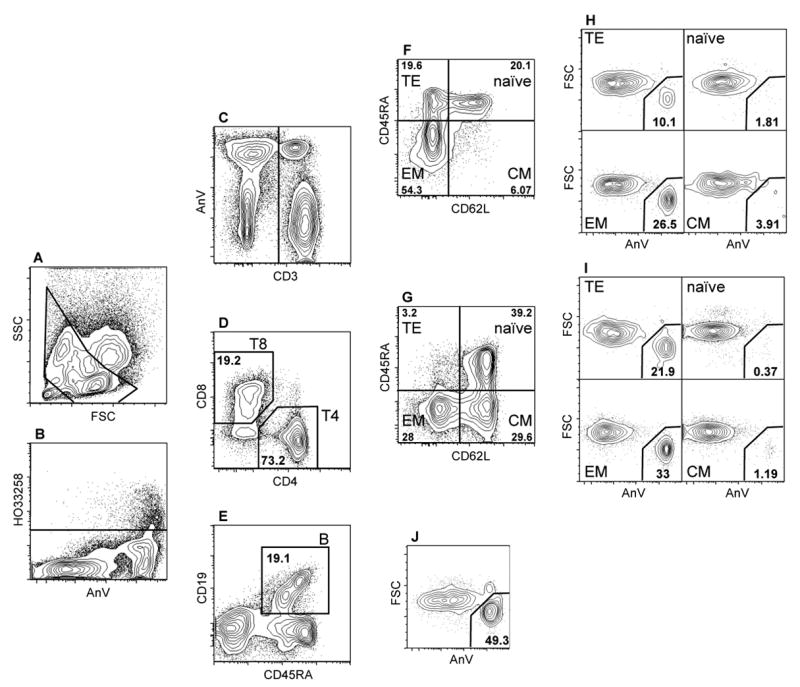
Analysis of 10-parameter list mode data for determination of ionizing radiation induced apoptosis (IRIA) in lymphocyte subpopulations. Panels show the progressive gating to obtain B cells (A, B, C and E), and CD4 and CD8 T lymphocytes (A, B, C, D). Panels F and G illustrate definition of naïve (Naïve), central memory (CM), effector memory (EM), and terminal effector (TE) T4- and T8 lymphocytes, respectively. Placement of the CD45RA gate was done separately for CD4 and CD8 T cells, because T4 lymphocytes express lower levels of CD45RA. Panels H and I indicate definition of apoptotic cells within T8- and T4 lymphocytes subpopulations, respectively, whereas Panel J indicates apoptotic B cells. Panel A: FSC vs SSC; panel B: AnnexinV vs HO33258; panel C: CD3 vs AnnexinV; panel D: CD4 vs CD8; panel E: CD45RA vs CD19; panels F and G: CD62L vs CD45RA; panel H, I and J: AnnexinV vs FSC.
Collected data files contained an average of 1.3×10⁵ live singlet lymphocytes (Figure 1B), with large inter-individual variation in the quantitative composition of lymphocyte pools (Table 1). The less abundant cell types were most frequently T4-TE, T8-TE and T8-CM (Table 1, Figure 1G)
Table 1. Count and relative proportion of lymphocyte populations in the investigated samples.
Average counts with standard deviation (S.D.) are given for T4 lymphocytes (CD3+CD4+; T4), T8 lymphocytes (CD3+CD8+; T8) and B cells (CD3−CD19+; B). For T4- and T8 lymphocytes, average proportions (of respective parent populations) with standard deviation (S.D.) are given for four subpopulations; naïve (CD62L+CD45RA+; Naïve), central memory (CD62L+CD45RA−; CM), effector memory (CD62L−CD45RA−; EM), and terminal effector (CD62L−CD45RA+; TE).
| population | count (S.D.) | subpopulation | proportion (S.D.) |
|---|---|---|---|
| T4 | 6.1 104(3.5 104) | T4-TE | 4.4 (3.1) |
| T4-EM | 25.4 (7.8) | ||
| T4-CM | 32.4 (8.2) | ||
| T4-Naïve | 37.8 (11.6) | ||
| T8 | 2.1 104(1.5 104) | T8-TE | 17.6 (8.6) |
| T8-EM | 41.6 (12.2) | ||
| T8-CM | 12.3 (6.7) | ||
| T8-Naïve | 28.5 (14.6) | ||
| B | 7.6 104(5.7 103) |
Quantification of ionizing radiation induced apoptosis
In spite of their marked differential IRIA, the proportions of lymphocyte subpopulations remained stable with the irradiation dose, indicating that the experimental procedure maintained our ability to observe each subpopulation in the dose range used (Figure 2; inset). In each of the three main types of lymphocytes (B, T4 and T8), the proportion of apoptotic cells increased with irradiation dose. The rate of increase was highest in B cells, intermediate in T8 lymphocytes and lowest in T4 lymphocytes. In addition, the proportion of AnV positive cells differed among the T lymphocyte subpopulations.
Figure 2.
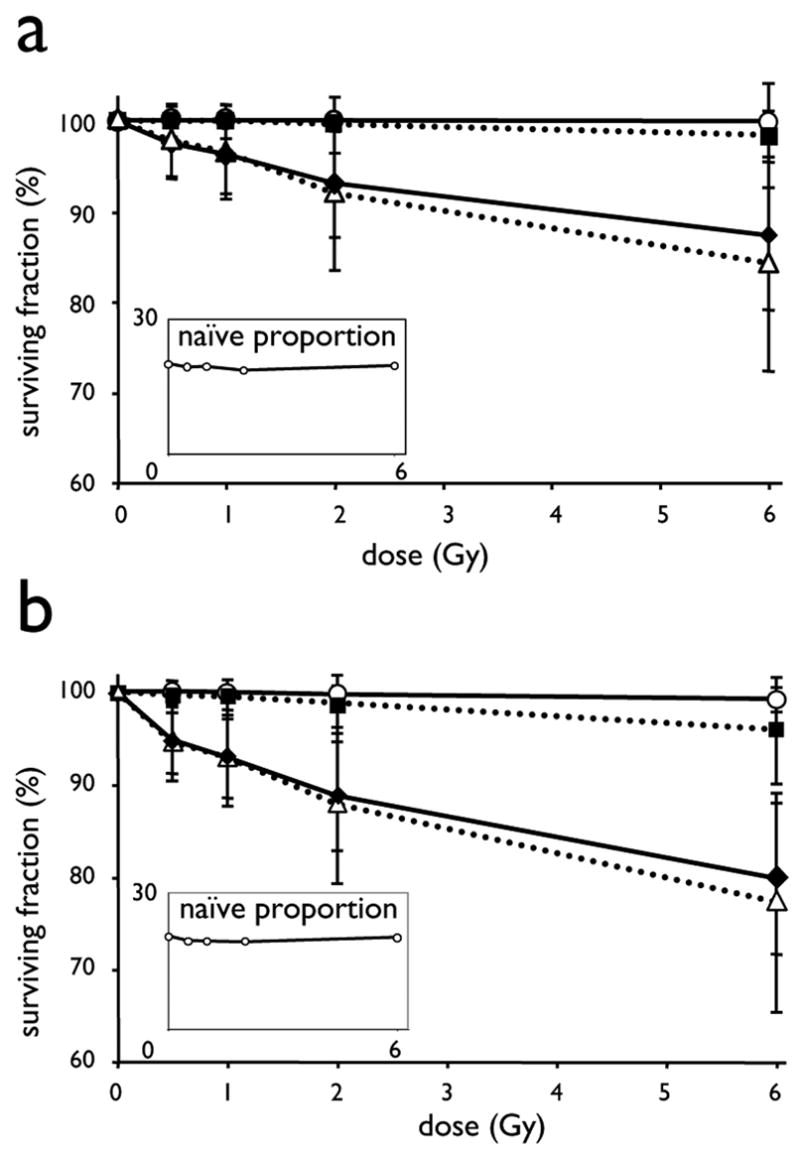
Differential sensitivity to ionizing radiation induced apoptosis in T lymphocyte subpopulations.. Eightteen hours after in vitro irradiation (0–6 Gy of 137Cs-γ) of quiescent PBL from 33 individuals, apoptosis was determined using 8-color flow cytometry. For the indicated T4- (A) and T8 subpopulations (B), the average surviving fractions and standard deviation (SD) are presented as function of dose. The average proportion of naïve T4- and T8 lymphocytes are presented in the insets. Symbols and lines represent: ●----●, naïve; □---□, central memory; ◆-----◆, effector memory; △---△, terminal effector subpopulations, respectively
Average dose survival curves of T lymphocyte subpopulations of a group of 33 individuals, after in vitro irradiation up to 6 Gy are presented in Figure 2. Importantly, CD62L positive subpopulations (Naïve- and CM) of both the T4- and T8 lymphocytes presented very low susceptibility to apoptosis, whereas CD62L negative subpopulations (EM and TE) clearly underwent apoptosis in a very sensitive dose-dependent manner. Naïve lymphocytes in both T4- and T8 compartments were most resistant to radio-induced apoptosis. In the group of 33 samples irradiated at doses up to 6 Gy, less than 1% of the naïve T4- and T8 were AnnexinV positive. This resistance was so high that it precluded reliable analysis of inter-individual variance. Although T4- and T8 CM were on average equally resistant, inter-individual variations were observed and were higher for the T8-CM subpopulation than for the T4-CM subpopulation, as revealed by the difference in the standard deviations of the surviving fraction at 6 Gy of 5.78 and 1.67, respectively.
The T4- as well as T8-TE and -EM subpopulations (CD62L negative) were highly susceptible to radio-induced apoptosis with important inter-individual variation. (Figure 2)
Quantitative analysis of the susceptibility to ionizing-radiation induced apoptosis
Quantitative measurements were obtained for all the 334 individuals on more than 1,000 counted events and a minimum of 150 apoptotic cells on B cells and on overall T4- and T8 lymphocytes, as well as on EM subpopulations. We were unable to meet this criterium for naïve- and CM subpopulations because of their high radioresistance. These subtypes were excluded from further analysis. Although T4-TE and T8-TE clearly underwent IRIA, these populations were also excluded from subsequent statistical analysis because in over 10% of the individuals the number of events was below 1,000.
Correlation of IRIA of different lymphocyte subtypes within individuals
Samples of 30 individuals that were phenotyped twice over the course of the first series of experiments, were used to evaluate the proportion of intra- versus inter-individual variance. In this group, normalization increased the proportion of inter-individual variance (by a factor between 1.2 to 2.5, depending on the cell type), suggesting that normalization was effective in reducing experimental variance. After normalization, the contributions of inter-individual variance to total phenotypic variance for T4, for T4-EM, and for B cell subsets were between 0.64 and 0.69 and highly significant (p<0.0001). For T8 and T8-EM, these values were somewhat lower with values of 0.57 (p = 0.0005) and 0.50 (p=0.002), respectively.
Influence of age and sex
The retained IRIA phenotypes were analyzed for possible correlations with the covariates age and sex and their relevant interactions, as well as for possible effects of experimental variables, such as experiment ID and experiment design (see MM). All significant effects are listed in Table 2. No significant effect of experiment ID or experiment design was detected. The proportion of total phenotypic variance accounted for by the effect of sex and age was higher for T4 and T4-EM than for the other lymphocyte populations. Total heritability of IRIA was estimated after appropriate correction for age and sex, and showed consistent and highly significant in all tested lymphocyte populations. IRIA heritability of T4-EM and T8-EM was higher (0.51 and 0.40; respectively) than that of overall T4 and T8 lymphocytes (0.37 and 0.26; respectively). Total heritability of B lymphocytes IRIA was highest with 0.61 and p<10−13. After correction for the effect of combined covariates, the distribution of the IRIA phenotype of B cells was closer to a normal distribution than that of the T lymphocytes (Table 2).
Table 2. Influence of age and sex on ionizing radiation induced apoptosis.
Sex, age, and the terms for their interactions (age*sex; age2; age2*sex) effects were analyzed using SOLAR. Their effects are reported if significant (p<0.05; n.s.: not significant). The combined effect of significant covariates (var. cov.) is the proportion of total phenotypic variance they account for. Phenotype mean (S.D.=standard deviation) and residual kurtosis are reported after correction for covariates.
| Age Y−1 (p) | sex | age*sex | age2 | var. cov. | mean (S.D.) | res. kurtosis | |
|---|---|---|---|---|---|---|---|
| T4 | −0.016 (<10− 16) | −0,14 (<0.06) | 0.006 (<10− 2) | 0.0003 (<10−4) | .29 | .94 (0.39) | 4.45 |
| T4-EM | −0.006 (<10−4) | −0,18 (<10− 3) | n.s. | n.s | .12 | 1.04 (0.47) | 3.17 |
| T8 | −0.004 (0.03) | −0,14 (0.02) | 0.005 (0.05) | n.s | .01 | 1.04 (0.52) | 3.34 |
| T8-EM | −0.008 (<10−3) | −0,19 (0.01) | 0.006 (0.01) | n.s | .02 | 1.09 (0.56) | 1.72 |
| B | n.s. | 0,15 (<0.07) | n.s. | n.s | .02 | .91 (0.75) | .56 |
Correlation between phenotypes
Correlations exist between B and T4 (r2=0.30, p<10−4) and between B and T8 (r2=0.26, p<10−4) IRIA phenotypes and a strong correlation exists between T4 and T8 IRIA phenotypes (r2=0.59, p<10−4). This high level of correlation is maintained, but not improved, between the T4 and T8 IRIA phenotypes in the EM subpopulations, (r2 0.58, p<10−4).
Considerable variation among individuals in the proportions of lymphocyte compartments were observed, as shown in Table 1, thus, we evaluated the correlation between the proportion of T4-EM and T8-EM lymphocyte subpopulations and their respective IRIA phenotypes. For T8-EM, no significant correlation was found between IRIA and the proportion of T8-EM, as opposed to T4-EM lymphocytes, for which the individuals with a lower proportion of this cell type presented higher susceptibility to IRIA (r2=−0.34; p<10−4), which may suggest a causal relationship.
Familial correlations
Parent-parent and sib-sib correlations are or may be subject to gender differences, with less pronounced effects of age, whereas parent-offspring correlations are subject to both. Therefore, all phenotypic values were adjusted for age and sex effects, prior to the evaluation of intra-familial correlations.. Table 3 shows the parent-offspring, sib-sib, and spouse correlations for all traits. For all reported IRIA phenotypes, the parent-offspring and sib-sib correlations were significant. Parent-offspring correlations are increased for both T4-EM and T8-EM IRIA phenotypes as compared to the IRIA phenotypes of the T4 and T8 parent populations. The T8 and T8-EM familial correlations were lower than the T4 and T4-EM familial correlations. For the B phenotype, the spouse correlation was also significant. During the recruitment of donor samples, spouses tended to be sampled on the same day more frequently than parent-offspring or sib pairs. We tested the spouse correlations in the groups of spouses sampled together (46 pairs) and sampled on separate days (28 pairs). No significant spouse correlation was observed for T lymphocytes IRIA phenotypes in either group. Spouse correlation in the B IRIA phenotype however was high for the group sampled on the same day (r2 =0.41, p=0.005) and did not reach significance for the group sampled on different days. No differences were detected between the two series of experiments, representing different experimental designs.
Table 3. Familial correlations among first-degree relatives.
Familial correlations among pairs of first-degree relatives. Significant correlations with standard errors corrected for non-independence of relative pairs, as calculated using SAGE (FCOR).
| Pair | Parent-offspring (S.D.) | Sibling (S.D.) | Spouse (S.D.) |
|---|---|---|---|
| T4 | .13 (.07) | .33 (.09) | .10 (.11) |
| T8 | .08 (.06) | .08 (.07) | .02 (.11) |
| B | .40 (.06) | .29 (.08) | .32 (.10) |
| T4-EM | .26 (.06) | .21 (.08) | (.12) |
| T8-EM | .16 (.05) | .09 (.07) | .02 (.11) |
In conclusion, heritability may be observed for all the studied IRIA phenotypes, although for T8 and T8-EM, the correlations between first degree relatives were low, and for B cells, the experimental procedure introduced spouse correlation. The T4-EM subset showed correlations most consistent with dominant or additive genetic effects.
Linear regression was used to further characterize the heritability of the T4-EM phenotype. Figure 3 shows the average phenotype of the offspring (mean-sib) plotted against the average phenotype of the two parents (mid-parent). The least squares regression weighted by sib-size, estimates the heritability (h2) of T4-EM at 0.43 (r2 0.25, p<10−4), with no significant intercept (0.005; p=0.82).
Figure 3.
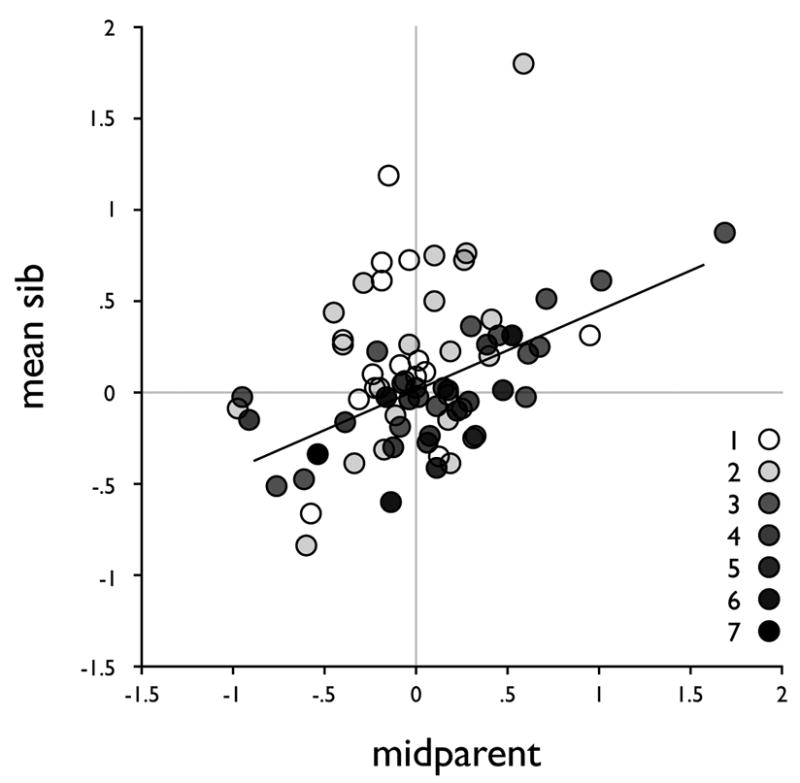
Average of the phenotypes of offspring (mean-sib) versus average phenotype of the two parents (mid-parent) with symbols in grey shade levels according to sibship size (from 1 to 7) and the least square regression fit weighted by sibship size.
Segregation analysis
In order to test whether the data are compatible with a simple familial transmission model, we performed a segregation analysis of the T4-EM trait. We estimated parameters and computed likelihoods under the Mendelian, no-major gene, and general models. The results did not differ whether the data were adjusted for age and sex prior to analysis or whether age and sex were included in the segregation analysis model (not shown). We also found that estimating separate parent-offspring and sib-sib residual correlations did not improve the fit of the model (not shown). Tables 4a and b show the parameters and likelihoods for the age and sex adjusted values. The data do deviate from normality, so we analyzed the data without (Table 4a) and with (Table 4b) power transformation.
Table 4a.
Segregation Analysis without transformation
| Model | qA | Prop AA | Prop AB | Prop BB | μAA | μAB | μBB | σ2 | ρ ss=ρ po | λ 1 | τ 1 | τ2 | τ 3 | −2lnL | Chisq | P | AIC | |
|---|---|---|---|---|---|---|---|---|---|---|---|---|---|---|---|---|---|---|
| 1 | No major gene 1 mean | 1 | 1 | 0 | 0 | 0.017 | - | - | .265 | .21 | 470.35 | 476.35 | ||||||
| 2 | No major gene 2 means | .035 | .0012 | .068 | .930 | 1.11 | 1.11 | −.07 | .16 | .16 | 442.48 | 10.79 | rej | 452.48 | ||||
| 3 | No major gene 3 means | .038 | .0014 | .073 | .924 | 1.86 | 1.07 | −.077 | .16 | .16 | 442.29 | 454.29 | ||||||
| 4 | Mendelian 2 means | .723 | .523 | .399 | .076 | −.07 | −.07 | 1.18 | .16 | .15 | 1 | .5 | 0 | 432.79 | 1.1 | ns | 442.79 | |
| 5 | General 2 means | .028 | .0008 | .054 | .944 | 1.3 | 1.3 | −.054 | .18 | .17 | 1 | .41 | .005 | 431.69 | 443.69 |
Table 4b.
Segregation Analysis with transformation
| Model | qA | Prop AA | Prop AB | Prop BB | μAA | μAB | μBB | σ2 | ρ ss=ρ po | λ 1 | τ 1 | τ2 | τ 3 | −2lnL | Chisq | P | AIC | |
|---|---|---|---|---|---|---|---|---|---|---|---|---|---|---|---|---|---|---|
| 6 | No major gene 1 mean | 1 | 1 | 0 | 0 | −.049 | .236 | .19 | .033 | 436.95 | 446.95 | |||||||
| 7 | No major gene 2 means | .54 | .296 | .496 | .207 | .089 | .089 | −.51 | .14 | .34 | −.49 | 430.1 | 444.1 | |||||
| 8 | No major gene 3 means | .57 | .325 | .490 | .184 | .41 | −.095 | −.57 | .09 | .48 | −.50 | 426.19 | 0.57 | 442.19 | ||||
| 9 | Mendelian 2 means | .03 | .0009 | .059 | .940 | 1.25 | 1.25 | −.07 | .19 | .17 | .56 | 1 | .5 | 0 | 428.42 | 2.81 | ns | 442.42 |
| 10 | Mendelian 3 means | .73 | .531 | .395 | .073 | −.18 | .071 | 1.25 | .15 | .12 | .82 | 1. | .5 | 0 | 428.14 | 2.52 | ns | 444.14 |
| 11 | General 2 means | .11 | .011 | .19 | .79 | −.54 | −.54 | .09 | .13 | .32 | 1 | .081 | .1 | 425.61 | 441.61 | |||
| 12 | General 3 means | .45 | .202 | .495 | .302 | −.545 | −.08 | .44 | .08 | .49 | −48 | .38 | .52 | .39 | 425.62 | 445.62 |
Without data transformation (Table 4a), two means provide the best fit to the data (model 3 vs. model 2). The Mendelian model is consistent with the data (model 4 vs. model 5) and the no major gene transmission model is rejected (model 2 vs. model 5). The best fitting model has two means with higher values being attributed to a recessive gene (model 4). These higher values include approximately 8% of the individuals. In all cases, the residual familial correlation is significant, indicating that additional genes and/or environmental factors are important. When the analysis includes a transformation parameter using the George-Elston approach (Table 4b), both the Mendelian model (model 9 vs. model 11 and model 10 vs. model 12) and the no major gene transmission model (model 8 vs. model 12) are consistent with the data. For the Mendelian model, two means fit the data best (model 9 vs. model 10). In this case, high values are dominant but only 7% of individuals are in this higher distribution (similar to the results of the untransformed data). The residual familial correlation is significant. For the no major gene transmission model, allowing for 3 means improves the fit of the model significantly (model 8 vs. model 7). In this case, the residual familial correlation (s-s, p-o) is higher (0.48) than in the Mendelian model.
Discussion
To measure radiosensitivity phenotypes on lymphocytes, we selected combinations of antibodies that permitted the identification and analysis of apoptosis in phenotypically homogeneous populations of cells, such that quantitative phenotype determinations were no longer masked by the contribution of irrelevant cell populations. We had previously developed a six-color immunophenotyping strategy that enabled quantification of apoptosis in T4, T8, and B cells, and assessed their differential radiosensitivities.
The number of naïve T8-lymphocytes, strongly decreases with age and our data had suggested a confounding effect of differential radiosensitivity of T subpopulations. To verify and account this we developed a panel for phenotyping of IRIA in T subpopulations. Naïve T lymphocytes activation is accompanied by modulation of the expression of different surface molecules. Among these, CD45RA and CD62L were retained and added to the original panel to compose an 8 color panel, that was applied to our family cohort for the direct assay of IRIA susceptibility of B cells and T4- and T8 Naïve, -CM, -EM, and -TE lymphocytes.
The admixture of confounding cell types may still have a minor contribution to some of the measured phenotypes. In particular, although monocytes were excluded through an appropriate scatter gate, only the inclusion of a monocyte-marker such as CD14 would have permitted their unambiguous exclusion. Furthermore, the exclusion of gammadelta T cells would have permitted in a clearer definition of T8 subpopulations in particular.
We confirmed our previous finding that inter-individual differences account for the principal source of variance of the ionizing radiation induced apoptosis phenotypes. The proportion of phenotypic variance related to inter-individual differences was higher for the T4, T4-EM and B lymphocytes than for the T8 and the T8-EM lymphocytes.
Dramatic differences among T lymphocyte subpopulations in sensitivities to ionizing radiation induced apoptosis (IRIA) were found. The CD62L+ populations are resistant to IRIA, whereas the CD62L negative populations are sensitive to IRIA in a dose-dependent way. Resistance to IRIA of both T4 and T8 naïve cells was consistent in all the tested individuals, whereas the equally resistant T4-CM and T8-CM (CD62L+ CD45RA−) showed some variance between individuals. This inter-individual variance could possibly be related to remaining phenotype heterogeneity in this subpopulation with respect to CD27 and CCR7 expression (data not shown). The extreme difference between IRIA susceptibility of CD62L+ and CD62L− may be related to the function of these cell types. As opposed to naïve B lymphocytes, the pool of naïve T lymphocytes is not renewed during an individuals lifespan, and preservation of T lymphocyte repertoire may reflect the balance between DNA repair and apoptosis. As naïve CD62L+ lymphocytes do not proliferate, it may be that apoptosis is postponed upon antigen induced activation. Dedicated studies will be needed to investigate the susceptibility to radiation induced apoptosis of these cells in the context of such activation. These investigations would help explain apparent discrepancies between the higher rate of disappearance of naïve cells after in vivo irradiation in mouse models 14 and our observation of naïve cell resistance to IRIA in vitro.
As a consequence of the decrease of the proportion of naïve T lymphocytes with age, the IRIA phenotype of overall T4 and T8 lymphocytes populations is affected. We observed an effect of age on the IRIA phenotype of EM lymphocytes, indicating that cellular aging processes may also be involved in the evolution of IRIA susceptibility with age 22.
The general objective of the present study was to document the influence of genetic factors on individual susceptibility to radio-inducted apoptosis. In twin studies 23, 24, the determination of heritability of radiosensitivity phenotypes is complicated by the coheritability of numerous other quantitative phenotypes. Hence, interpretation of radiosensitivity is potentially compromised by the similarity in composition of lymphocyte pools between identical twins, given the fact that lymphocyte proportions are genetically determined 25–27.
We measured IRIA phenotypes on a biological resource composed of blood samples of healthy related individuals who were members of large families. Intra-familial correlations between first-degree relatives were evaluated on 199 father-mother-offspring trios from 38 families. This cohort showed consistent correlation between parents and offspring, and among sibs, for apoptosis susceptibility in B cells and T-lymphocyte populations and T-EM subpopulations. Thus, individual susceptibility to apoptosis, observed in all the cell populations undergoing quantifiable apoptosis under the chosen experimental conditions is potentially a quantitative phenotype that is transmitted from parents to offspring.
Although the B lymphocyte IRIA phenotype showed the strongest parent-offspring correlation, a significant spouse correlation raised doubt as to its significance. It turned out that a strong correlation between spouse phenotypes was observed for B IRIA when the spouses donated blood on the same day, with absence of such correlation for couples sampled on separate days. This interference was found for B cells only. Among blood cells, B cells were shown the most sensitive cell type to apoptosis, apparently resulting in additional experimental variance. Therefore, heritability of the IRIA phenotype of B cells has to be confirmed by additional investigations. Among the T IRIA phenotypes, the T8 and T8-EM phenotypes showed less pronounced correlations among first degree relatives than T4 and T4-EM. In accordance with this result, and the results of the inter/intra-individual variance analysis, we hypothesize that, although the IRIA phenotypes of T8 and T8-EM are compatible with consistent heritability, the immunophenotyping panel is less robust for T8 lymphocytes than for the T4 lymphocytes. We expect a beneficial effect of inclusion of anti-TCRgammadelta, CD14, and CD16/56 to increase phenotypic homogeneity of T8 subpopulations.
Through regression analysis and intra-familial correlation investigation we show that the T4-EM phenotype is consistent with dominant or additive genetic effects. Thus, we proceeded to segregation analysis of the T4-EM phenotype. This analysis showed consistency with a Mendelian transmission model involving one major gene along with residual correlation between relatives that could be due to polygenic or environmental effects. When the data were transformed to be consistent with a normal distribution, it was not possible to distinguish models with and without a major gene, but even under the “no transmission” model, residual correlations suggested a significant genetic component. However, the presence of a major gene component is expected to lead to non-normality of the data. Thus, the data are in favor of the existence of a bi-allelic dominant locus, with the heterozygote genotype displaying a phenotype close to that of the more frequent homozygote genotype (allelic frequencies of approximately 0.75 and 0.25 and additional genes or environmental factors that account for the residual familial correlations
This gene or genes may be specifically modulating the susceptibility to apoptosis of this lymphocyte population. Since the T4 and T8 phenotypes are correlated, this implies genetic factors shared among T lymphocyte subsets. Furthermore, since individuals with a lower proportion of T4-EM lymphocytes presented higher susceptibility to IRIA, this genetic factor might also be involved in homeostasis of T4 lymphocyte subpopulations.
Apoptosis is the principal mechanism of cell death in lymphocytes, and therefore the major instrument shaping the immune system. Several genetic conditions predisposing to cancer are associated with defects in apoptosis pathways. Further family-based studies of apoptosis susceptibility could be used to map the genes involved, and aid in determining their role in complex phenotypes, such as clinical radiosensitivity, immune system development, and cancer predisposition.
Acknowledgments
We respectfully thank Jean Dausset for support of this project and for helping us in re-activating the “Dausset families”. We warmly thank all the donors, for their generous and trusting collaboration. We thank Caroline Schmitz, Anna Richot and Clement Hoffmann for their invaluable contribution in the recruitment of the cohort of volunteers and the management of the data. Thanks to the CRB-CEPH for processing the blood samples, and to Mario Roederer for his help in defining robust antibody panels, and for his support to the project.
Funding: This work was supported by “ATC Cohortes et Collections” of Inserm, by EDF, and by EC-Euratom grants FIS5-2002-00080-RaHGE and FIS5-2002-0039-GENEPI.
Footnotes
Conflict of interest: none
Publisher's Disclaimer: This is a PDF file of an unedited manuscript that has been accepted for publication. As a service to our customers we are providing this early version of the manuscript. The manuscript will undergo copyediting, typesetting, and review of the resulting proof before it is published in its final citable form. Please note that during the production process errors may be discovered which could affect the content, and all legal disclaimers that apply to the journal pertain.
References
- 1.Parshad R, Sanford KK. Radiation-induced chromatid breaks and deficient DNA repair in cancer predisposition. Crit Rev Oncol Hematol. 2001;37:87–96. doi: 10.1016/s1040-8428(00)00111-6. [DOI] [PubMed] [Google Scholar]
- 2.German J, Ellis NA. Bloom syndrome. In: Vogelstein B, Kinzler KW, editors. The genetic basis of human cancer. New York: McGraw-Hill; 2002. pp. 267–288. [Google Scholar]
- 3.Varga D, Hoegel J, Maier C, et al. On the difference of micronucleus frequencies in peripheral blood lymphocytes between breast cancer patients and controls. Mutagenesis. 2006;21:313–320. doi: 10.1093/mutage/gel035. [DOI] [PubMed] [Google Scholar]
- 4.Roberts SA, Spreadborough AR, Bulman B, et al. Heritability of cellular radiosensitivity: a marker of low-penetrance predisposition genes in breast cancer? Am J Hum Genet. 1999;65:784–794. doi: 10.1086/302544. [DOI] [PMC free article] [PubMed] [Google Scholar]
- 5.Curwen GB, Winther JF, Tawn EJ, et al. G(2) chromosomal radiosensitivity in Danish survivors of childhood and adolescent cancer and their offspring. Br J Cancer. 2005;93:1038–1045. doi: 10.1038/sj.bjc.6602807. [DOI] [PMC free article] [PubMed] [Google Scholar]
- 6.Mori N, Matsumoto Y, Okumoto M, et al. Variations in Prkdc encoding the catalytic subunit of DNA-dependent protein kinase (DNA-PKcs) and susceptibility to radiation-induced apoptosis and lymphomagenesis. Oncogene. 2001;20:3609–3619. doi: 10.1038/sj.onc.1204497. [DOI] [PubMed] [Google Scholar]
- 7.Fairbairn DW, Olive PL, O’Neill KL. The comet assay: a comprehensive review. Mutat Res. 1995;339:37–59. doi: 10.1016/0165-1110(94)00013-3. [DOI] [PubMed] [Google Scholar]
- 8.Heatwole VM. TUNEL assay for apoptotic cells. Methods Mol Biol. 1999;115:141–148. doi: 10.1385/1-59259-213-9:141. [DOI] [PubMed] [Google Scholar]
- 9.Muller WU, Nusse M, Miller BM, et al. Micronuclei: a biological indicator of radiation damage. Mutat Res. 1996;366:163–169. doi: 10.1016/s0165-1110(96)90037-8. [DOI] [PubMed] [Google Scholar]
- 10.Plan Y, Hlatky L, Hahnfeldt P, et al. Full-color painting reveals an excess of radiation-induced dicentrics involving homologous chromosomes. Int J Radiat Biol. 2005;81:613–620. doi: 10.1080/09553000500331881. [DOI] [PubMed] [Google Scholar]
- 11.Schmitz A, Bayer J, Dechamps N, et al. Intrinsic susceptibility to radiation-induced apoptosis of human lymphocyte subpopulations. Int J Radiat Oncol Biol Phys. 2003;57:769–778. doi: 10.1016/s0360-3016(03)00637-0. [DOI] [PubMed] [Google Scholar]
- 12.Ozsahin M, Ozsahin H, Shi Y, et al. Rapid assay of intrinsic radiosensitivity based on apoptosis in human CD4 and CD8 T-lymphocytes. Int J Radiat Oncol Biol Phys. 1997;38:429–440. doi: 10.1016/s0360-3016(97)00038-2. [DOI] [PubMed] [Google Scholar]
- 13.Ozsahin M, Crompton NE, Gourgou S, et al. CD4 and CD8 T-lymphocyte apoptosis can predict radiation-induced late toxicity: a prospective study in 399 patients. Clin Cancer Res. 2005;11:7426–7433. doi: 10.1158/1078-0432.CCR-04-2634. [DOI] [PubMed] [Google Scholar]
- 14.Grayson JM, Harrington LE, Lanier JG, et al. Differential sensitivity of naive and memory CD8+ T cells to apoptosis in vivo. J Immunol. 2002;169:3760–3770. doi: 10.4049/jimmunol.169.7.3760. [DOI] [PubMed] [Google Scholar]
- 15.Gupta S, Su H, Bi R, et al. Life and death of lymphocytes: a role in immunesenescence. Immun Ageing. 2005;2:12. doi: 10.1186/1742-4933-2-12. [DOI] [PMC free article] [PubMed] [Google Scholar]
- 16.Bonney GE. On the statistical determination of major gene mechanisms in continuous human traits: regressive models. Am J Med Genet. 1984;18:731–749. doi: 10.1002/ajmg.1320180420. [DOI] [PubMed] [Google Scholar]
- 17.Bonney GE. Regressive Models. In: Elston RC, Olson JM, Palmer L, editors. Biostatistical Genetics and Genetic Epidemiology. Vol. 5. John Wiley & Sons Ltd; 1998. pp. 3755–3762. [Google Scholar]
- 18.George VT, Elston RC. Generalized modulus power transformation. Commun Stat Theory Methods. 1988;17:2933–2952. [Google Scholar]
- 19.Demenais FM, Elston RC. A general transmission probability model for pedigree data. Hum Hered. 1981;31:93–99. doi: 10.1159/000153185. [DOI] [PubMed] [Google Scholar]
- 20.Mathias RA, Wilson AF, Beaty TH, et al. Model comparison and the likelihood ratio test in segregation analysis. Genet Epidemiol. 2003;25:382–383. doi: 10.1002/gepi.10273. [DOI] [PubMed] [Google Scholar]
- 21.Sallusto F, Lenig D, Forster R, et al. Two subsets of memory T lymphocytes with distinct homing potentials and effector functions. Nature. 1999;401:708–712. doi: 10.1038/44385. [DOI] [PubMed] [Google Scholar]
- 22.Scarpaci S, Frasca D, Barattini P, et al. DNA damage recognition and repair capacities in human naive and memory T cells from peripheral blood of young and elderly subjects. Mech Ageing Dev. 2003;124:517–524. doi: 10.1016/s0047-6374(03)00030-7. [DOI] [PubMed] [Google Scholar]
- 23.Camplejohn RS, Hodgson S, Carter N, et al. Heritability of DNA-damage-induced apoptosis and its relationship with age in lymphocytes from female twins. Br J Cancer. 2006;95:520–524. doi: 10.1038/sj.bjc.6603257. [DOI] [PMC free article] [PubMed] [Google Scholar]
- 24.Wu X, Spitz MR, Amos CI, et al. Mutagen sensitivity has high heritability: evidence from a twin study. Cancer Res. 2006;66:5993–5996. doi: 10.1158/0008-5472.CAN-06-1007. [DOI] [PubMed] [Google Scholar]
- 25.Amadori A, Zamarchi R, De Silvestro G, et al. Genetic control of the CD4/CD8 T-cell ratio in humans. Nat Med. 1995;1:1279–1283. doi: 10.1038/nm1295-1279. [DOI] [PubMed] [Google Scholar]
- 26.Hall MA, Ahmadi KR, Norman P, et al. Genetic influence on peripheral blood T lymphocyte levels. Genes Immun. 2000;1:423–427. doi: 10.1038/sj.gene.6363702. [DOI] [PubMed] [Google Scholar]
- 27.Hall MA, Norman PJ, Thiel B, et al. Quantitative trait loci on chromosomes 1, 2, 3, 4, 8, 9, 11, 12, and 18 control variation in levels of T and B lymphocyte subpopulations. Am J Hum Genet. 2002;70:1172–1182. doi: 10.1086/340090. [DOI] [PMC free article] [PubMed] [Google Scholar]