Abstract
The acoustic fields of a high intensity focused ultrasound (HIFU) transducer operating either at its fundamental (1.1 MHz) or third harmonic (3.3 MHz) frequency were measured by a fiber optic probe hydrophone (FOPH). At 1.1 MHz when the electric power applied to the transducer was increased from 1.6 to 125 W, the peak positive/negative pressures at the focus were measured to be p+=1.7–23.3 MPa and p−=−1.2–−10.0 MPa. The corresponding spatial-peak pulse-average (ISPPA) and spatial-average pulse-average (ISAPA) intensities were ISPPA=77–6000 W/cm2 and ISAPA=35–4365 W/cm2. Nonlinear propagation with harmonics generation was dominant at high intensities, leading to a reduced −6 dB beam size (L×W) of the compressional wave (11.5×1.8–8.8×1.04 mm) but an increased beam size of the rarefactional wave (12.5×1.6–13.2×2.0 mm). Enhancement ratio of absorbed power density in water increased from 1.0 to 3.0. In comparison, the HIFU transducer working at 3.3 MHz produced higher peak pressures (p+=3.0–35.1 MPa and p−=−2.5–−13.8 MPa) with smaller beam size (0.5×4 mm). Overall, FOPH was found to be a convenient and reliable tool for HIFU exposimetry measurement.
I. INTRODUCTION
In recent years, high intensity focused ultrasound (HIFU) has been used increasingly as a new and effective treatment modality for cancer therapy.1–4 By focusing acoustic energy into a small cigar-shaped volume, HIFU (ISPTA > 1000 W/cm2) can produce thermal ablation (temperature >65 °C) and tissue necrosis (i.e., a lesion) in a well-defined volume in the target tumor.5 Treatment of the whole tumor is accomplished by scanning the HIFU beam line-by-line and layer-by-layer under the guidance of B-mode ultrasound or MRI imaging. For safe and effective HIFU treatment in the clinic, it is critical to predict and control the lesion size produced.6 Towards this goal, a fundamental knowledge of the acoustic field and acoustic energy output of the HIFU system is essential and needs to be accurately determined.
Several techniques have been developed to measure the acoustic output of HIFU transducers. For example, calorimetry7 and radiation force measurements8 have been used to determine the total acoustic power produced by a HIFU transducer, from which the total energy flux through the beam cross-sectional area (or intensity) can be estimated. Although convenient to use, these techniques cannot resolve the pressure variation and distribution within the focal volume. Currently, polyvinylidene fluoride (PVDF) membrane or needle hydrophones (with a sensing element of 0.5–1.0 mm) are often used for mapping the acoustic field of a HIFU transducer. However, to avoid cavitation damage to the hydrophone, measurements were typically carried out first at a low output level, and then the pressure amplitudes and distribution at high output levels were extrapolated based on linear propagation model.9,10 Since wave form distortion due to nonlinear propagation and cavitation produced at high output levels will significantly alter the size and shape of the lesion formed,6,11–14 the extrapolation method may not provide accurate and satisfactory results. Moreover, once cavitation damage is produced on the surface of the sensing element of the hydrophone, the probe must be repaired and recalibrated before further use. Alternatively, optical methods based on Schlieren imaging15 and optical diffraction tomography16 have been used to quantify the pressure field of ultrasound transducers. Yet, the applicability of these optical methods is also limited to conditions under low-pressure amplitudes associated with linear wave propagation. Altogether, current methods used for HIFU exposimetry measurement are either limited by their spatial or temporal resolutions or unreliability in determining the HIFU field at clinically relevant high intensity output levels.
In this work, a self-calibrated fiber optic probe hydrophone (FOPH)17 was used for HIFU exposimetry measurement. FOPH was originally developed for measurement of shock waves of high pressure amplitude with short risetime in a lithotripter field.17 Because of its small probe size (0.1 mm sensing element), broad bandwidth (50 MHz), improved robustness in high tensile pressure field, and longevity (a probe tip can be easily prepared after cavitation damage), it may provide a reliable and accurate means for HIFU exposimetry measurement. Using a FOPH, we have measured the pressure wave forms produced in the focal volume of a focused HIFU transducer operating at either its fundamental (1.1 MHz) or third harmonic (3.3 MHz) frequency. It was found that pressure wave form distortion appeared at moderate output levels and grew significantly at high output levels of the HIFU transducer. Based on the pressure wave forms measured, the beam size, intensity, and acoustic power of the HIFU transducer were calculated and the primary features of nonlinear propagation and associated energy absorption enhancement were quantified.
II. MATERIALS AND METHODS
A. Fiber optic probe hydrophone (FOPH) and PVDF membrane hydrophone
In this study, a fiber optic probe hydrophone (FOPH-500, RP Acoustics, Leutenbach, Germany) was used for HIFU field measurement. The working principle of FOPH has been described previously.17 Briefly, the FOPH-500 employs a pigtailed laser diode (λ=810 nm) that is connected to one leg of a 1× 2 fiber coupler. The light reflection at a 100 μm fiber/water interface is measured by a fast photodetector with an integrated amplifier of 30 MHz bandwidth, connected to the other leg of the coupler. Conversion of the reflected light intensity to pressure can be carried out off-line using a calibration program based on the Fresnel formula for the pressure-dependent refractive index at the fiber tip/water interface. With deconvolution process, the bandwidth of the FOPH can be enhanced to 50 MHz without loss in the signal-to-noise ratio (SNR) and the sensitivity of hydrophone is about 2 mV/MPa based on the specification of the manufacturer. The measurements of the FOPH was first compared with a recently calibrated PVDF membrane hydrophone (GEC-Marconi Research Center, Essex, UK) with an active element of 0.5 mm diameter, operated in combination with a matched amplifier, yielding a sensitivity of 41 mV/MPa at 1 MHz.
B. HIFU transducer and pressure measurement protocol
An annular focused HIFU transducer (H-102, Outer Diameter=69.94 mm, Inner Diameter=22.0 mm, F=62.64 mm, Sonic Concepts, Woodinville, WA) was used in this study (Fig. 1). The HIFU transducer, mounted at the bottom of a Lucite tank (L×W×H=40.5×30.5×15 cm) filled with degassed and deinoized water (O2<4 mg/L, T ≈ 25 °C), was driven by sinusoidal bursts produced by a function generator (33120A, Agilent, Palo Alto, CA) together with a 55 dB power amplifier (A150, ENI, Rochester, NY). A 50 Ω attenuator (up to 22.1 dB attenuation, Kay Elemetrics Corp., Lincoln Park, NJ) could be inserted between the function generator and the power amplifier to further reduce the electric power input to the HIFU transducer. The HIFU transducer was running either at its fundamental (1.1 MHz) or third harmonic (3.3 MHz) frequency. To map the acoustic field of the HIFU transducer, the FOPH probe was connected to a three-dimensional positioning system (step motors: VXM-2, lead screws: BiSlide-M02, Velmex, Bloomfield, NY), which has a minimum step size of 5 μm and a maximum scan range of 250 mm. The output of the FOPH was first recorded by a digital oscilloscope (LeCroy 9310A, Chestnut Ridge, NY) operated at 100 MHz sampling rate, and then transferred to a PC for off-line pressure conversion and analysis. To streamline the experiment, a Visual Basic program was written and used to control automatically the output of the function generator, data acquisition and transfer, and scanning of the FOPH probe via GPIB bus and RS-232 port, respectively.
FIG. 1.
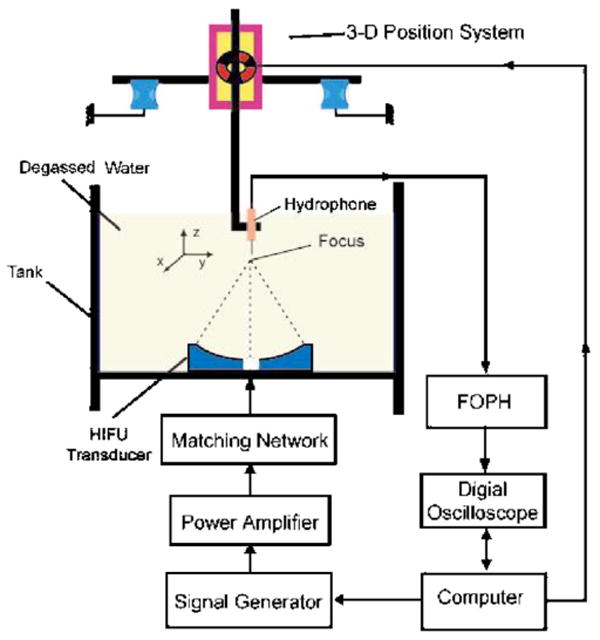
(Color online) A schematic diagram of the experimental setup for HIFU exposimetry measurement using a computer controlled three-dimensional pressure mapping system.
To minimize temperature increase and cavitation activity near the probe tip, the HIFU transducer was operated in burst mode with a duty cycle of 0.1 %–0.2 % (i.e., 10–20 cycles/burst), and the peak-to-peak output voltage from the function generator, Vpp, was set to be less than 0.5 V. Above this output level, cavitation was frequently induced at the probe tip, leading to wave form contamination and probe damage. Averaging over 300 bursts was used to improve the SNR of the measured pressure wave forms. The geometric focus of the HIFU transducer was determined by searching for the location of maximum signal strength at a low output level with a burst delay time of ∼41.76 μs, which is the time needed for a linear acoustic wave to propagate from the surface to the focus of the HIFU transducer. At the low output level the geometric focus was assumed to coincide with the acoustical focus of the HIFU transducer. An x-y-z coordinate system was then established with its origin coinciding with the geometric focus of the transducer and the z axis along the transducer axis (Fig. 1). Acoustic field characterization of the HIFU transducer was carried out by line or area scan. For line scan, the pressure distributions transverse to and along the transducer axis within the range of x=−3−3 mm and z=−50−50 mm were measured at a step size of Δx=0.12 mm and Δz=0.5 mm, respectively. For area scan, the pressure distributions in the x-y or x-z plane (x=−2−2 mm, y=−2−2 mm, z=−10−10 mm, Δx=Δy =0.1 mm, Δz=1 mm) were recorded.
C. Data analysis
Following the measurements, the peak positive/negative (compressional/rarefactional) pressure distributions were plotted, respectively, from which the −6 dB beam size and main lobe size were calculated. Spectrum analysis was performed by using fast Fourier transform (FFT) with minimal spectrum leakage techniques. First, the recorded full amplitude wave form was truncated to an integer number of cycles with zero-crossing points on both ends. Second, the truncated wave form was replicated to about 4000 sampling points. Third, Fourier transformation was performed on the stretched wave form to determine its fundamental frequency and harmonics. The spectrum could be further normalized by the total energy of the wave form. In addition, the spectra of the compressional and rarefactional components of the wave form were analyzed individually to evaluate their different nonlinear propagation characteristics.18
Based on the pressure wave-form data, the spatial-peak pulse-average intensity (ISPPA), typically at the focus of the HIFU transducer, can be calculated by
| (1) |
where ρ0 is the ambient density of water, c0 is the small-signal sound speed in water, p(t) is the time varying pressure wave form, T is the period of the wave form, n is the integer number of cycles in the selected pressure wave form, t0 is the retarded time for the first full amplitude period, and t is time.19 In addition, the spatial-average pulse-average intensity (ISAPA) can be calculated as
| (2) |
where S is the integration area, which is usually the −6 dB beam area in the focal plane. Here the ISPPA as defined in Eq. (1) is used in a broad sense to indicate pulse-average intensity at the measurement point.
The electrical input power to the HIFU transducer (Pin) was determined by Pin=V2rms cos ϑ/|Z|, where Vrms is the rms voltage applied to the HIFU transducer, |Z| is the magnitude and ϑ is the phase angle of the impedance Z. According to the specifications from the manufacturer, the impedance parameters of the HIFU transducer at 1.1 and 3.3 MHz with the 50 Ω matching unit are |Z|=62.5 Ω, 43.9 Ω, and ϑ=0.334°, 0.925°, respectively. The acoustic power of the HIFU transducer (P) was estimated by integrating ISPPA through a large area including the main and side lobes of the HIFU transducer. Subsequently the energy conversion efficiency of the HIFU transducer was determined by P/Pin.
D. Power absorption
In the focal region of a HIFU transducer, significant nonlinear propagation will cause the acoustic energy to shift from the fundamental frequency to higher harmonics, each of which has a different focal geometry and absorption property. As shown previously by Clarke and ter Haar12 the absorbed acoustic power density A(P) can be calculated from spectra data by
| (3) |
where In(P) is the acoustic intensity of nth harmonic at acoustic power P, α(fn) =2.5×10⁻⁴ f2nNp/cm/MHz is the absorption coefficient at the harmonic frequency fn in water. Here only six harmonics are included because of their satisfactory SNRs. The initial lesion formation in a HIFU field is believed to occur at the point where the absorbed power density reaches a maximum.9
When the output of the HIFU transducer increases, the rate of harmonics generation and acoustic to thermal energy conversion will also change nonlinearly. The enhancement ratio for the absorbed acoustic power per unit volume, EA(P), can be determined using the following equation:
| (4) |
where Pref is the lowest power of the HIFU transducer (i.e., in this study the output voltage of the function generator was 0.05 V with additional 22.1 dB attenuation at 1.1 MHz) in the range of linear acoustics.5
III. RESULTS
A. Comparison of FOPH and PVDF membrane hydrophone
The acoustic pressures produced by the 1.1 MHz HIFU transducer in the linear range measured by the FOPH and the PVDF membrane hydrophone, respectively, were compared in Fig. 2. At low output level the noise in the FOPH measured wave form was significant even after signal averaging, especially at the wave crest and trough. Overall, however, the wave-form profiles measured by these two different hydrophones were symmetric and similar to each other. It was noticed that in the linear range the measured peak-to-peak pressure by the FOPH was usually higher than that of the PVDF membrane hydrophone and this difference was proportional to the output voltage of the HIFU transducer.
FIG. 2.
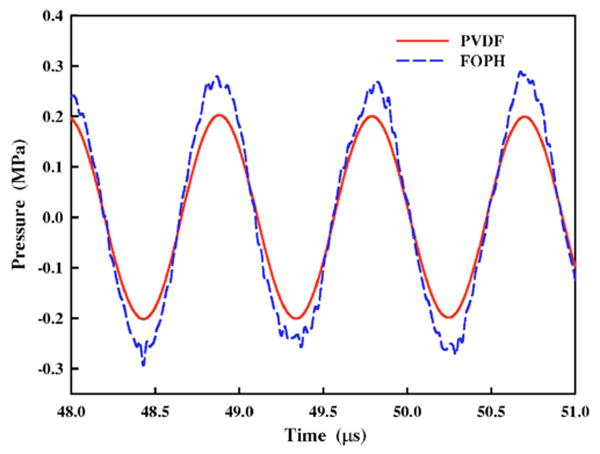
(Color online) Comparison of the measured pressure wave forms by the FOPH and the PVDF membrane hydrophone in the 1.1 MHz HIFU field produced at a peak-to-peak output voltage of 50 mV with 15 dB insert attenuation.
When converting the electric signal to the corresponding acoustic pressure measured by a PVDF membrane hydrophone, the sensitivity at the fundamental frequency of the measured pulse is often used. At high output levels shift of the acoustic energy from the fundamental frequency to its harmonics due to nonlinear propagation is significant. The sensitivity of the PVDF membrane hydrophone used in this study decreases by about 20% from 1 MHz to 20 MHz. Hence, the use of the full calibration chart in the frequency range (deconvolution of the frequency response of the hydrophone) may lead to more accurate conversion of the pressure wave form. For example, at Vpp=0.5 V the deconvoluted wave form produced by the 3.3 MHz HIFU transducer had a 5% higher peak positive pressure than the corresponding value calculated using only the sensitivity at the fundamental frequency [Fig. 3(a)].
FIG. 3.
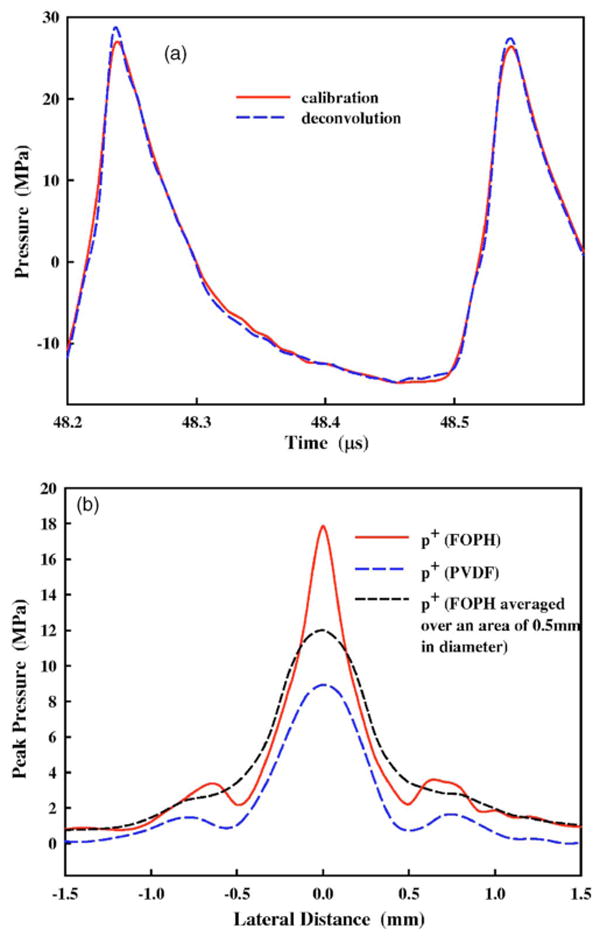
(Color online) (a) The effect of deconvolution on the conversion of electric signal to pressure wave form measured by the PVDF membrane hydrophone at the focus of a 3.3 MHz HIFU transducer with Vpp=0.5 V. (b) Comparison of the pressure distribution measured by the FOPH (solid line) and the PVDF membrane hydrophone (long dashed line) in the focal plane of the 3.3 MHz HIFU transducer with Vpp=0.2 V. Furthermore, the pressure distribution measured by the FOPH was averaged through an area of 0.5 mm in diameter (short dashed line). Vpp: peak-to-peak output voltage of the function generator.
Figure 3(b) compares the lateral pressure distributions of the 3.3 MHz HIFU transducer at Vpp=0.2 V, measured by using the FOPH (solid line) and the PVDF membrane (long dashed line) hydrophone, respectively. The FOPH measurements revealed much higher peak pressure at the focus (17.9 MPa) and smaller −6 dB beam width (0.37 mm), compared to the corresponding values measured by the PVDF membrane hydrophone (8.9 MPa and 0.48 mm). It is interesting to note that if the FOPH measured pressure distribution was averaged through an area of 0.5 mm in diameter (representing the sensor size of the PVDF membrane hydrophone), the final results would change significantly [short dashed line in Fig. 3(b)]. The pressure distribution looks similar to that of the PVDF membrane hydrophone with the peak pressure decreasing to 12 MPa and the −6 dB beam width increasing to 0.63 mm. According to the International Electrotechnical Commission standards (IEC 61102), the maximum hydrophone size for measuring this 3.3 MHz HIFU field should be less than 0.27 mm in order to avoid the spatial averaging effect imposed by the size of the sensor.20
B. Nonlinear effects in HIFU field
The pressure wave forms produced by the 1.1 MHz HIFU transducer were measured in the range of Vpp=0.05–0.5 V (Fig. 4). Combined with the 55 dB power amplifier, the corresponding electrical input power into the transducer was calculated to be 1.6–125 W (Table I). The pressure wave forms measured by the FOPH are consistent and reproducible. Over a 2-month period, the variations in peak positive (p+) and negative (p−) pressures from six experiments were found to be within 5% except at the lowest output level (∼10%) that may be caused partially by a possible longtime baseline variation of the oscilloscope or the laser intensity of the FOPH (∼0.1 MPa at Vpp=50 mV), a system error that cannot be reduced by signal averaging. The acoustic intensities and acoustic powers were calculated based on the measured pressure wave forms (Table I). Within this output range ISPPA and ISAPA were found to increase from 77 to 6000 W/cm2 and from 37 to 4365 W/cm2, respectively. When the acoustic power was increased from 1.1 to 81.6 W, the corresponding power conversion efficiency was found to vary in the range of 62%–73%, which is close to the value specified by the manufacturer based on radiation force measurements.
FIG. 4.
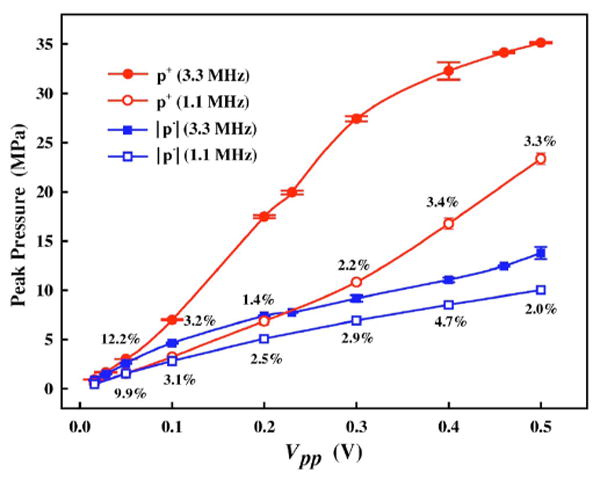
(Color online) The electric input dependency of peak positive (p+) and negative (p−) pressure at the focus of the HIFU transducer working at either 1.1 or 3.3 MHz. Vpp is the peak-to-peak output voltage of the function generator. The percentage of standard deviation over mean value is listed in the plot for the 1.1 MHz HIFU transducer. Results were calculated from six experiments performed in a 2-month period.
TABLE I.
Acoustic intensity, power output, and electric-to-acoustic energy conversion efficiency of the 1.1 MHz HIFU transducer.
| Output Vpp (V) | ISPPA (W/cm2) | ISAPA (W/cm2) | ISAPA/ISPPA | Pin (W) | P (W) | P/Pin |
|---|---|---|---|---|---|---|
| 0.05 | 77.4 | 36.5 | 0.47 | 1.56 | 1.14 | 72.7% |
| 0.1 | 281 | 146 | 0.52 | 6.36 | 3.95 | 62.1% |
| 0.2 | 1082 | 605 | 0.56 | 23.5 | 15.0 | 63.0% |
| 0.3 | 2458 | 1426 | 0.58 | 51.5 | 33.1 | 64.3% |
| 0.4 | 4433 | 2657 | 0.60 | 86.2 | 59.6 | 69.2% |
| 0.5 | 5996 | 4365 | 0.73 | 125 | 81.6 | 65.6% |
At the geometric focus, wave-form distortion from sinusoidal to “sawtooth” shape due to nonlinear propagation21 was observed as the output of the transducer was increased [Fig. 5(a)]. The nonlinear effects in the HIFU field led to significantly different electric input-dependent relationship of p+ and p−. Within the range of Vpp=0.05–0.5 V, p− increased almost linearly from −1.2 to −10.0 MPa while p+ rose much more rapidly from 1.7 to 23.3 MPa (Fig. 4). The nonlinear propagation was also manifested by harmonics generation in the wave forms [Fig. 5(b)]. At low output level (Vpp =0.05 V), the fundamental frequency was found to account for about 85% in the normalized spectrum while the second harmonic was less than 5% [solid line in Fig. 5(b)]. Hence, most acoustic energy was stored in the fundamental frequency. In contrast, at high output level (0.5 V), the fundamental frequency decreased to 46% while the second harmonic increased to 19%, and higher (third and fourth) harmonics became significant [dashed line in Fig. 5(b)]. Therefore, substantial portion of the wave form energy was shifted from the fundamental frequency into higher harmonics. Furthermore, the intensities of all harmonics were found to increase linearly with the acoustic intensity, ISPPA, [inset in Fig. 5(b)] and the calculated slopes (Table II) were found to be similar to the results of previous studies.12,18 Furthermore, the nonlinearity has different influence on compressional and rarefactional waves. The fundamental frequency of the compressional wave was found to shift upwards from 1.1 MHz while that of the rarefactional wave shifted downwards. At higher output the rate of harmonics generation for the compressional components increased much faster than that of the rarefactional components (Table II). As a result, these changes lead to the asymmetric distortion of the wave form [Fig. 5(a)].
FIG. 5.
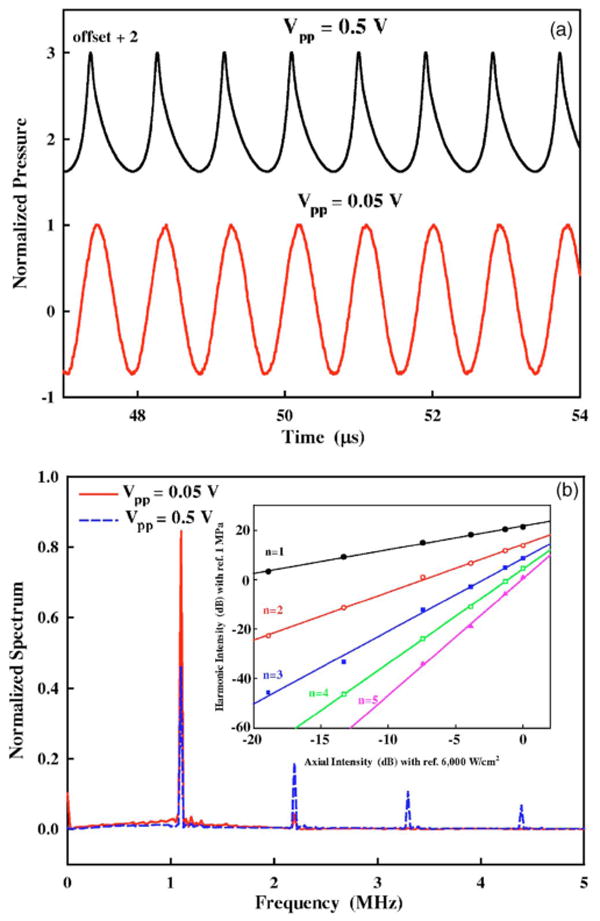
(Color online) (a) Normalized pressure wave forms measured by the FOPH at the focus of the 1.1 MHz HIFU transducer when the peak-to-peak output voltage (Vpp) of the function generator was set at 0.05 and 0.5 V, respectively, and (b) the corresponding normalized spectra and harmonic intensities of the pressure wave forms and the electric input dependency of harmonic generation (inset) with respect to the referenced pressure of 1 MPa.
TABLE II.
Slopes of harmonic intensity vs axial intensity for different harmonic components.
| 1.1 MHz
|
3.3 MHz
|
|||||
|---|---|---|---|---|---|---|
| n | Whole | Compressional | Rarefactional | Whole | Compressional | Rarefactional |
| 1 | 0.96 | 1.16 | 0.81 | 0.95 | 1.07 | 0.88 |
| 2 | 1.93 | 2.41 | 1.56 | 1.91 | 2.20 | 1.42 |
| 3 | 2.94 | N/A | 1.63 | 2.69 | N/A | 1.55 |
| 4 | 3.81 | 3.44 | 1.85 | 3.58 | 2.70 | 1.83 |
| 5 | 4.71 | 4.11 | 2.08 | 4.47 | 4.10 | 2.14 |
The pressure distributions along the transverse (x) and axial (z) direction of the 1.1 MHz HIFU transducer are shown in Fig. 6, which were found to be fairly symmetric in the focal plane. Although the peak pressures increased with the output power, the size of the main lobe remained almost unchanged, i.e., L×W=20.5×2.7 mm. At the highest output level (Vpp=0.5 V), the maximum p+ was measured at a position slightly (∼0.5 mm) beyond the geometric focus of the transducer, while the maximum p− was found to shift ∼2.5 mm proximal to the transducer. Similar phenomenon has been observed in a lithotripter field, which is attributed to nonlinear propagation of the shock wave.22 The corresponding −6 dB beam sizes both in the focal plane and along the central axis of the 1.1 MHz HIFU transducer were calculated (Fig. 7). Because of the strong nonlinear propagation and the associated harmonics generation, the −6 dB beam size of p+ was found to decrease significantly with output power. In contrast, the −6 dB beam size of p− was found to increase slightly, presumably because of the downwards shift of the fundamental frequency of the rarefactional wave at higher output levels.
FIG. 6.
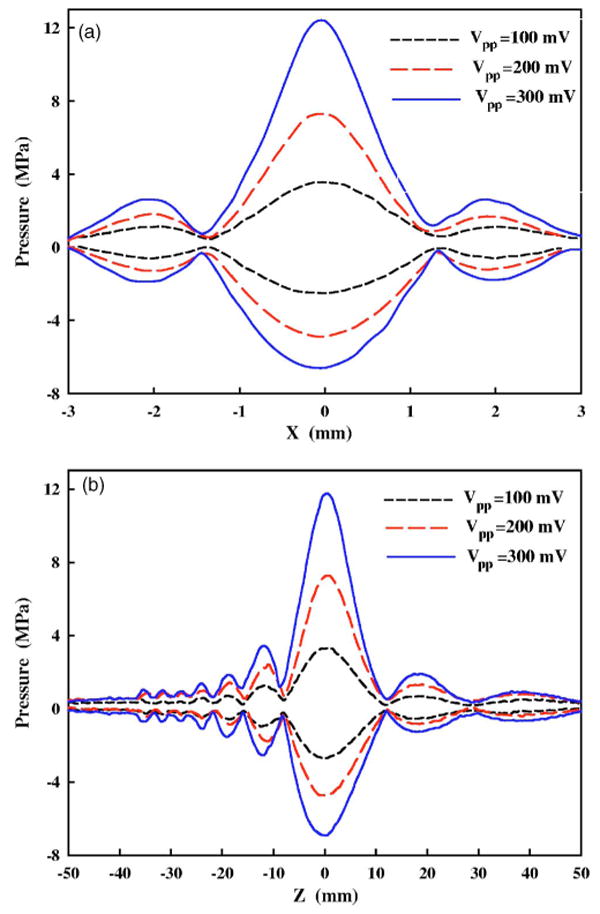
(Color online) Pressure distribution (a) transverse to and (b) along the 1.1 MHz HIFU transducer axis at the peak-to-peak output voltage of the function generator Vpp=0.1, 0.2, and 0.3 V.
FIG. 7.
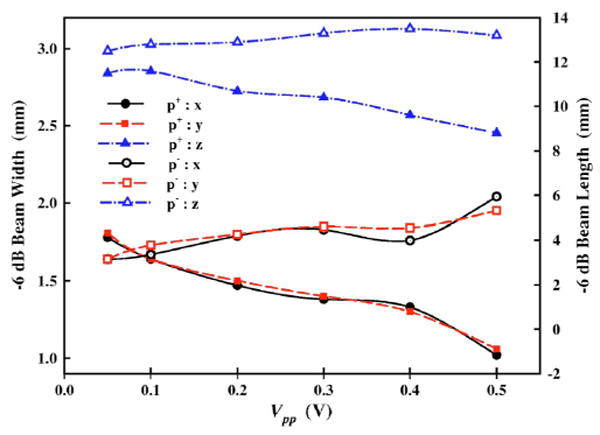
(Color online) The −6 dB beam size of the peak positive (p+) and negative (p−) pressure distribution around the focus of the 1.1 MHz HIFU transducer at different peak-to-peak output voltage of the function generator Vpp.
The distribution of normalized harmonic spectra and absolute harmonic intensities along the x and z axis at Vpp=0.1 V and 0.3 V are shown in Fig. 8. At the focus of the HIFU transducer, a significant portion of the wave energy shifted from the fundamental frequency to higher order harmonics. Therefore, the focal point becomes a local minimum for the normalized fundamental component but a maximum for harmonic components at Vpp=0.1 V. In particular, the harmonic generation is more apparent at high output level (0.3 V). In addition, along the x and z axis, the maxima and minima of the fundamental component correspond to the minima and maxima of the second harmonic. It was found that the −6 dB beam size along both the transverse and central axis of the transducer decreases with the harmonic number by n−1/2, which is consistent with results from previous studies.12
FIG. 8.
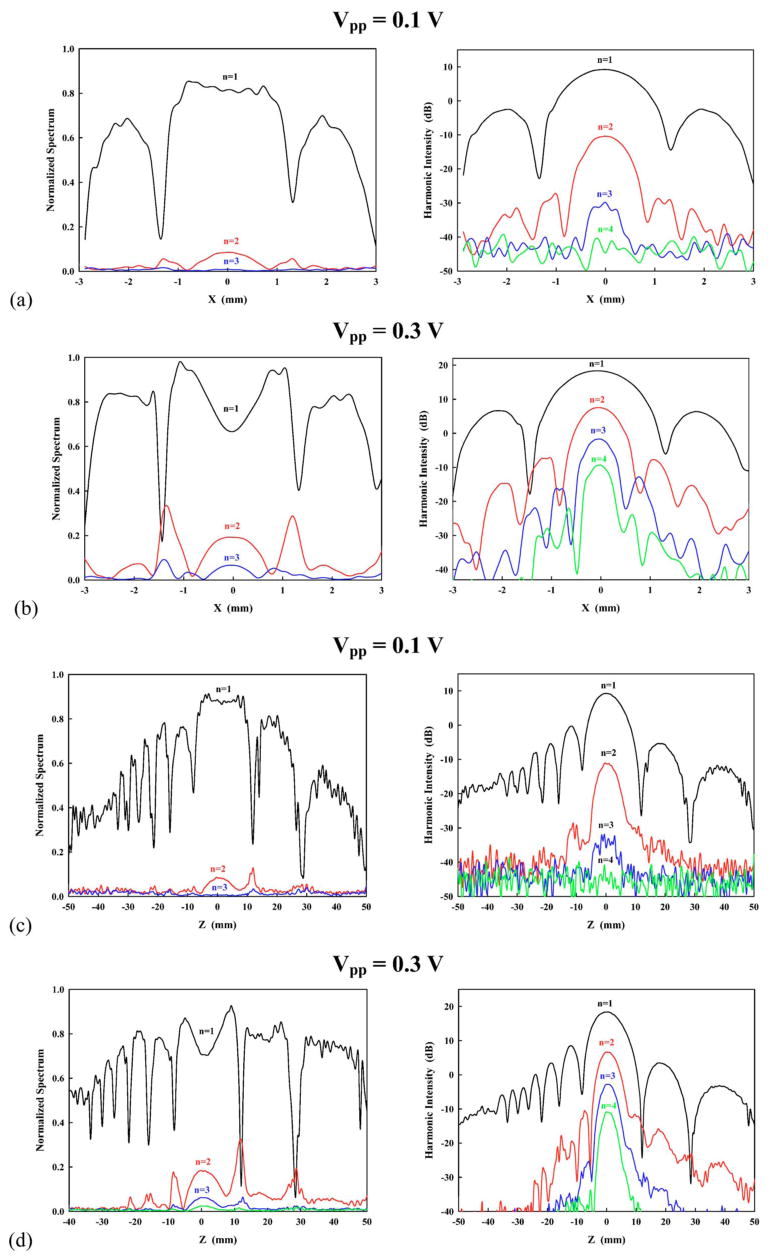
(Color online) Harmonics distribution of the 1.1 MHz HIFU transducer at different peak-to-peak output voltage of the function generator Vpp (0.1 V and 0.3 V). Left column is normalized spectrum and right column is harmonic intensity with respect to the reference pressure of 1 MPa. Plots in (a) and (b) are transverse (x) while plots in (c) and (d) are along (z) the transducer axis.
C. Comparison of HIFU fields at 1.1 and 3.3 MHz
At the same output voltage, Vpp, the peak pressures produced by the HIFU transducer at 3.3 MHz were much higher than the corresponding values at 1.1 MHz (Fig. 4). For example, at Vpp=0.5 V the peak positive and negative pressures at 3.3 MHz were 35.1±0.1 MPa and −13.8±0.6 MPa; while the corresponding values at 1.1 MHz were 23.3±0.6 MPa and −10±0.4 MPa, respectively. In consequence, the calculated ISPPA at 3.3 MHz was much higher (Table III). When Vpp>0.3 V, the rate of increase for p+ began to saturate, presumably because of the significantly increased attenuation of higher order harmonics during nonlinear wave propagation. It was found that the electric input power and electric-to-acoustic energy conversion ratio of the HIFU transducer at 3.3 MHz were similar to those at 1.1 MHz (Tables I and III). In addition, the nonlinear effects on wave-form distortion and the beam size change at 3.3 MHz were found to be similar to those at 1.1 MHz. For example, there is no significant difference in the calculated slopes of the acoustic intensities from all harmonics produced at either 3.3 MHz or 1.1 MHz (Table II), which suggests that harmonics generation is independent to the central frequency of the burst.
TABLE III.
Acoustic intensity, power output, and electric-to-acoustic energy conversion efficiency of the 3.3 MHz HIFU transducer.
| Output Vpp (V) | ISPPA (W/cm2) | ISAPA (W/cm2) | ISAPA/ISPPA | Pin (W) | P (W) | P/Pin |
|---|---|---|---|---|---|---|
| 0.05 | 240 | 127 | 0.53 | 1.10 | 0.72 | 65.4% |
| 0.1 | 981 | 551 | 0.56 | 4.38 | 2.92 | 66.8% |
| 0.2 | 3728 | 2338 | 0.63 | 17.52 | 12.71 | 72.5% |
| 0.3 | 7088 | 4801 | 0.68 | 40.75 | 28.05 | 68.8% |
| 0.4 | 9730 | 6849 | 0.70 | 73.36 | 50.54 | 68.9% |
| 0.5 | 10 967 | 8144 | 0.74 | 109.56 | 62.90 | 57.4% |
The pressure distributions of the 3.3 MHz HIFU transducer both transverse to and along the central axis of the HIFU transducer are shown in Fig. 9. In comparison to those produced at 1.1 MHz, the beam size became much smaller (∼0.5×4 mm) and the side lobe was less significant, suggesting that the acoustic energy is concentrated more towards the focus. As a result, the peak pressure and acoustic intensity become much larger at the similar electric input power. At higher output voltage, the nodes in the pressure distribution of the compressional wave at 3.3 MHz, both transverse to and along the central axis of the HIFU transducer, gradually disappeared and began to merge with the main lobe. In contrast, the node in the rarefactional pressure distribution always existed. In addition, when Vpp>0.2 V, two pressure peaks, both compressional wave and rarefactional wave, appeared along the central axis of the HIFU transducer at about z=2 mm. The reason for this unique feature is not completely known.
FIG. 9.
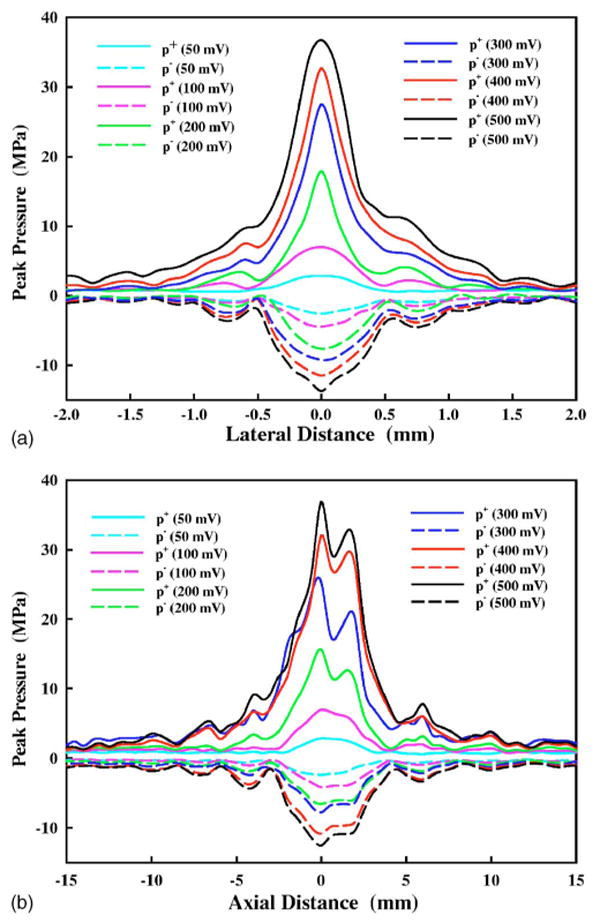
(Color online) Pressure distribution (a) transverse to and (b) along the 3.3 MHz HIFU transducer axis with the output voltage in the range of 0.1–0.5 V.
As a result of nonlinear propagation in water, the enhancement ratio of absorbed acoustic power density of the HIFU transducer at the beam focus was found to increase from 1.0 to 3.0 at 1.1 MHz (Fig. 10). In comparison, the corresponding enhancement ratio at 3.3 MHz was lower at a given intensity and the theoretically predicted reduction in enhancement factor at higher power (ISPPA>10 000 W/cm2) was also observed.12,18 The initial increase of the enhancement ratio at 1.1 MHz was very slow up to 100 W/cm2, which was similar to the nonlinear propagation threshold for 1.7 MHz focused ultrasound in water based on the measurements by a PVDF membrane hydrophone.12 Above 100 W/cm2, the enhancement ratio grew much more quickly. It should be noted that because ultrasound absorption coefficients in water and biological tissues are frequency dependent, the total acoustic power absorbed at 3.3 MHz is significantly higher than that at 1.1 MHz, which has been confirmed by thermocouple measurement (data not shown).
FIG. 10.
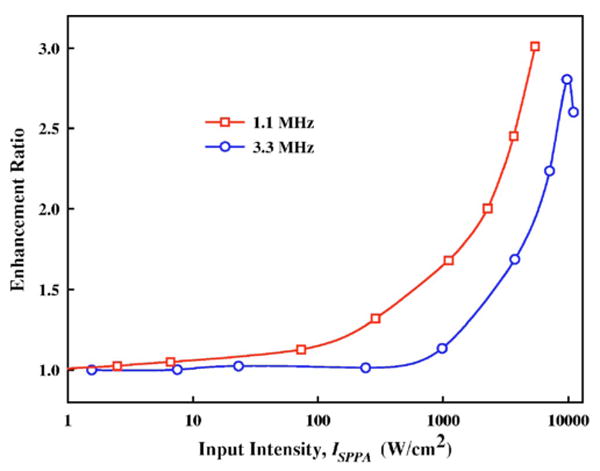
(Color online) The enhancement ratio for absorbed acoustic power per unit volume at the focus of the HIFU transducer operating at either 1.1 or 3.3 MHz.
IV. DISCUSSION
Accurate exposimetry measurement of HIFU systems is essential for determining the causal relationship between ultrasound exposure and resultant bioeffects, and for ensuring the effectiveness and safety of clinical HIFU treatment. From the regulatory point of view, exposimetry information is also important for quality control and comparison between different HIFU systems. Currently available methods are either limited by their temporal and spatial resolution (calorimetry and radiation force measurement) or their accuracy and reliability under clinically relevant HIFU intensities (optical techniques, PVDF membrane and needle hydrophones). In this study, we evaluated the feasibility of using a self-calibrated FOPH17 for HIFU exposimetry measurement, which offers the unique advantages of small probe size (0.1 mm), broad bandwidth (50 MHz), robustness under high-pressure amplitude, and longevity. The calibration of the FOPH is done strictly based on the relation between pressure and reflection coefficient at the fiber tip (measured by the photodetector) that is defined exclusively by the material properties of the fiber and surround medium (i.e., water).17 For calibration of the FOPH only a dc-photodiode voltage needs to be determined before the measurement without any reference standards. Therefore, FOPH is especially convenient for harmonics measurement in a HIFU field compared to PVDF membrane and needle hydrophones, which, in addition to their susceptibility to cavitation damage, must be calibrated at different discrete frequencies.
The small sensor size of the FOPH is also advantageous for resolving high frequency components in HIFU fields. According to the IEC 61102 guideline, in order to reduce the influence of spatial averaging the effective diameter (dh) of the hydrophone active element must satisfy the following criterion:
| (5) |
where λ is the acoustic wavelength at the center frequency, z is the source-to-hydrophone distance, and ds is the relevant source dimension.20 Based on this criterion, both the FOPH and PVDF hydrophone can resolve well the 1.1 MHz HIFU field (see Fig. 2). However, the PVDF membrane hydrophone will suffer significantly from signal averaging effect when measuring the 3.3 MHz HIFU field (see Fig. 3). Furthermore, low frequency response of a hydrophone is also important for reliable measurement of lithotripsy and diagnostic pulses.23 With deconvolution, the bandwidth of FOPH can be extended towards both low and high frequencies. In contrast, the low frequency response of PVDF membrane hydrophone is limited (i.e., its sensitivity at frequency lower than 100 kHz is usually very weak).24 It should be noted, however, that when the criterion is satisfied and for weak pressure signals within linear propagation range, the PVDF membrane hydrophone can resolve the pressure signals much better because of its significantly higher sensitivity than the FOPH (see Fig. 2).
Using the FOPH we have measured the pressure wave forms produced by a focused HIFU transducer working at either 1.1 or 3.3 MHz in a wide range of output intensities ISPPA=1–11 000 W/cm2. Significant wave-form distortion, which is characteristic of nonlinear propagation,21 was produced at mediate and high output levels (Fig. 5). The characteristics of harmonics generation [see Fig. 5(b) and Table II] and harmonics beam size variation (Fig. 8) at both 1.1 and 3.3 MHz are similar to the results of 1.7 MHz HIFU field reported previously using a PVDF membrane hydrophone.12 The most immediate consequence of nonlinear propagation is the narrowing of beam size due to harmonics generation with the associated increase of energy concentration toward the focus. This can be seen from the increased ratio of ISAPA/ISPPA within the output range investigated in this work (Tables I and III). Moreover, harmonics generation can lead to significant enhancements in energy absorption due to higher attenuation coefficients at harmonic frequencies.12,21 Previous studies have suggested that the enhancements may contribute primarily to the initiation of lesion or cavitation on the transducer axis.6,12
Theoretical modeling of acoustic and thermal field produced by a HIFU transducer is important for better predicting and controlling lesion formation in clinical therapy. Several numerical simulations have been carried out, using the Khokhlov-Zabolotskaya-Kuznetsov (KZK) equation for modeling nonlinear propagation of high intensity acoustic beams25,26 and the BioHeat transfer equation (BHTE)27 to model the temperature elevation in tissue. A reliable characterization of the HIFU field (pressure wave form, pressure and thermal distribution) will be important for validating these numerical simulations.
In summary, FOPH has been shown to be an appropriate and reliable tool for HIFU exposimetry measurement, especially at high output intensity levels. It can be used to measure the pressure wave forms, distribution, and characterize the nonlinear propagation features in a HIFU field. Furthermore, the measurement data can be used to calculate the acoustical power and intensity output of the HIFU transducer, and to provide essential and critical information for device characterization and comparison, as well as for modeling nonlinear wave propagation and cavitation effect in a HIFU field.
Acknowledgments
This work was supported in part by NIH through Grants Nos. RO1-DK52958, RO1-EB02682, and R21-EB03299. The authors also wish to thank George Keilman of Sonic Concepts for helpful discussion on determination of the electrical input power to the HIFU transducer and Professor Wolfgang Eisenmenger and Dr. Rainer Pecha for their helpful comments on the paper.
References
- 1.Vallancien G, Harouni M, Guillonneau B, Veillon B, Bougaran J. Ablation of superficial bladder tumors with focused extracorporeal pyrotherapy. Urology. 1996;47:204–207. doi: 10.1016/S0090-4295(99)80417-8. [DOI] [PubMed] [Google Scholar]
- 2.Visioli AG, Rivens IH, ter Haar GR, Horwich A, Huddart RA, Moskovic E, Padhani A, Glees J. Preliminary results of a phase I dose escalation clinical trial using focused ultrasound in the treatment of localised tumours. Eur J Ultrasound. 1999;9:11–18. doi: 10.1016/s0929-8266(99)00009-9. [DOI] [PubMed] [Google Scholar]
- 3.Wu F, Chen WZ, Bai J, Zou JZ, Wang ZL, Zhu H, Wang ZB. Pathological changes in human malignant carcinoma treated with high-intensity focused ultrasound. Ultrasound Med Biol. 2001;27:1099–1106. doi: 10.1016/s0301-5629(01)00389-1. [DOI] [PubMed] [Google Scholar]
- 4.Wu F, Wang ZB, Chen WZ, Zou JZ, Bai J, Zhu H, Li KQ, Xie FL, Jin CB, Su HB, Gao GW. Extracorporeal focused ultrasound surgergy for treatment of human solid carcinomas: early Chinese clinical experience. Ultrasound Med Biol. 2004;30:245–260. doi: 10.1016/j.ultrasmedbio.2003.10.010. [DOI] [PubMed] [Google Scholar]
- 5.ter Haar GR. Ultrasound focal beam surgery. Ultrasound Med Biol. 1995;21:1089–1100. doi: 10.1016/0301-5629(95)02010-1. [DOI] [PubMed] [Google Scholar]
- 6.Watkin NA, ter Haar GR, Rivens IH. The intensity dependence of the site of maximal energy deposition in focused ultrasound surgery. Ultrasound Med Biol. 1996;22:483–491. doi: 10.1016/0301-5629(95)02062-4. [DOI] [PubMed] [Google Scholar]
- 7.Wells PNT, et al. The dosimetry of small ultrasonic beams. Ultrasonics. 1963;1:106–110. [Google Scholar]
- 8.Hill CR. Calibration of ultrasonic beams for bio-medical applications. Phys Med Biol. 1970;15:241–248. doi: 10.1088/0031-9155/15/2/001. [DOI] [PubMed] [Google Scholar]
- 9.Hill CR, Rivens H, Vaughan MG, ter Haar GR. Lesion development in focused ultrasound surgery: a general model. Ultrasound Med Biol. 1994;20:259–269. doi: 10.1016/0301-5629(94)90066-3. [DOI] [PubMed] [Google Scholar]
- 10.Sokka S, King R, Hynynen K. MRI-guided gas bubble enhanced ultrasound heating in in vivo rabbit thigh. Phys Med Biol. 2003;48:223–241. doi: 10.1088/0031-9155/48/2/306. [DOI] [PubMed] [Google Scholar]
- 11.Hynynen K. The threshold for thermally significant cavitation in dog's thigh muscle. Ultrasound Med Biol. 1991;17:157–169. doi: 10.1016/0301-5629(91)90123-e. [DOI] [PubMed] [Google Scholar]
- 12.Clarke RL, ter Haar GR. Production of harmonics in vitro by high-intensity focused ultrasound. Ultrasound Med Biol. 1999;25:1417–1424. doi: 10.1016/s0301-5629(99)00088-5. [DOI] [PubMed] [Google Scholar]
- 13.Chavrier F, Chapelon JY, Gelet A, Cathignol D. Modeling of high-intensity focused ultrasound-induced lesions in the presence of cavitation bubbles. J Acoust Soc Am. 2000;108:432–440. doi: 10.1121/1.429476. [DOI] [PubMed] [Google Scholar]
- 14.Bailey MR, Couret LN, Sapozhnikov OA, Khokhlova VA, ter Haar GR, Vaezy S, Shi XG, Martin R, Crum LA. Use of overpressure to assess the role of bubbles in focused ultrasound lesion shape in vitro. Ultrasound Med Biol. 2001;27:695–708. doi: 10.1016/s0301-5629(01)00342-8. [DOI] [PubMed] [Google Scholar]
- 15.Schneider B, Shung KK. Quantitative analysis of pulsed ultrasonic beam patterns using a Schlieren system. IEEE Trans Ultrason Ferroelectr Freq Control. 1996;43:1181–1186. [Google Scholar]
- 16.Holm A, Persson HW, Lindstrom K. Measurements of ultrasonic fields with optical diffraction tomography. Ultrasound Med Biol. 1991;17:505–512. doi: 10.1016/0301-5629(91)90188-3. [DOI] [PubMed] [Google Scholar]
- 17.Staudenraus J, Eisenmenger W. Fiberoptic probe hydrophone for ultrasonic and shock-wave measurements in water. Ultrasonics. 1993;31:267–273. [Google Scholar]
- 18.Swindell W. A theoretical study of nonlinear effects with focused ultrasound in tissues: an acoustic bragg peak. Ultrasound Med Biol. 1985;11:121–130. doi: 10.1016/0301-5629(85)90014-6. [DOI] [PubMed] [Google Scholar]
- 19.Nyborg WL, Wu J. Relevant field parameter with rationale. In: Ziskin MC, Lewin PA, editors. Ultrasonic Exposimetry. CRC Press; Boca Raton, FL: 1992. pp. 85–112. [Google Scholar]
- 20.Harris GR. A discussion of procedures for ultrasonic intensity and power calculations from miniature hydrophone measurements. Ultrasound Med Biol. 1985;11:803–817. doi: 10.1016/0301-5629(85)90074-2. [DOI] [PubMed] [Google Scholar]
- 21.Muir TG, Carstensen EL. Prediction of nonlinear acoustic effects at biomedical frequencies and intensities. Ultrasound Med Biol. 1980;6:345–357. doi: 10.1016/0301-5629(80)90004-6. [DOI] [PubMed] [Google Scholar]
- 22.Averkiou MA, Cleveland RO. Modeling of an electrohydraulic lithotripter with the KZK equation. J Acoust Soc Am. 1999;106:102–112. doi: 10.1121/1.427039. [DOI] [PubMed] [Google Scholar]
- 23.Harris GR. Pressure pulses distortion by hydrophones due to diminished low frequency response. IEEE Trans Ultrason Ferroelectr Freq Control. 1995;42:989–992. [Google Scholar]
- 24.DeReggi AS, Roth SC, Kenney JM, Edelman S, Harris GR. Piezoelectric polymer probe for ultrasonic applications. J Acoust Soc Am. 1981;69:853–859. [Google Scholar]
- 25.Bakhvalov NS, Zhileikin YM, Zabolotskaya EA. Nonlinear Theory of Sound Beams. AIP; New York: 1987. [Google Scholar]
- 26.Meaney PM, Cahill MD, ter Haar GR. The intensity dependence of lesion position shift during focused ultrsound surgery. Ultrasound Med Biol. 2000;26:441–450. doi: 10.1016/s0301-5629(99)00161-1. [DOI] [PubMed] [Google Scholar]
- 27.Pennes HH. Analysis of tissue and arterial blood temperature in the resting human forearm. J Appl Physiol. 1948;1:93–122. doi: 10.1152/jappl.1948.1.2.93. [DOI] [PubMed] [Google Scholar]


