Abstract
A theoretical model for the propagation of shock wave from an axisymmetric reflector was developed by modifying the initial conditions for the conventional solution of a nonlinear parabolic wave equation (i.e., the Khokhlov–Zabolotskaya–Kuznestsov equation). The ellipsoidal reflector of an HM-3 lithotripter is modeled equivalently as a self-focusing spherically distributed pressure source. The pressure wave form generated by the spark discharge of the HM-3 electrode was measured by a fiber optic probe hydrophone and used as source conditions in the numerical calculation. The simulated pressure wave forms, accounting for the effects of diffraction, nonlinearity, and thermoviscous absorption in wave propagation and focusing, were compared with the measured results and a reasonably good agreement was found. Furthermore, the primary characteristics in the pressure wave forms produced by different reflector geometries, such as that produced by a reflector insert, can also be predicted by this model. It is interesting to note that when the interpulse delay time calculated by linear geometric model is less than about 1.5 μs, two pulses from the reflector insert and the uncovered bottom of the original HM-3 reflector will merge together. Coupling the simulated pressure wave form with the Gilmore model was carried out to evaluate the effect of reflector geometry on resultant bubble dynamics in a lithotripter field. Altogether, the equivalent reflector model was found to provide a useful tool for the prediction of pressure wave form generated in a lithotripter field. This model may be used to guide the design optimization of reflector geometries for improving the performance and safety of clinical lithotripters.
I. INTRODUCTION
Since its invention in the early 1980s, shock wave lithotripsy (SWL) has revolutionized the treatment for renal and upper urinary stones.1 Currently, approximately 75% of stone patients are treated by SWL alone and another 20% by SWL in conjunction with endoscopic procedures.2 In spite of this great success and the fact that several new generations of lithotripters have been introduced for clinical use, no fundamental improvements in SWL technology that can lead to better treatment efficiency with reduced tissue injury have been accomplished in the past two decades.2–4 The first-generation Dornier HM-3 lithotripter is still regarded by most urologists in the US as the gold standard of SWL.3
Both clinical and basic studies have shown that SWL can produce acute renal injury, such as hematuria, kidney enlargement, renal and perirenal hemorrhage and hematomas, especially with the much higher pressure output of the third-generation lithotripters.5–9 Following SWL, although most young adult patients recover well, a subgroup of patients, such as pediatric and elderly patients, and patients with pre-existing renal function impairment, are much more susceptible to SWL-induced chronic injury.6 Efforts have been under way to improve the design of lithotripter shock wave sources to improve stone comminution while reducing concomitantly the collateral renal injury.4,10–13
Theoretical modeling of the propagation and focusing of lithotripter shock wave (LSW), and bubble dynamics in a lithotripter field is important for understanding the working mechanisms of SWL and for design optimization of the lithotripters. Attempts of modeling the acoustic field of an electrohydraulic shock wave lithotripter have been carried out by several groups. Hamilton developed a linear model to simulate the pressure wave form along the lithotripter axis, which provides useful insight on the evolution of different LSW components during wave converging toward the lithotripter focus.14 Coleman and colleagues used the Burger's equation, which is a one-dimensional version of the Khokhlov–Zabolotskaya–Kuznestsov (KZK) equation to model the focused LSW and diffractive effects were considered by assuming the sound field as a Gaussian beam.15 Christopher developed a nonlinear propagation model to account for wave diffraction, absorption, dispersion, and nonlinearity, though a limit on peak negative pressure needs to be set in the model calculation.16 Averkiou and Cleveland used geometrical acoustics to describe the wave propagation within a reflector bowl, and subsequently the calculated pressure distribution at the reflector aperture was fed into a two-dimensional KZK model as source condition to simulate the propagation and focusing of LSWs.17 Colonius and Tanguay developed a model of shock wave propagation using an ensemble averaged two-phase flow model for the bubbly mixture combined with a high-order accurate shock capturing technique.18,19 Szeri and colleagues modeled the reflector as an interface with a density jump across it, and used a finite-volume scheme to solve the reflection and steepening of a pressure wave based on the Euler equations coupled with the Tait equation of state.20,21 Although these previous works have led to a better understanding of the shock wave propagation and evolution in a lithotripter field, there are still some discrepancies between the measurements and the simulated results, such as in the wave form profile, pressure distribution, and the evolution of different wave components. In addition, there are significant discrepancies in the assumed pressure wave form generated by the spark discharge of the HM-3 lithotripter in the previous model calculations.16–19
In this study, the shock wave emanated from the spark discharge between the electrode tips in an HM-3 lithotripter was measured by a fiber optic probe hydrophone (FOPH) and used as the source condition for the model calculation. An equivalent reflector model was developed and coupled with the KZK equation to simulate the acoustic field of an HM-3 lithotripter using either the original or an upgraded reflector. The simulated results were compared with the experimental measurements and also with the results calculated using the Averkiou and Cleveland model (referred to in this paper as the AC model) both along and transverse to the lithotripter axis. Furthermore, the effects of the reflector insert geometry on LSW profile and bubble dynamics were evaluated.
II. EXPERIMENTAL MATERIALS AND METHODS
A. Lithotripter
The experiments were carried out in a Dornier HM-3 lithotripter with a 80 nF capacitor and a truncated brass ellipsoidal reflector with a semi-major axis a=138 mm, a semi-minor axis b=77.5 mm, and half-focal length c=114 mm. A thin shell ellipsoidal reflector insert, developed in our previous studies,4,13,22 was also used. The outer surface of the insert matches with the original HM-3 reflector and the inner surface fits an ellipsoidal surface with a′=132.5 mm, b′=71.5 mm, and c′=111.5 mm. The lower edge of the reflector insert was 4 mm above the focal plane at F1 where the tips of the electrode are centered.4,13
B. Pressure field mapping
The pressure wave forms produced by the HM-3 lithotripter with either the original or the upgraded reflectors were measured using a FOPH-500 (RP Acoustics, Leutenbach, Germany). The sensing probe of the hydrophone, a 100 μm optical fiber, was placed inside a holder and attached to a three-dimensional position system (step motors: VX M-2, lead screws: BiSlide-M02, Velmex, Bloomfield, NY), which has a minimum step size of 5 μm and a maximum scanning range of 250 mm. The hydrophone was tilted at 14° so that the probe could be aligned parallel to the lithotripter axis (Fig. 1). A mechanical pointer was used to aid the alignment of the probe tip with F2. A program was used to control the automatic scan of the probe in the lithotripter field at a minimum step size of 1 mm. At each location, at least six pressure wave forms were recorded by a digital oscilloscope (LeCroy 9314M, Chestnut Ridge, NY) operated at 100 MHz sampling rate and the data were subsequently transferred to a PC for offline analysis.
FIG. 1.
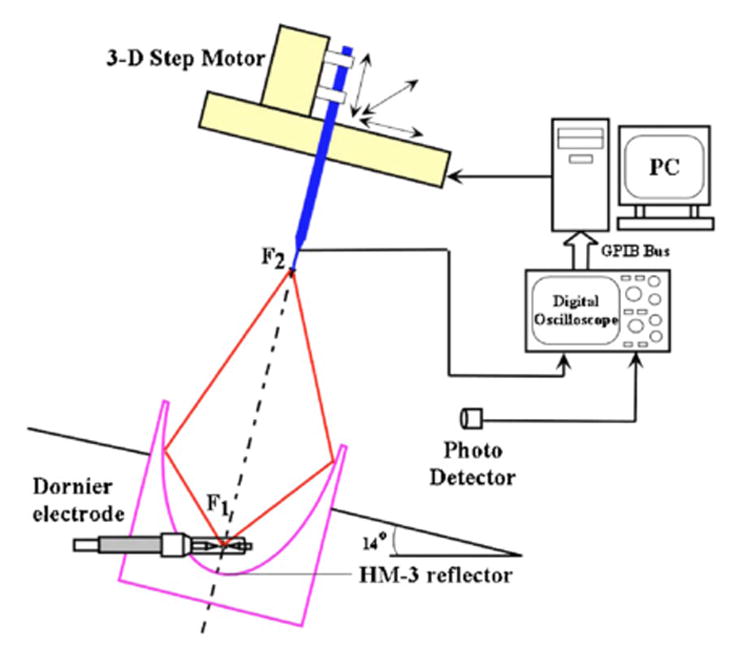
The experimental setup for pressure mapping in a Dornier HM-3 lithotripter by fiber optical probe hydrophone.
C. Equivalent reflector model
The ellipsoidal reflector of an HM-3 lithotripter can be considered to be equivalent to a spherical reflector with a focal length of 2a and with its focus at F2 (Fig. 2). In this model shock waves will emanate from the surface of the equivalent reflector, instead of bouncing off from the ellipsoidal reflector before focusing toward F2. The distance between a point on the ellipsoidal surface and the electrode tip (F1) is
FIG. 2.
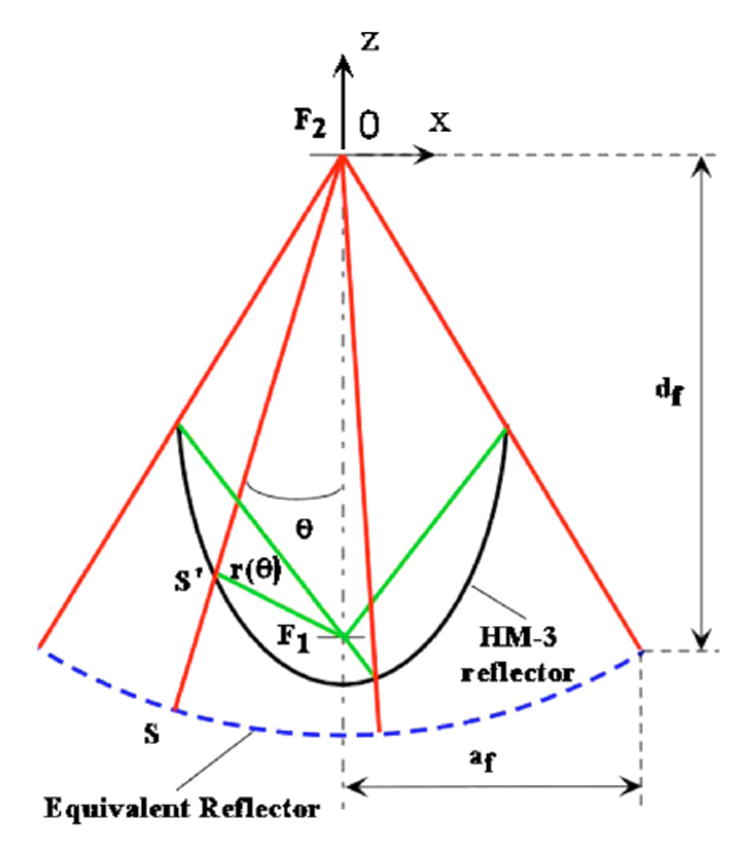
The schematic diagram of the equivalent reflector model. The solid line shows the ellipsoidal reflector of an HM-3 lithotripter, and the dashed line shows the equivalent reflector of it.
| (1) |
where ε is the eccentricity of the ellipse, θ is the incident angle of an acoustic ray with respect to the lithotripter axis towards F2. In addition, the spark discharge at F1 is assumed to be a spherical source, which satisfies
| (2) |
where p0 is the sound pressure at a distance of a-c from F1, r is the traveling distance. Combining Eqs. (1) and (2) the pressure amplitude at the point S′ is equal to
| (3) |
Then the pressure amplitude at the point S can be estimated as |p(θ)|=|p′(θ)| · [2a−r(θ)]/2a by using the ray theory. Therefore, pressure wave form at the aperture of the equivalent reflector can now be expressed as
| (4) |
where f(*) is the source wave form of electrohydraulic spark discharge, ρ=x/af and τ=ω0t′=ω0(t−z/c0) are normalized variables, x and z is the coordinate transverse to and along the axis of the sound beam, respectively, t is the propagation time from F1, af is the aperture radius, c0 is the sound speed of small amplitude signal in water, ω0 is a characteristic angular frequency, G is the focusing gain, and h(*) is the step unit function.
The pressure wave form in the lithotripter field is simulated by using an axisymmetric form of the KZK equation solved in dimensionless form:17,23,24
| (5) |
where P=p/p0, σ=z/df, τ=ω0t′, and df is the focal length. The three items on the right of Eq. (5) account for the effect of diffraction, absorption, and nonlinearity phenomena on the progressive propagation of the LSW. The dimensionless parameters that describe the relative importance of those phenomena are
| (6) |
respectively, where z0=ω0a2f/2c0 is the Rayleigh distance, α0 is the thermo-viscous attenuation coefficient, z¯=ρ0c30/βω0p0 is the plane wave shock formation distance, ρ0 is the ambient density of the fluid, β is the nonlinearity coefficient. The corresponding parameters for water used in the numerical code are α0 (f=0.25 MHz)=0.0016 Np/m, β=3.5, ρ0=1000 kg/m3, c0=1500 m/s.17 In calculating the lithotripter field produced by the upgraded reflector, the initial conditions for the KZK equation have two parts, one from the inner surface of the reflector insert (0°≤θ≤11.8°) and the other from the uncovered bottom surface of the original HM-3 reflector (11.8°<θ≤32.5°).
The normalized KZK equation was solved numerically in the time domain using finite-difference operators to approximate the derivatives. The diffraction, absorption, and nonlinearity algorithms were implemented independently over each step Δσ because the order in which these three effects were included is not important. In the near field region, a fully implicit backward finite difference method was used to effectively reduce numerical oscillations. Beyond the oscillatory region, a Crank-Nicolson finite difference method with a second-order approximation in Δσ was applied which permits larger step sizes.17,23 It was found that the r.m.s. error of the algorithm is proportional to (Δσ)1.3, and the expected convergence rate is almost proportional to (Δσ)1.0.23 The computation time for simulating a full lithotripter field with the equivalent reflector in a P4 1.0 GHz 256 MByte memory PC is about 10 h.
D. Modeling of bubble dynamics in a lithotripter field
The Gilmore model was applied to estimate the radial oscillation of a single spherical bubble with consideration of the compressibility of the liquid.25
| (7) |
where R is the bubble radius, and U (=dR/ dt) is the velocity of the bubble wall, C is the speed of sound in the liquid at the bubble wall, and H is the enthalpy difference between the liquid at pressure P(R) and pressure P∞. The gas diffusion during bubble oscillation is not considered since we are most interested in the expansion phase of the bubble dynamics as it is related to the propensity of tissue injury.22 The Gilmore model was solved by using the fifth-order Runge–Kutta–Fehlberg method with a step-size control algorithm.26
III. RESULTS
A. Pressure field and distribution
The distributions of the peak positive (p+) and peak negative (p−) pressure, both along and transverse to the lithotripter axis at F2, are shown in Fig. 3 and the −6 dB beam sizes are listed in Table I. It is found that the beam sizes of p− are larger than the corresponding values of p+ because the tensile component of LSW has much lower frequency (∼125 kHz) than the compressive wave (∼0.5 MHz); here the frequency of LSW component is defined as the half reciprocal of the wave component duration time. The pressure distribution in the focal plane of the original HM-3 reflector is not axisymmetric. Larger beam width was found in the head-foot direction than in the left-right direction [Figs. 3(a) and 3(b)], which is presumably caused by the lateral truncation of the original HM-3 reflector to accommodate the bi-planar fluoroscopic imaging system for stone localization. In comparison, the pressure distribution of the upgraded reflector was found to be more axisymmetric and with smaller beam size.
FIG. 3.
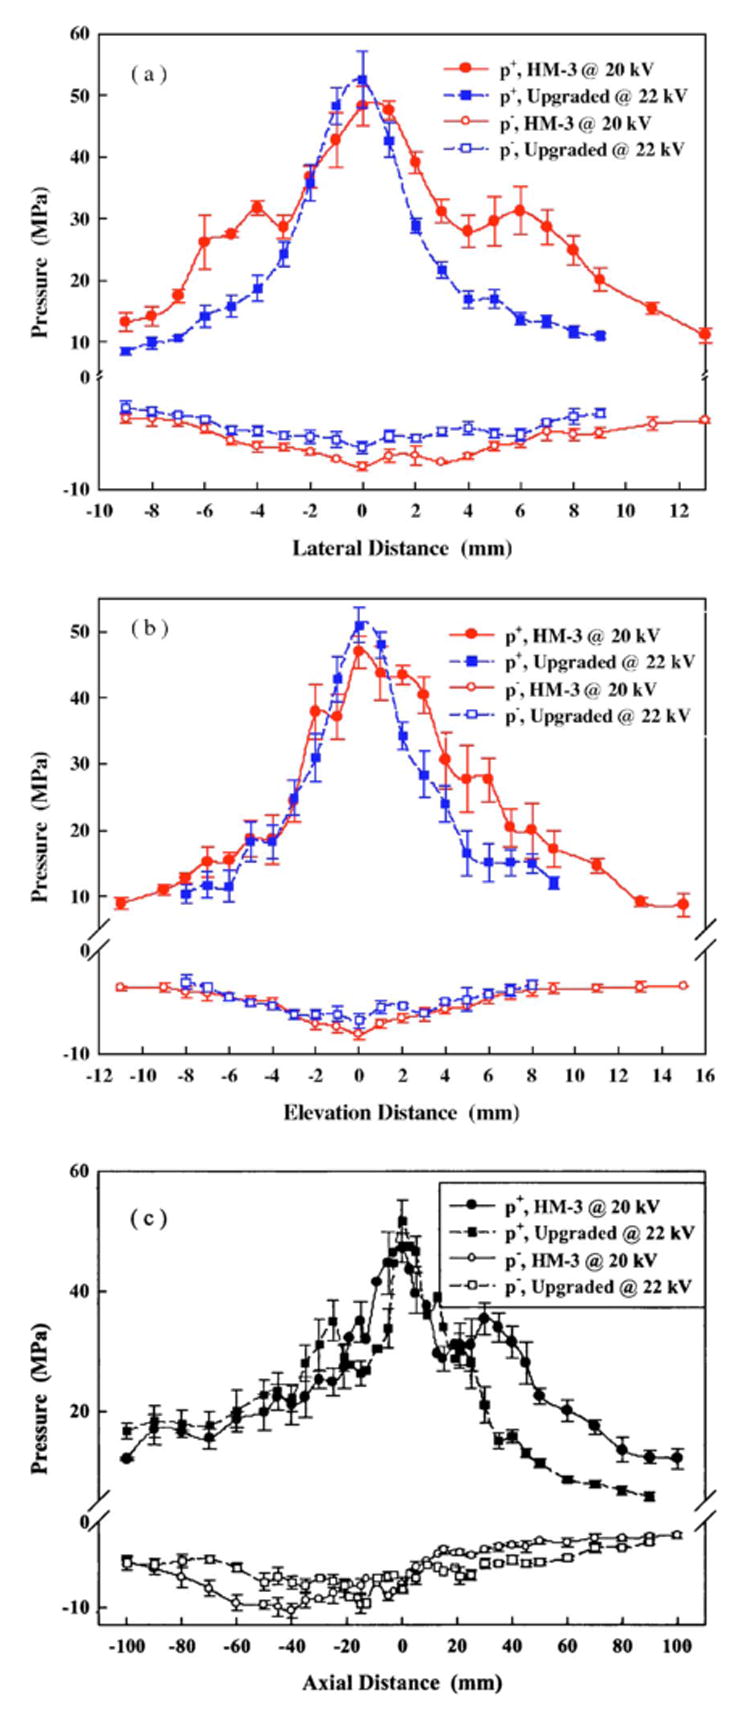
Distribution of the peak pressure of the lithotripter shock waves in the (a) foot-head, (b) left-right, and (c) axial direction generated by using the original HM-3 reflector at 20 kV and the upgraded reflector at 22 kV.
Table I.
Comparison of −6 dB beam size of lithotripter field produced by the original HM-3 reflector at 20 kV and the upgraded reflector at 22 kV.
| HM-3 reflector at 20 kV
|
Upgraded reflector at 22 kV
|
|||
|---|---|---|---|---|
| Reflector configuration | p+ | p− | p+ | p− |
| Focal width, head-foot (mm) | 14.3 | 18 | 5.9 | 16.2 |
| Focal width, left-right (mm) | 9.6 | 14.8 | 6.6 | 15 |
| Focal extent (mm) | 81.4 | 118.6 | 62.1 | 90 |
B. Source condition
The pressure wave form produced by the spark discharge of the HM-3 lithotripter at 20 kV is shown in Fig. 4(a). The wave form can be fitted in an exponential decay curve [dashed line in Fig. 4(a)], which is characteristic of an underwater explosion:27
FIG. 4.
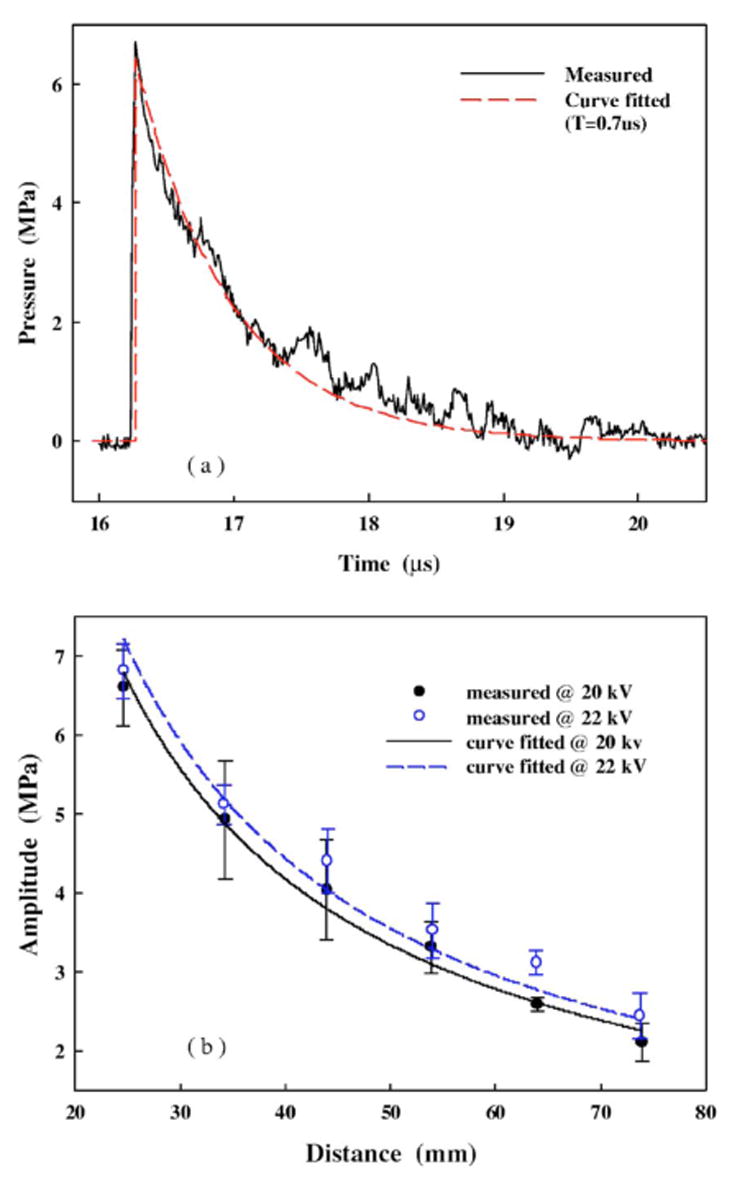
(a) The pressure wave form produced by the electrode spark discharge of HM-3 lithotripter at 20 kV at about 24 mm away from F1. The dashed line is the fitted curve in an exponential decay format and (b) the pressure amplitude is found to be inversely proportional to the propagation distance at both 20 and 22 kV.
| (8) |
where A is the peak positive pressure, T is a time constant, t0 is the retarded time. Furthermore, the pressure amplitude was found to be inversely proportional to the traveling distance from F1, c0t0 [Fig. 4(b)]. For the equivalent model calculation, the source pressure p0 was estimated to be 6.8 MPa at 20 kV and 7.3 MPa at 22 kV, respectively.
C. Simulated pressure wave forms
1. Comparison between the equivalent reflector model and the AC model
Figures 5 and 6 show the simulated LSW profiles both transverse to (Fig. 5) and along the lithotripter axis (Fig. 6), using the equivalent reflector model (solid line in the right column) and the AC model (the dashed line in the right column), respectively, together with the pressure wave forms measured experimentally (the left column). Because shock wave propagation and focusing are considered inside the reflector bowl in the equivalent reflector model, the simulated LSW always travels in advance of the corresponding LSW predicted by the AC model. In addition, the time delay between the arrival of the LSW and the estimated value using small-signal acoustic speed in water increases with the propagation distance. At z=−70 and 0 mm the LSW arrives at a retarded time of −0.08 and −0.58 μs based on the AC model and −0.43 and −1.12 μs using the equivalent reflector model, respectively. There are also significant differences in the profile of the LSWs predicted by the two models. First, at F2 [Fig. 5(a)] the tensile component of the LSW predicted by the AC model has a prolonged duration near p− before quickly returning to the equilibrium pressure. In comparison, the pressure wave form predicted by the equivalent reflector model reaches p− earlier and then gradually returns to zero, which resembles more closely the measured pressure wave forms28–30 although the tensile duration is slightly shorter than the measured wave form. Second, using the AC model the rise time of the compressive wave increases substantially from 31 ns at x=0 to 1.04 μs at x=6 mm and the wave form becomes almost sinusoidal at x=9 mm. In comparison, at x=6 mm the simulated wave form from the equivalent reflector model has a rise time of 0.2 μs, and overall, resembles more closely the measured pressure wave forms (Fig. 5). Furthermore, the equivalent reflector model clearly predicts the separation of a single peak in the LSW profile into two distinct peaks along the transverse direction of the lithotripter field. In comparison, the peak separation is not clearly predicted using the AC model [Fig. 5(d)]. Third, beyond the focal point the diffracted wave originated from the aperture edge of the reflector will overtake the center wave of the LSW.14 The general characteristics of the edge wave evolution are well predicted by both models and are in good agreement with the linear model prediction, i.e., the edge wave moves toward the central wave and merges with the wake when propagating toward the focal point, and subsequently, it overtakes the central wave beyond F2.14 However, the advancing speed of the edge wave in the AC model was found to be much faster than that predicted by the equivalent reflector model [Figs. 6(g) and 6(h)]. At z=70 mm, the time delay between the edge and central wave is 3.2 μs based on the AC model, compared to 1.5 and 1.45 μs based on the equivalent reflector model and pressure wave form measurement [Fig. 6(h)].
FIG. 5.
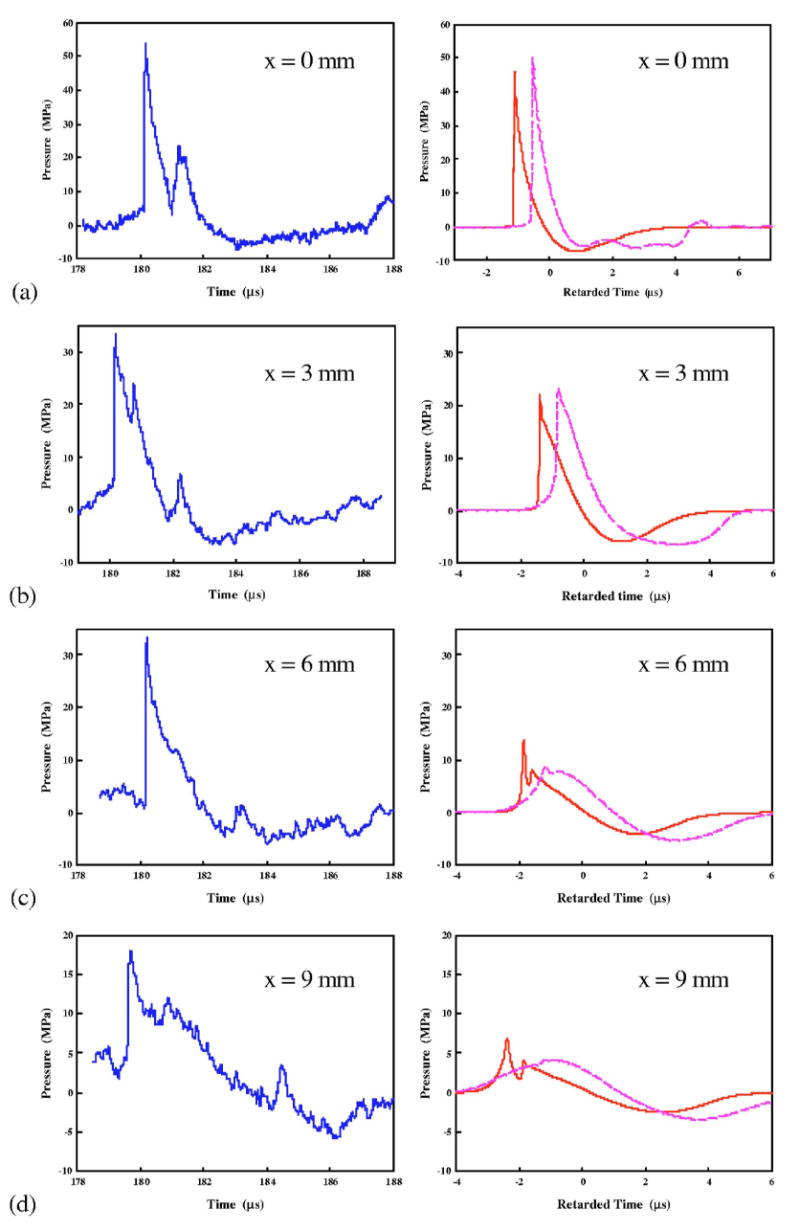
The pressure wave forms of Dornier HM-3 lithotripter at 20 kV transverse to lithotripter axis in the focal plane at (a) x=0 mm, (b) x=3 mm, (c) x=6 mm, and (d) x=9 mm. Left column: Measured results by fiber optic probe hydrophone, Right column: Simulated results of the equivalent reflector model (solid line) and the AC model (dashed line).
FIG. 6.
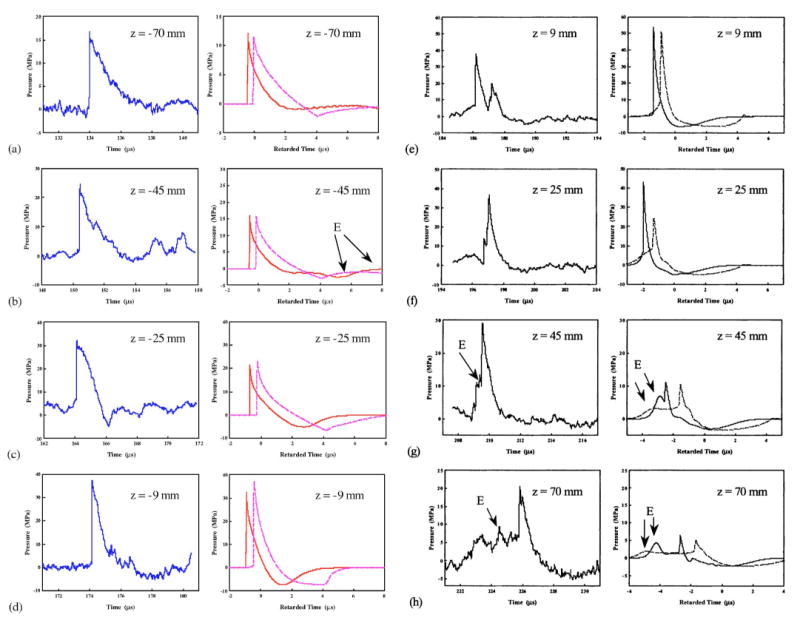
The pressure wave forms of Dornier HM-3 at 20 kV along the lithotripter axis at (a) z=−70 mm, (b) z=−45 mm, (c) z=−25 mm, (d) z=−9 mm, (e) z=9 mm, (f) z=25 mm, (g) z=45 mm, and (h) z=70 mm. Left column: Measured results by FOPH. Right column: simulated results of the equivalent reflector model (solid line) and the AC model (dash line). E: the edge wave.
It is interesting to note that the pressure distributions predicted by the two models are quite similar, although the locations of the maximum and minimum pressures are different (Fig. 7). Using the AC model, the maximum and minimum pressures occur at 4 and −12 mm, respectively, while the corresponding values are 12 and −7 mm for the equivalent reflector model. There is a discrepancy of the location of maximum peak negative pressure between the measurement and the simulation, and the reason is unknown. When the new reflector insert was used, this discrepancy became much smaller [Fig. 3(c)].
FIG. 7.
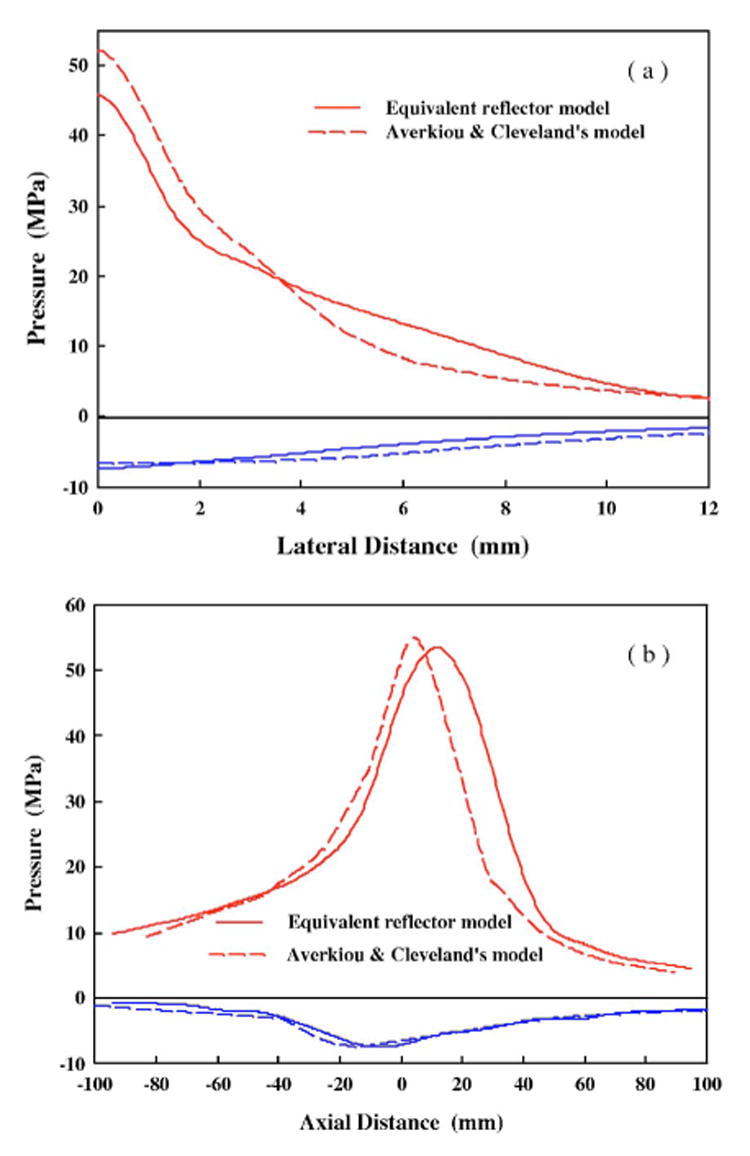
The simulated peak pressure distributions (a) transverse to and (b) along the lithotripter axis. The solid lines are the results of the equivalent reflector model and the dashed ones are those of the AC model.
2. Comparison between the model simulation and measured pressure wave forms produced by the original and upgraded HM-3 reflectors
Although in general the simulated wave forms predicted by the equivalent reflector model show a good agreement with the measurement results, especially with respect to the characteristics of the evolution of wave components, there are also some noticeable discrepancies. First, the double-peak structure in the leading compressive wave due to the lateral truncation on the original HM-3 reflector aperture is not predicted because of axisymmetric assumption in the source condition. Second, the −6 dB beam width predicted by the theoretical models (5.2 and 5.4 mm by the AC and the equivalent reflector model, respectively, see Fig. 7) is much smaller than the measured results (see Table I). Hence, away from F2 the peak pressure of the simulated wave form is always lower than the corresponding value in the measured wave form (Figs. 5 and 6). Third, multiple local maxima of p+ along the lithotripter axis [such as between z=−40 and 40 mm in Fig. 3(c)], similar to the pressure distribution in a high-intensity focused ultrasound field,31 were not predicted by the numerical models. The reason for this discrepancy is not clear.
The equivalent reflector model was also used to predict the pressure wave forms generated by the upgraded reflector both transverse to (Fig. 8) and along (Fig. 9) the lithotripter axis, and the numerical simulations are compared with the measurements. It was found that the time delay (Δt) between the leading LSW (produced by wave reflection from the insert) and the trailing second shock wave (produced by wave reflection from the uncovered bottom surface of the original reflector) increases as these two waves propagate towards the focal point. At z=−70 mm, Δt is 2.04 μs while at z=0 mm, it increases to 3.26 μs, which is close to the measurement result of 3.42±0.15 μs. In addition, Δt also increases transversely from F2. At x=9 mm, the simulated Δt is 3.98 μs, compared to 4.07 μs from the measurement [see Fig. 8(d)]. At this location the leading LSW splits into two peaks as shown previously for the original reflector [Fig. 5(d)]. At z=25 mm the edge wave begins to separate from the central wave of the leading LSW, and subsequently the rise time of shock front becomes larger [Fig. 9(f)]. However, because the diffraction wave was generated much earlier from the uncovered bottom of original HM-3 reflector, the second shock wave maintains a steep shock front even at a long distance from F2 [see Fig. 9(f)–9(h)]. Overall, the characteristics of different wave components and their evolutions in the lithotripter field could be clearly predicted by the equivalent reflector model and were found to match well with the measured pressure wave forms. Despite these similarities, a clear difference can be observed in the shape of the second pulse. In a large area within the focal region, the second pulse in the measured wave form looks more like a triangle wave rather than an exponentially decaying curve for the first pulse.
FIG. 8.
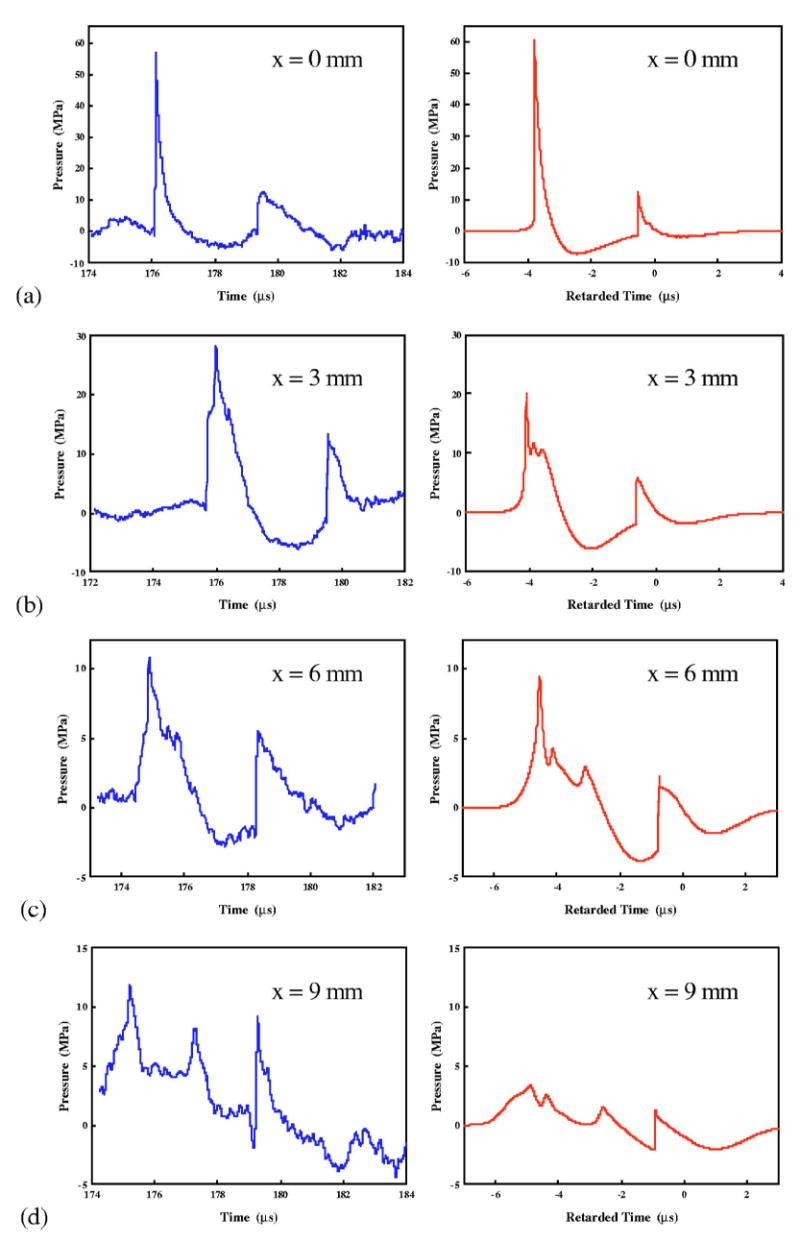
The pressure wave forms of the upgraded reflector at 22 kV transverse to the lithotripter axis in the focal plane at (a) x=0 mm, (b) x=3 mm, (c) x=6 mm, and (d) x=9 mm. Left column: Measured results by FOPH. Right column: Simulated results of the equivalent reflector model.
FIG. 9.
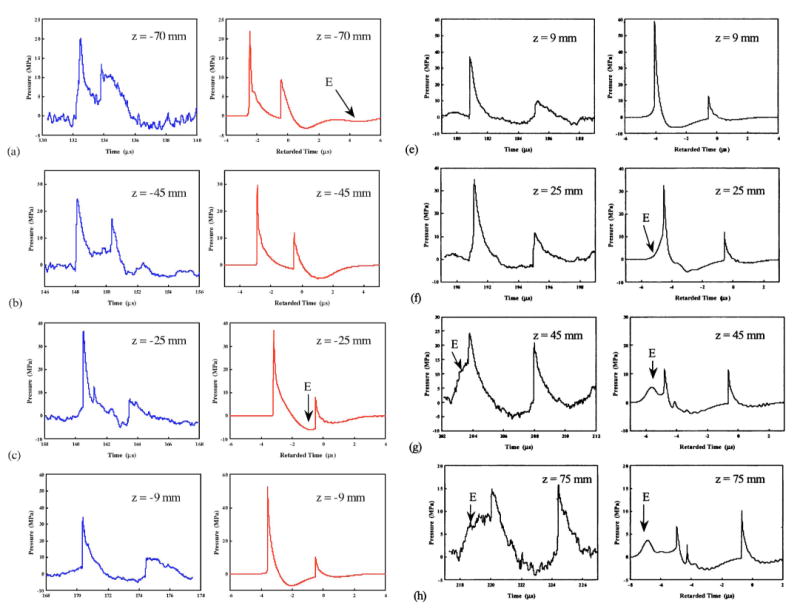
The pressure wave forms of the upgraded reflector at 22 kV along the lithotripter axis at (a) z=−70 mm, (b) z=−45 mm, (c) z=−25 mm, (d) z= −9 mm, (e) z=9 mm, (f) z=25 mm, (g) z=45 mm, and (h) z=70 mm. Left column: Measured results by FOPH. Right column: Simulated results of the equivalent reflector model. E: the edge wave.
As shown in Fig. 10, the −6 dB beam size of the second shock wave (244×9.6 mm) was found to be much larger than that of the leading LSW (59×5.6 mm). Hence, at locations either far beyond (z>40 mm) or away (x>10 mm) from F2, the amplitude of the second shock wave could be comparable or even larger than that of the leading LSW, which is in agreement with the measurements [Fig. 8(d), Figs. 9(g) and 9(h)]. The broad coverage of the second shock wave ensures the effectiveness of suppressing intraluminal bubble expansion for reduced tissue injury in the whole lithotripter field.4,13
FIG. 10.
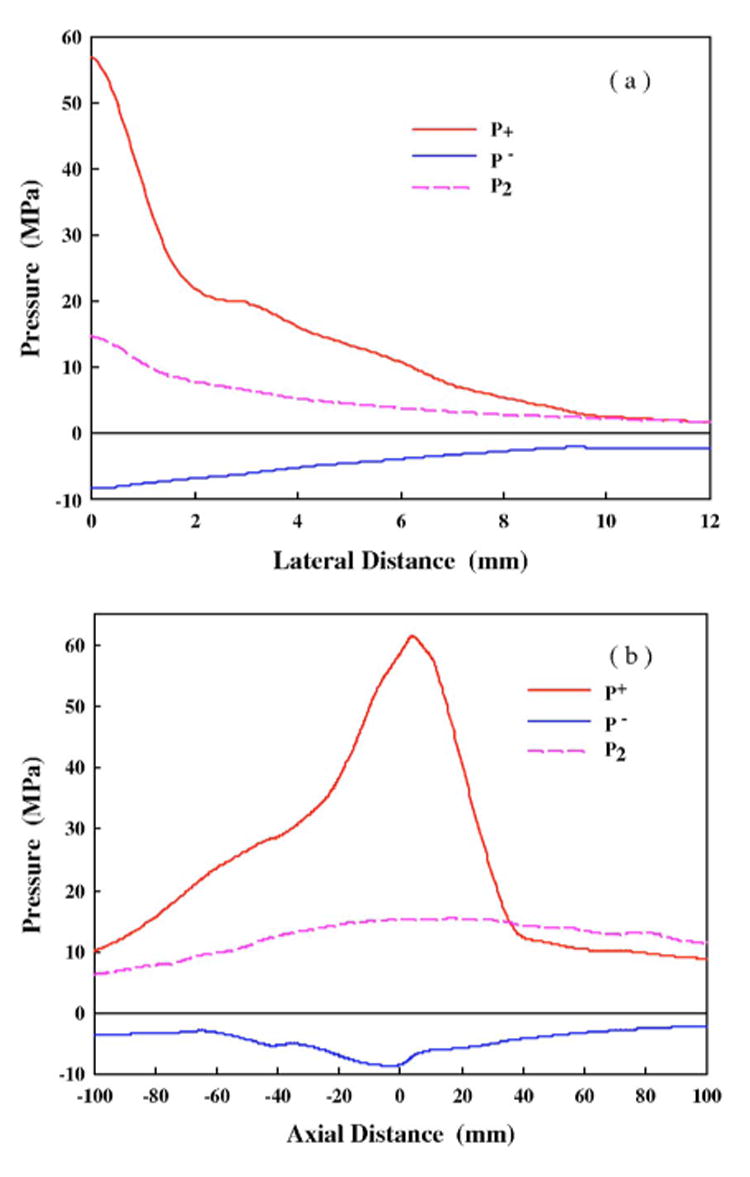
The simulated peak pressure distributions (a) transverse to and (b) along the lithotripter axis by the equivalent reflector model.
D. Effect of reflector geometry on bubble dynamics
The equivalent reflector model can be used to calculate the pressure wave forms produced by the upgraded reflectors of different geometries, and then the results can be input to the Gilmore model to evaluate the ensuing bubble dynamics. Using this approach, two series of numerical simulations have been carried out first at F2 to evaluate its feasibility. One is to change the semi-major axis of the inner reflector surface (a′) and thus varying the interpulse delay time (Δt=2[(a−a′) −(c−c′)] /c0).12 The other is to change the extension distance from the lower edge of the reflector insert to the first focal plane, dT.13 In both cases, c′ of the reflector insert remained the same. It was found that when Δt is larger than 2 μs, the leading LSW and the second shock wave are distinctively separated from each other, as shown in Fig. 11(a) for a′=130.25 mm with Δt=5.2 μs. However, when Δt is smaller than 2 μs, the profile of the second shock wave will be affected by the leading LSW during the propagation. For example, the second pulse begins to enlarge its duration and flatten its profile at a′=133.6 mm and Δt=1.85 μs [Fig. 11(b)]. The two waves start to merge at a′=134.25 mm and Δt=1.66 μs [Fig. 11(c)]. At a′=134.38 mm, the second pulse disappears and merges with the tensile component of the leading LSW, leading to a sudden decrease of the peak negative pressure (i.e., p−=−4.9 MPa). The measured pressure wave form from one of these reflector inserts, a′=134.5 mm, has confirmed the merge of the two shock waves experimentally [dotted line in Fig. 11(d)]. At even shorter Δt, the second shock wave will move even closer to the leading LSW and further enhance the peak positive pressure of the pressure wave form, for example, p+=68.4 MPa for a′=135.13 mm. Subsequently, the induced bubble dynamics may be similar to or even stronger than that produced by the original HM-3 reflector, i.e., Rmax=0.615 and 0.69 mm at 20 and 22 kV, respectively. Furthermore, the strongest suppression effect on bubble expansion was found to occur at a′=132.8 mm, which is close to our previous design.13
FIG. 11.
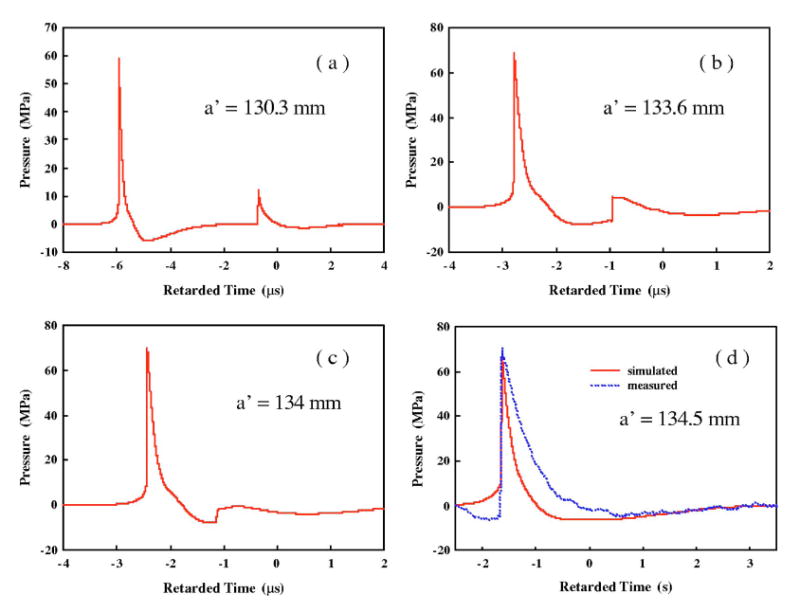
The simulated wave forms at F2 produced by different geometries of reflector insert with half focal length c′=111.5 mm and semi-major axis, a′, of (a) 130.3, (b) 133.6, (c) 134, and (d) 134.5 mm. A measured wave form is shown as dotted curve.
The truncation of the reflector insert begins to affect the maximum bubble expansion when dT is larger than 1 mm [Fig. 12(b)]. However, if dT is larger than 4 mm Rmax will also increase. With the increase of dT from −4 to 10 mm the amplitude of the second pulse will increase almost linearly from 10.3 to 15.5 MPa. Meanwhile the first compressive wave is initially consistent within the range of dT=−4 to 4 mm, then decreases from 60.2 to 57.8 at dT =10 mm. However, the variation of the peak negative pressure is much smaller, only 0.2 MPa. In addition, the interpulse delay time appears to decrease from 3.39 to 3.16 μs within the range. At dT =−4 mm p+ for the leading LSW, second shock wave and Δt are 59.4 MPa, 10.3 MPa, and 3.39 μs, respectively. The corresponding values at dT=10 mm are 57.8 MPa, 15.5 MPa, and 3.16 μs. The minimum Rmax occurs at around dT=4 mm, which is similar to the value used in our previous study.13 Altogether, it is shown that the equivalent reflector model can be a useful tool for design optimization of the HM-3 reflector.
FIG. 12.
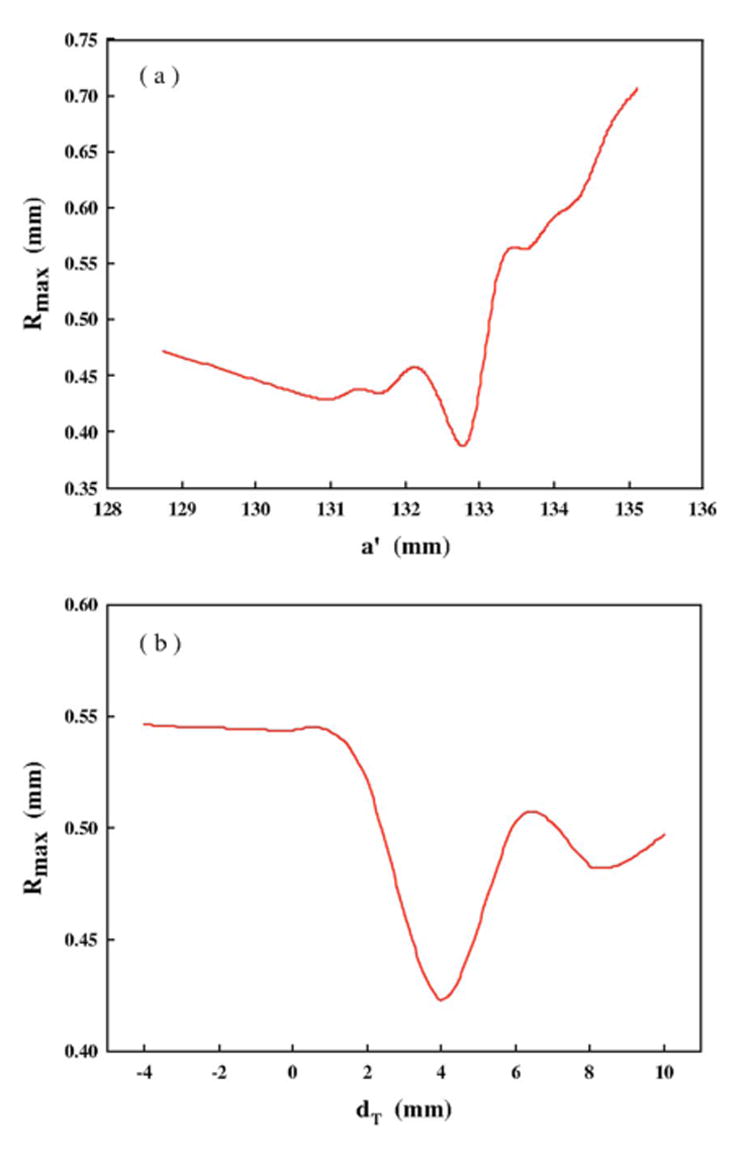
The maximum bubble size, Rmax, in accordance with the simulated pressure wave form with varying (a) semi-major axis a′ (c′=111.5 mm and the lower edge of the reflector insert is 4 mm above the first focal plane) and (b) the extension of the lower edge of the reflector insert to the first focal plane (a′=132.5 mm and c′=111.5 mm) calculated by the Gilmore model.
IV. DISCUSSION
In this study, an equivalent reflector model was developed and applied to model the acoustic field of an HM-3 lithotripter with either the original or the upgraded reflector. The simulated wave forms show a good agreement with the measurements by FOPH and illustrate the primary features of the LSW captured by the model, especially the evolution of three wave components (the central wave, the edge wave, and the wake) in the lithotripter field. The delay time between the edge wave and the central wave simulated by the equivalent reflector model matches better with the measured value than that predicted by the AC model. In addition, the LSW simulated by the equivalent reflector model has a longer retarded time. These differences and improvements are due to the consideration of shock wave propagation inside the ellipsoidal reflector. In particular, the equivalent spherical reflector is 2a/(c+14 mm)=2.16 times as large as that used in the AC model at the aperture of the HM-3 reflector. In the lithotripter field, such as z=50 mm and x=10 mm, the normalized σ and ρ in the AC model [Eq. (4)] are 1.39 and 0.129, respectively. In comparison, the corresponding values in the equivalent reflector model are 1.21 and 0.07, respectively, which means that the locations are relatively closer to the lithotripter focus. Therefore, the predicted edge wave is closer to the central wave and the shock front could be kept even far away from the focal point using the equivalent reflector model.
The double-pulse structure from the upgraded reflector can also be predicted in the simulation. It is interesting to find that when Δt is smaller than 1.5 μs, the two shock waves will merge together, which has been confirmed by pressure measurements. The fundamental mechanism of acoustic wave propagation is the compression and extension of the elastic media to transfer the acoustic energy. It is also noticed that the interpulse delay time increases when propagating toward the focal point of lithotripter (Fig. 9). So if two pulses with finite amplitudes are initially close to each other, the wave-wave interaction may cause the media to vibrate in phase, rather than acting as two independent sources. Subsequently, they may not separate even at F2.32 Altogether, it is found that the in situ pulse superposition technique is not simply adding two individual wave forms together as predicted by the linear model.
Although the equivalent reflector model can be used successfully to simulate the acoustic wave form in the lithotripter field, there are still some limitations in the numerical solution. First, the KZK equation is only valid for a moderately focusing gain (less than 20).17 Although a simplified method of introducing a coordinate transformation in the frequency domain33 was used in our calculation to increase the upper limit of the focusing gain, some artificial oscillations and additional peaks were still found far away from the focal point [Figs. 5(d), 6(g), 6(h), 8(c), 8(d), 9(g), and 9(h)]. Second, the KZK equation is actually a 1.5 D model, assuming axis-symmetric source distribution for initial conditions. Therefore, more complicated reflector structure, such as the lateral truncation of the HM-3 reflector, cannot be considered. Currently three-dimensional modeling in computational fluid dynamics is becoming a valuable method for gaining deeper insight into dynamics of lithotripters, such as using a wave propagation approach and finite volume method for hyperbolic partial differential equations20 and using a Weighted Essentially Non-Oscillatory fifth-order shock capturing scheme for accurate representation of shock wave propagation.18,19 Even assuming reflector with two-dimensional symmetry and running on terascale machine, the computation time is still very long.21 Overall, further development and improvements in the theoretical model and numerical simulation are still needed.
The measured pressure field of the HM-3 lithotripter revealed a much larger −6 dB beam size than the theoretical predictions. Truncation on the lateral side of the HM-3 reflector leads to asymmetric pressure distribution, enlarged beam width, and appearance of distinct side lobes. Using a new single-unit reflector insert, the −6 dB beam size becomes smaller and pressure distribution in the focal plane appears axisymmetric. In addition, because of the spark-induced erosion, gap between the electrode tips widens with increased number of shocks delivered. Consequently the ensuing spark discharges may not always occur exactly at F1. Using ray tracing method, it has been shown that the departure of only 1 mm laterally from F1 could cause a significant shift of ∼10 mm at F2.34 The electromagnetic lithotripters, which have similar F number as HM-3 but much more stable shock wave source, have much smaller beam sizes than HM-3.28 Therefore, the unstable location of the spark discharge may be another important contributing factor for the larger beam size of the HM-3 lithotripter.
Coupling the pressure wave form predicted by the equivalent reflector model with the Gilmore model can be used to estimate the corresponding bubble dynamics. The reflector geometry changes the peak pressure, interpulse delay time, and the subsequent bubble dynamics, simultaneously. The bubble dynamics are sensitive to the pressure wave form. In this preliminary study, the optimal a′ and dT were found in a small range (a′=132−133.2 mm and dT=3−5 mm) for achieving the maximum suppression effect on bubble expansion at F2. Although there are limitations in this feasibility study, such as a′ and dT were evaluated independently and no relaxation phenomenon was included in the wave propagation model,24 the equivalent reflector model was found to be a useful tool for predicting the LSW wave form generated by different reflector geometries. It should also be noticed that in this preliminary study only the bubble dynamics at F2 in response to the LSW produced by different geometries of reflector insert were investigated. In clinical lithotripsy, shock wave-induced renal injury occurs in an extended volume surrounding the focal point.5 To fully optimize the reflector geometry, the bubble dynamics in the whole lithotripter field needs to be evaluated. Although theoretically feasible, such a numerical study is beyond the scope of current study. Overall, using numerical models such as the one described in this study, better design of the reflector geometry may be determined expeditiously to improve the performance and safety of clinical lithotripters.
Acknowledgments
This work is supported in part by NIH through Grant No. RO1-DK52985. The authors are grateful to Dr. Robin O. Cleveland for discussion of the KZK model and algorithm. The authors also acknowledge Dr. Andrew Szeri and Jonathan Iloreta for reading the manuscript and providing valuable comments.
References
- 1.Chaussy C, Fuchs GJ. Current state and future developments of noninvasive treatment of human urinary stones with extracorporeal shock wave lithotripsy. J Urol (Baltimore) 1989;141:782–792. doi: 10.1016/s0022-5347(17)41010-x. [DOI] [PubMed] [Google Scholar]
- 2.Kerbl K, Rehman J, Landman J, Lee D, Sundaram C, Clayman RV. Current management of urolithiasis: Progress or regress? J Endourol. 2002;16:281–288. doi: 10.1089/089277902760102758. [DOI] [PubMed] [Google Scholar]
- 3.Lingman JE. Extracorporeal shock wave lithotripsy—Development, instrumentation, and current status. Urol Clin North Am. 1997;24:185–211. doi: 10.1016/s0094-0143(05)70363-3. [DOI] [PubMed] [Google Scholar]
- 4.Zhou YF, Cocks FH, Preminger GM, Zhong P. Innovations in shock wave lithotripsy technology: Updates in experimental studies. J Urol (Baltimore) 2004;172:1892–1898. doi: 10.1097/01.ju.0000142827.41910.a2. [DOI] [PubMed] [Google Scholar]
- 5.Delius M. Medical applications and bioeffects of extracorporeal shock waves. Shock Waves. 1994;4:55–72. [Google Scholar]
- 6.Evan AP, McAteer JA. Q-effects of shock wave lithotripsy. In: Coe FL, et al., editors. Kidney Stones Medical and Surgerical Management. Lippincott-Raven; Philadephia: 1996. pp. 549–570. [Google Scholar]
- 7.Sarica K, Balat A, Erbagci A, Cekmen M, Yurekli M, Yagci F. Effects of shock wave lithotripsy on plasma and urinary levels of nitrite and adrenomedullin. Urol Res. 2003;31:347–351. doi: 10.1007/s00240-003-0351-0. [DOI] [PubMed] [Google Scholar]
- 8.Graber SF, Danuser H, Hochreiter WW, Studer UE. A prospective randomized trial comparing 2 lithotriptors for stone disintegration and induced renal trauma. J Urol (Baltimore) 2003;169:54–57. doi: 10.1016/S0022-5347(05)64033-5. [DOI] [PubMed] [Google Scholar]
- 9.Gerber R, Studer UE, Danuser H. Is newer always better? A comparative study of 3 lithotriptor generations. J Urol (Baltimore) 2005;173:2013–2016. doi: 10.1097/01.ju.0000158042.41319.c4. [DOI] [PubMed] [Google Scholar]
- 10.Xi XF, Zhong P. Improvement of stone fragmentation during shock wave lithotripsy using a combined EH/PEAA shock wave generator - In vitro experiments. Ultrasound Med Biol. 2000;26:457–467. doi: 10.1016/s0301-5629(99)00124-6. [DOI] [PubMed] [Google Scholar]
- 11.Sokolov DL, Bailey MR, Crum LA. Use of dual-pulse lithotripter to generate a localized and intensified cavitation field. J Acoust Soc Am. 2001;110:1685–1695. doi: 10.1121/1.1394221. [DOI] [PubMed] [Google Scholar]
- 12.Zhong P, Zhou YF. Suppression of large intraluminal bubble expansion in shock wave lithotripsy without compromising stone comminution: Methodology and in vitro experiments. J Acoust Soc Am. 2001;110:3282–3291. doi: 10.1121/1.1416906. [DOI] [PubMed] [Google Scholar]
- 13.Zhou YF, Zhong P. Suppression of large intraluminal bubble expansion in shock wave lithotripsy without compromising stone comminution: Refinement of reflector geometry. J Acoust Soc Am. 2003;113:586–597. doi: 10.1121/1.1528174. [DOI] [PubMed] [Google Scholar]
- 14.Hamilton MF. Transient axial solution for the reflection of a spherical wave from a concave ellipsoidal mirror. J Acoust Soc Am. 1993;106:102–112. [Google Scholar]
- 15.Coleman AJ, Choi MJ, Saunders JE. Theoretical predictions of the acoustic pressure generated by a shock wave lithotripter. Ultrasound Med Biol. 1991;17:245–255. doi: 10.1016/0301-5629(91)90046-y. [DOI] [PubMed] [Google Scholar]
- 16.Christopher T. Modeling the Dornier HM-3 lithotripter. J Acoust Soc Am. 1994;96:3088–3095. doi: 10.1121/1.411245. [DOI] [PubMed] [Google Scholar]
- 17.Averkiou MA, Cleveland RO. Modeling of an electrohydraulic lithotripter with the KZK equation. J Acoust Soc Am. 1999;106:102–112. doi: 10.1121/1.427039. [DOI] [PubMed] [Google Scholar]
- 18.Tanguay M, Colonius T. Numerical simulation of bubble cavitation flow in shock wave lithotripsy; Fourth International Symposium on Cavitation, CAV2001; Pasadena. 2001. [Google Scholar]
- 19.Tanguay M, Colonius T. Progress in modeling and simulation of shock wave lithotripsy (SWL); Fifth International Symposium on Cavitation, CAV2003; Osaka, Japan. 2003. [Google Scholar]
- 20.Szeri AJ. Numerical modeling of shock wave focusing and bubble dynamics in an elastic tube. (private communication)
- 21.Iloreta JI, Szeri AJ, Zhou YF, Zhong P. Wave propagation and shock formation in a shock wave lithotripter. Phys Fluids. doi: 10.1063/1.2760279. (submitted) [DOI] [PMC free article] [PubMed] [Google Scholar]
- 22.Zhong P, Zhou YF, Zhu SL. Dynamics of bubble oscillation in constrained media and mechanisms of vessel rupture in SWL. Ultrasound Med Biol. 2001;27:119–134. doi: 10.1016/s0301-5629(00)00322-7. [DOI] [PubMed] [Google Scholar]
- 23.Lee YS, Hamilton MF. Time-domain modeling of pulsed finite-amplitude sound beams. J Acoust Soc Am. 1995;97:906–917. [Google Scholar]
- 24.Cleveland RO, Hamilton MF, Blackstock DT. Time-domain modeling of finite-amplitude sound in relaxing fluids. J Acoust Soc Am. 1996;99:3312–3318. [Google Scholar]
- 25.Church CC. A theoretical study of cavitation generated by an extracor-poreal shock wave lithotripter. J Acoust Soc Am. 1989;86:215–227. doi: 10.1121/1.398328. [DOI] [PubMed] [Google Scholar]
- 26.Zhu SL, Zhong P. Shock wave-inertial microbubble interaction: A theoretical study based on the Gilmore formulation for bubble dynamics. J Acoust Soc Am. 1999;106:3024–3033. doi: 10.1121/1.428122. [DOI] [PubMed] [Google Scholar]
- 27.Cole RH. Underwater Explosions. Princeton University Press; Princeton: 1948. [Google Scholar]
- 28.Coleman AJ, Saunders JE. A survey of the acoustic output of commercial extracorporeal shock wave lithotripters. J Acoust Soc Am. 1989;15:213–227. doi: 10.1016/0301-5629(89)90066-5. [DOI] [PubMed] [Google Scholar]
- 29.Cle veland RO, Lifshitz DA, Connors BA, Evan AP, Willis LR, Crum LA. In vivo pressure measurements of lithotripsy shock waves in pigs. Ultrasound Med Biol. 1998;24:293–306. doi: 10.1016/s0301-5629(97)00270-6. [DOI] [PubMed] [Google Scholar]
- 30.Bailey MR, Blackstock DT, Cleveland RO, Crum LA. Comparison of electrohydraulic lithotripters with rigid and pressure-release ellipsoidal reflectors. II. Cavitation fields. J Acoust Soc Am. 1999;106:1149–1160. doi: 10.1121/1.427123. [DOI] [PubMed] [Google Scholar]
- 31.Baker AC. Nonlinear pressure fields due to focused circular apertures. J Acoust Soc Am. 1992;91:713–717. [Google Scholar]
- 32.Lighthill J. Waves in fluids. Cambridge University Press; Cambridge: 1980. [Google Scholar]
- 33.Hart TS, Hamilton MF. Nonlinear effects in focused sound beams. J Acoust Soc Am. 1988;84:1488–1496. [Google Scholar]
- 34.Sturtevant B. Shock wave physics of lithotriptors. In: Smith AD, et al., editors. Smith's Textbook of Endourology. Quality Medical; St Louis: 1996. pp. 529–552. [Google Scholar]


