Abstract
Under particular circumstances like lactation and fasting, the blood-borne monocarboxylates acetoacetate, β-hydroxybutyrate, and lactate represent significant energy substrates for the brain. Their utilization is dependent on a transport system present on both endothelial cells forming the blood-brain barrier and on intraparenchymal brain cells. Recently, two monocarboxylate transporters, MCT1 and MCT2, have been cloned. We report here the characterization by Northern blot analysis and by in situ hybridization of the expression of MCT1 and MCT2 mRNAs in the mouse brain. In adults, both transporter mRNAs are highly expressed in the cortex, the hippocampus and the cerebellum. During development, a peak in the expression of both transporters occurs around postnatal day 15, declining rapidly by 30 days at levels observed in adults. Double-labeling experiments reveal that the expression of MCT1 mRNA in endothelial cells is highest at postnatal day 15 and is not detectable at adult stages. These results support the notion that monocarboxylates are important energy substrates for the brain at early postnatal stages and are consistent with the sharp decrease in blood-borne monocarboxylate utilization after weaning. In addition, the observation of a sustained intraparenchymal expression of monocarboxylate transporter mRNAs in adults, in face of the seemingly complete disappearance of their expression on endothelial cells, reinforces the view that an intercellular exchange of lactate occurs within the adult brain.
Glucose is the major, if not exclusive, energy substrate for the brain (1). Under certain situations, other substrates can contribute significantly to brain energy demands. Thus, immediately after birth, lactate present in high amounts in the blood following delivery provides an important source of energy for the brain in the presuckling period (2, 3). In addition, acetoacetate and β-hydroxybutyrate, two ketone bodies formed by the hepatic oxidation of fat contained in maternal milk, are also significant energy substrates for the brain during the preweaning period (4, 5). These energy substrates however do not cross the blood-brain barrier easily, and require a transport system to reach the brain parenchyma. Such a transport system that has been demonstrated by uptake studies with tracers across the blood-brain barrier during lactation is shared by lactate, pyruvate, and the ketone bodies (6, 7).
Recently, two transporters for monocarboxylates have been cloned and their distribution in various tissues, organs, and cell types has been described (8–10). These reports made limited mention about their presence in the central nervous system, despite evidence from functional studies for the presence of a lactate transport system in different brain cell types or in tissue slices (11–14). More recently, two reports have appeared, describing the presence of monocarboxylate transporters (MCT) mRNAs by Northern blot analysis (15) as well as the MCT1 protein (16) in the central nervous system. In this article, we provide an extensive characterization of the regional distribution of both MCT1 and MCT2 mRNAs by in situ hybridization and of their level of expression during development in the mouse brain. The results obtained support previous evidence for a developmentally regulated monocarboxylate transport across the blood-brain barrier in preweaning animals. Parts of this work have been presented under abstract form (17).
MATERIALS AND METHODS
Cloning of cDNA Fragments for Mouse Monocarboxylate Transporters MCT1 and MCT2.
The MCT1 and MCT2 cDNA fragments were obtained by reverse transcription and PCR amplification of poly(A)+ mRNA isolated from primary cultures of mouse cortical neurons and mouse liver, respectively. The set of primers used for MCT1 was 5′-CAAGTGGATCAGACCTCGG-3′ and 5′-GGAGCTATTCTGCTGCG-3′ located at 1,128–1,635 bp in the coding region of the hamster MCT1 cDNA sequence (8, 9). For MCT2, the set of primers used was 5′-GATGGCTTTTGTTGATATG-3′ and 5′-CTCTTTCTCTGTCTGAGGG-3′ located at 979–1,559 bp in the coding region of the hamster MCT2 cDNA sequence (10). The reverse transcription–PCR fragments were subcloned in pT7Blue(R) vector (Novagen). The identity of the amplified MCT1 and MCT2 cDNA fragments was confirmed by sequencing using an automated DNA sequencer (Automated Laser Fluorescent DNA analysis system, Pharmacia). The amplified MCT1 cDNA fragment shares 89% nucleotide identity with the hamster MCT1 cDNA sequence (8, 9) and was later found to be identical to the mouse MCT1 cDNA sequence (18). The amplified MCT2 cDNA fragment was shown to share 84% nucleotide identity with the hamster MCT2 cDNA sequence (10).
Northern Blot Analysis.
Total RNA was extracted by using the CsCl centrifugation procedure as described by Chirgwin et al. (19). Poly(A)+ RNA was obtained by passing total RNA through an oligo(dT)-cellulose spin column (Pharmacia). Total RNA (20 μg) or 4 μg of poly(A)+ RNA were electrophoresed on a denaturing 1.2% agarose gel containing 2 M formaldehyde, and were transferred onto nylon membrane (Gene Screen, DuPont/NEN). Hybridization was performed for 16–18 h at 65°C in 50% formamide, 5× standard saline citrate (SSC; 1× SSC = 0.15 M sodium chloride/0.015 M sodium citrate, pH 7.0), 50 mM Tris⋅HCl, pH 7.5, 0.1% sodium pyrophosphate, 1% SDS, 0.2% polyvinylpyrrolidone, 0.2% Ficoll (Pharmacia), 5 mM EDTA, 0.2% BSA, and 150 μg/ml sheared denatured salmon sperm DNA, which contained a 32P-MCT1 or MCT2 riboprobe. Filters were then washed under high-stringency conditions (twice with 2× SSC/0.1% SDS at 65°C for 15 min and once with 0.1× SSC/0.1% SDS at 65°C for 15 min), and apposed to Kodak AR film at −70°C with an intensifying screen. Differences in RNA gel loading and blotting were assessed by rehybridizing the filters with a 32P-antisense actin riboprobe. Hybridization and washing conditions for actin were identical to those for MCT1 and MCT2.
In Situ Hybridization.
Experiments were performed as reported (20). Plasmids containing MCT1 or MCT2 cDNA fragments inserted in the pT7Blue(R) vector in both orientations were linearized with either BamHI (MCT1) or EcoRI (MCT2). Digoxigenin (DIG)-labeled antisense- or sense-strand RNA probes were prepared by in vitro transcription with T7-RNA polymerase (Boehringer Mannheim). Sections were incubated overnight at 58°C in the prehybridization buffer containing 200 ng/ml of sense or antisense DIG-labeled RNA probe. At the end of the incubation period, sections were washed successively in 2× SSC for 30 min at room temperature followed by 1 h at 65°C and finally in 0.1× SSC for 1 h at 65°C. Immunodetection of the hybridized probe was performed by using a DIG Nucleic Acid Detection kit (Boehringer Mannheim) according to the manufacturer’s instructions. Controls with sense-strand RNA probes were performed for each fragment and found to give no labeling (data not shown).
In Situ Hybridization Combined with Histochemistry.
Following in situ hybridization, sections were rehydrated in PBS for 5 min. To reveal histochemically endothelial cells, sections were then incubated overnight in presence of Griffonia simplicifolia lectin coupled to horseradish peroxidase (12.5 μg/ml in 0.1 M Tris/0.9% saline/1% Triton X-100). Sections were incubated in 0.05% diaminobenzidine for 10 min and revealed in 0.05% diaminobenzidine/0.003% H2O2 for 5 min. Finally, sections were rinsed 5 min in PBS and rapidly dried.
RESULTS
Expression of MCT1 and MCT2 mRNAs in Various Mouse Brain Regions.
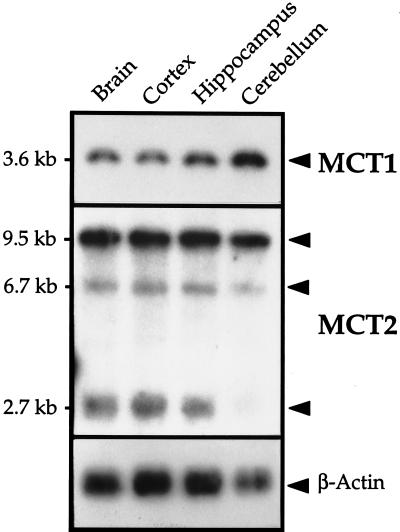
Northern blot analysis revealed the expression of both MCT1 and MCT2 mRNAs in whole brain preparations, as well as in the cerebral cortex, the hippocampus and the cerebellum (Fig. 1). MCT1 mRNA was detected as a single transcript of 3.6 kb, a size identical to the one reported in both rat and hamster tissues (8). MCT1 mRNA was more abundant in the cerebellum than in the other regions. For MCT2, three transcripts of 9.5, 6.7, and 2.7 kb were observed in comparable amounts in all three regions except in the cerebellum where the 2.7-kb transcript is less abundant. The 9.5-kb transcript was by far the most abundant, in accordance with what was observed in whole brain preparations.
Figure 1.
Northern blot analysis of MCT1 and MCT2 expression in whole mouse brain and in three specific brain regions. Northern blot analysis was performed as described in Materials and Methods. Twenty micrograms of total RNA were extracted from the whole brain as well as from cortex, hippocampus, and cerebellum, electrophoresed, and hybridized with an antisense 32P-MCT1 or MCT2-riboprobe. Exposure time was 1 day for MCT1 and 3 days for MCT2.
Distribution of MCT1 and MCT2 mRNAs in the Brain by in Situ Hybridization.
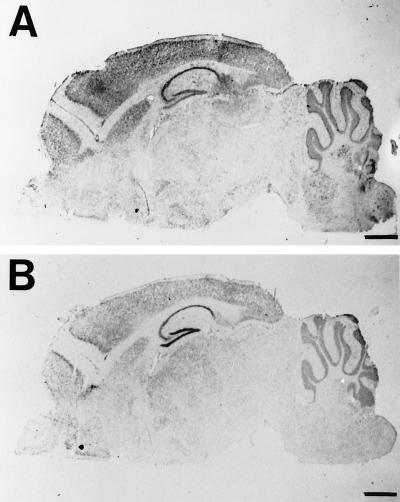
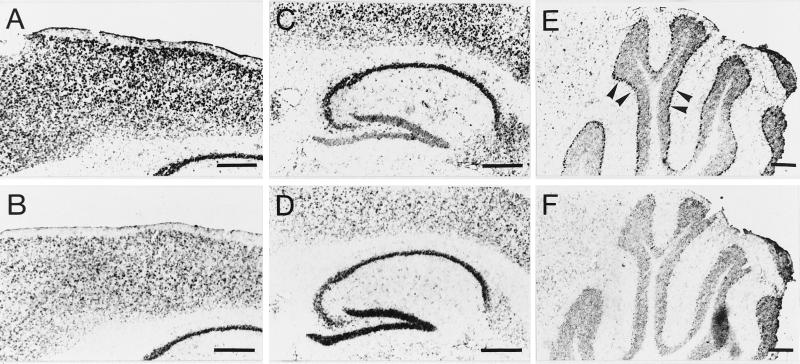
To further characterize the regional distribution of MCT1 and MCT2 mRNAs in the brain, we applied DIG-labeled riboprobes to sagittal cryostat sections from mouse brain. The regional distribution observed was in agreement with results obtained by Northern blot analysis. The expression of both MCT1 and MCT2 mRNAs was intense throughout the neocortex, in the hippocampus as well as in the cerebellum (Fig. 2 A and B, respectively). Expression in the striatum was also high both for MCT1 and MCT2 mRNAs. As a rule, the overall expression of MCT1 mRNA was much more abundant than that of MCT2 mRNA. Observations made at a higher magnification revealed several interesting features. In the cortex (Fig. 3 A and B), layer I was virtually devoid of labeling both for MCT1 and MCT2 mRNAs. For MCT1, a large number of strongly labeled cells were found in layers II-III while moderately labeled cells were present in the rest of the cortical thickness. In the case of MCT2, moderately labeled cells were present throughout the cortex with some strongly labeled cells observed in the deeper layers. Very strong labeling was found in the hippocampus with both MCT1 and MCT2 probes mainly in association with the pyramidal cell layer of the CA1-CA4 region and the granule cells of the dentate gyrus (Fig. 3 C and D). A complementary labeling was observed in the hippocampus with strong staining in the CA1-CA4 area and less in the dentate gyrus in the case of MCT1 while the opposite was observed for MCT2 mRNA. Outside the pyramidal cell and the granule cell layers, some moderately labeled cells were also found. The cerebellum presented a very distinctive staining (Fig. 3 E and F). First, the granular layer was strongly labeled with both MCT1 and MCT2 while a very low level of staining was observed in the white matter. Remarkably however, the Purkinje cell layer was heavily labeled with MCT1 while it was not at all with MCT2. This last feature points to a possible selective distribution of MCT1 and MCT2 in different cell types.
Figure 2.
Localization by in situ hybridization of MCT1 and MCT2 mRNAs in the adult mouse brain. In situ hybridization was performed as described in Materials and Methods. Sagittal sections from separate animals were hybridized with an antisense MCT1 (A) or MCT2 (B) DIG-labeled RNA probe. (Bar = 1 mm.)
Figure 3.
In situ hybridization analysis of MCT1 and MCT2 mRNA expression in the cortex, the hippocampus, and the cerebellum of adult mouse. In situ hybridization was performed as described in Materials and Methods. (A, C, E) MCT1 mRNA expression in the cortex, the hippocampus, and the cerebellum, respectively. (B, D, F) MCT2 mRNA expression in the cortex, the hippocampus, and the cerebellum, respectively. Arrows in E indicate the strongly labeled Purkinje cell layer. (Bar = 500 μm.)
Expression of MCT1 and MCT2 mRNAs during Development.
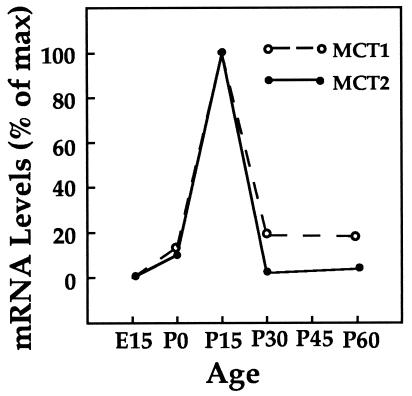
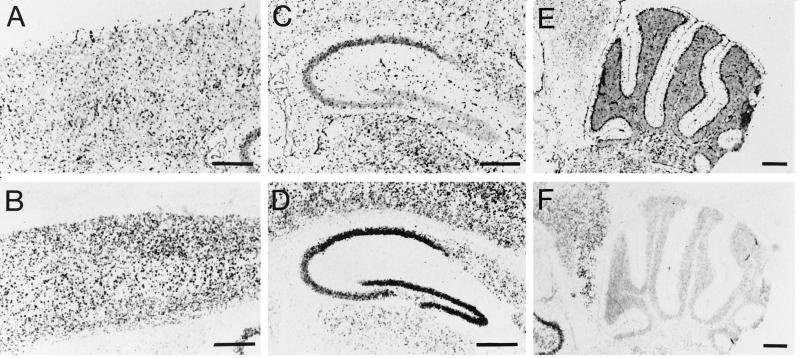
The expression of MCT1 and MCT2 mRNAs during development was characterized by Northern blot analysis. Results were quantified by scanning densitometry (BioImage, Ann Arbor, MI) and reported as a percentage of maximal expression (at postnatal day 15) after correction using the expression of the ribosomal protein L27 as control (21) (Fig. 4). A very strong increase in the expression of both MCT1 and MCT2 mRNAs at postnatal day 15 (7.4 and 10× the levels observed the day of birth, respectively) was detected, followed by a rapid decrease by postnatal day 30. The distribution of MCT1 and MCT2 mRNAs by in situ hybridization was then analyzed at postnatal day 15. In contrast to the region-specific differences observed in adults, the distribution of MCT1 mRNA at day 15 is rather ubiquitous with a stronger expression in the cerebellum and the hippocampus. In the case of MCT2 however, a more selective distribution was observed with a particularly strong labeling in the cortex, the hippocampus and the cerebellum. At high magnification, a rather uniform distribution of labeled cells was found in the cortex for both MCT1 and MCT2 (Fig. 5 A and B). In the hippocampus, labeled cells were observed not only in the pyramidal and granule cell layers but also throughout the hippocampus for MCT1 (Fig. 5C). This was not the case for MCT2 where an intense staining was restricted to the pyramidal and granule cell layers (Fig. 5D). The cerebellum presented a similar pattern of labeling when compared with the adult: for both transcripts, the granular layer was labeled while the white matter was not (Fig. 5 E and F). Similarly to the adult brain (Fig. 3 E and F), the Purkinje cell layer was heavily stained with MCT1 while not for MCT2. At the cellular level, numerous cells with an elongated shape, present only at this stage, appeared to be labeled by the MCT1 probe. Their organization and distribution throughout the section suggested that they might represent endothelial cells forming the capillaries.
Figure 4.
Levels of MCT1 and MCT2 mRNA expression during mouse brain development. Northern blot analysis of MCT1 and MCT2 mRNA expression was performed on whole brain from mice taken at various ages from embryonic (E) day 15 up to postnatal (P) day 60. The levels of mRNA expression were quantified by scanning densitometry and normalized for differences in loading relative to the levels of L27 mRNA, which was shown to remain unchanged during brain development (21). Results are reported as a percentage of maximal expression, which occurs at postnatal day 15 for both MCT1 and MCT2.
Figure 5.
In situ hybridization analysis of MCT1 and MCT2 mRNA expression in the cortex, the hippocampus and the cerebellum of mouse at postnatal day 15. In situ hybridization was performed as described in Materials and Methods. (A, C, E) MCT1 mRNA expression in the cortex, the hippocampus, and the cerebellum, respectively. (B, D, F) MCT2 mRNA expression in the cortex, the hippocampus, and the cerebellum, respectively. (Bar = 500 μm.)
Double-Labeling with MCT Riboprobes and a G. simplicifolia Lectin.
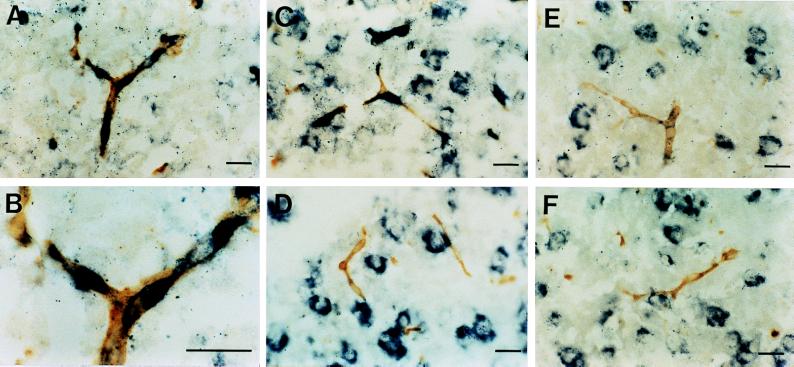
To confirm the possible expression of MCT mRNAs in endothelial cells, we performed a double-labeling experiment. Sections were first stained with DIG-labeled MCT1 or MCT2 riboprobes (Fig. 6, blue), and then with a lectin from G. simplicifolia, a well characterized marker of endothelial cells (Fig. 6, brown). The results show that at postnatal day 15, a clear colocalization was observed between the lectin staining and the expression of MCT1 mRNA (Fig. 6 A–C), but not MCT2 mRNA (Fig. 6D). In contrast, colocalization between endothelial cells and either MCT1 or MCT2 mRNA was never observed in adult sections (Fig. 6 E and F).
Figure 6.
Cellular localization of MCT1 and MCT2 mRNA expression in relation to intraparenchymal capillaries at postnatal day 15 and in adult mouse brain. Double-labeling with in situ hybridization to reveal MCT1 and MCT2 mRNA expression (blue) together with histochemistry for G. simplicifolia lectin to visualize endothelial cells (brown) was performed. (A–C) MCT1 mRNA expression colocalizing with the endothelial cell marker at postnatal day 15. B is a higher magnification of A. D shows the absence of colocalization between MCT2 mRNA expression and the endothelial cell marker at postnatal day 15. E and F illustrate the absence of colocalization between MCT1 (E) and MCT2 (F) mRNA expression and the endothelial cell marker in adult brain. (Bar = 20 μm.)
DISCUSSION
MCTs have been demonstrated in various tissues including the central nervous system (for a review, see ref. 22). Interestingly, tissues that either produce large amounts of lactate, such as skeletal muscle, or utilize lactate as an energy substrate, such as the heart, possess a lactate uptake system (23, 24) and express MCTs (9, 10, 15). In the central nervous system, monocarboxylates can cross the blood-brain barrier in young animals, a fact suggesting that brain capillary endothelial cells are likely to also express a MCT (22). This was very recently confirmed by immunocytochemistry (16). Lactate transport experiments in cultured cells have also suggested the presence of at least one MCT type on both neurons and astrocytes (12–14).
Two MCTs—MCT1 and MCT2—have been cloned and their tissue distribution determined (8–10). Western blot analysis did not reveal the presence of MCTs in these studies performed on hamster brains. Very recently, Jackson et al. (15) have reported by Northern blot analysis the expression of MCT1 mRNA in rat brain, while MCT2 expression was not detected in rat or mouse brain but was found in the hamster brain. In another study, Gerhart et al. (16) have confirmed by Western blot analysis the expression of MCT1 in rat brain. Results reported here clearly indicate the expression of both MCT1 and MCT2 mRNAs in mouse brain. The present study also reveals the presence of three transcripts for MCT2 in mouse brain. Because genomic clones for MCTs have not been isolated yet, the presence of these three transcripts awaits further clarification. One possibility is that they may arise from splicing variants, generated by different promoters and/or having different polyadenylation sites, as described for the gene encoding brain-derived neurotrophic factor (25). The physiological significance of these three transcripts is not known for the moment but because their relative abundance seems to vary from one tissue to another, their role might be tissue-specific. Very recently, a third subtype of MCT—MCT3—has been identified (26). Its expression however appears to be restricted to the retinal pigment epithelium and no expression was detected in the brain (27).
Results reported in this article provide a detailed characterization of the regional expression of the two MCTs, MCT1 and MCT2, in the central nervous system. MCT mRNAs are particularly abundant in the cerebral cortex, the hippocampus, and the cerebellum, but are also expressed in the striatum and other subcortical structures. At the cellular level, there appears to be some differences between the expression of MCT1 and MCT2 mRNAs (e.g., Purkinje cells) but further work will be needed to clearly identify the presence of these transporters on a particular cell type. We have recently obtained evidence in cultured cells for a cell-specific localization of MCTs with an enrichment of MCT1 in astrocytes and of MCT2 in neurons (28).
Temporal Correlation Between the Pattern of Developmental Expression for MCTs and Nutrient Utilization by the Brain.
Glucose is the almost exclusive energy substrate for the adult brain (1). There exist only a few situations in the adult (e.g., diabetes or prolonged starvation) where other substrates, such as ketone bodies, can provide a significant contribution to brain energy metabolism. In the developing brain however, the situation is different (reviewed in ref. 29). During the suckling period, newborn mice receive through the maternal milk a high fat-low carbohydrate diet (30). This results in the formation by the liver of ketone bodies that reach high levels in the blood. Ketone bodies provide indeed a substantial proportion of the energy substrates used by the developing brain (at least 30% of the total energy metabolism balance) (5). Another important energy substrate for the developing brain is lactate. A number of studies in vitro as well as in vivo have shown that lactate utilization is much higher than that of glucose or ketone bodies in the neonatal brain (3, 31). Both lactate and ketone bodies utilization is limited by their transport across the blood-brain barrier. In addition, transport of lactate and ketone bodies across cell membranes is operated through the same MCT. In view of the data presented here, it is then not surprising that both lactate and ketone body utilization increase dramatically during the suckling period (7–10-fold), and then decrease after weaning to reach their adult values (6, 32). Specifically, a 7-fold increase in β-hydroxybutyrate utilization has been reported between postnatal day 1 and 19 (32). This value is strikingly similar to the increase in MCT1 mRNA expression observed between postnatal day 0 and 15 (Fig. 4). Furthermore, double-labeling experiments show that endothelial cells forming the capillaries express MCT1 mRNA (but not MCT2 mRNA) during the suckling period (peak at postnatal day 15) but then the expression of MCT1 on endothelial cells sharply decreases in adults (Fig. 6). This tight correlation between substrate utilization and MCT1 level of expression can quantitatively account for the metabolic adaptations occurring in the developing brain.
Role of MCTs Within the Brain Parenchyma in the Adult.
As discussed above, permeability of the blood-brain barrier for lactate and ketone bodies decreases sharply after weaning. Thus, a tight coordination between the diet, the circulatory levels of lactate and ketone bodies, and MCT expression on capillaries appears to exist in a developmentally regulated manner. However, while their level of expression decreases compared with preweaning period (Fig. 4), both MCT1 and MCT2 mRNAs remain expressed within the adult brain parenchyma (Figs. 2 and 3). At first analysis, this observation may appear as a paradox. Why brain cells would continue to express transporters for molecules that can no longer cross easily the blood-brain barrier and be used as energy substrates? This question can be resolved if the possibility is considered that in the adult brain monocarboxylates do not originate from the circulation, but are formed within the brain parenchyma.
An array of experimental evidences has recently pointed to astrocytes as a cell type playing a critical role in the regulation of brain energy metabolism (33, 34). First, they occupy a strategic position between blood vessels and neurons. Astrocytes possess specialized processes, the end-feet, which are in close apposition on capillaries, covering a large part of their surface (35). The glucose transporter GLUT1 is expressed on the end-feet membrane facing the capillaries (36), thus indicating that astrocytes may represent an important glucose uptake site. Astrocytes have a high glycolytic activity and produce large amounts of lactate (37, 38). Glucose uptake and lactate formation by astrocytes is stimulated by a restricted set of neuroactive substances released by neurons in an activity-dependent manner, such as the excitatory neurotransmitter glutamate (39, 40). A vast set of in vitro experiments has shown that lactate is an adequate energy substrate for neurons (41–43), possibly even preferred over glucose (38, 44). In addition, lactate appears to represent an essential energy substrate for recovery of synaptic transmission after an hypoxic episode (45).
This set of observations obtained with a variety of experimental approaches has been integrated into an operational model whereby during neural activity glucose enters the brain parenchyma through glucose transporters localized at the astrocyte end-feet, is processed glycolytically by astrocytes, which then release lactate to meet the energetic demands of neurons (33, 34). Indeed lactate, after conversion to pyruvate under the action of lactate dehydrogenase (LDH), can provide 18 ATP molecules via oxidative phosphorylation. Further support to this view has been provided by the apparent selective cellular localization of LDH isoforms in the brain. Lactate dehydrogenase is composed of two distinct subunit types: the LDH1 or H (for heart) subunit and the LDH5 or M (for muscle) subunit. These two forms have slightly different kinetic properties that make them better adapted to operate in tissues that either produce large amounts of lactate (such as skeletal muscle), or consume lactate as a fuel (such as the heart). Accordingly, the LDH5 isoform is enriched in skeletal muscle while LDH1 is the predominant heart form. Using antibodies directed against each subunit type, a subpopulation of astrocytes was found to be enriched in LDH5 while neurons expressed exclusively the LDH1 form (46).
The foregoing set of considerations, taken together with results indicating the presence of MCTs in the adult brain reported here, are consistent with the proposed existence of a lactate shuttle operating between astrocytes and neurons (46).
Acknowledgments
The authors wish to thank Dr. Olivier Braissant for his advice concerning the in situ hybridization technique. This work was supported by grant 31-40565.94 from Swiss Fonds National de la Recherche Scientifique to P.J.M.
ABBREVIATIONS
- MCT
monocarboxylate transporter
- DIG
digoxigenin
- LDH
lactate dehydrogenase
References
- 1.Clarke D D, Sokoloff L. In: Basic Neurochemistry: Molecular, Cellular, and Medical Aspects. Siegel G, Agranoff B W, Albers R W, Molinoff P B, editors. New York: Raven; 1994. pp. 645–680. [Google Scholar]
- 2.Dombrowski G J, Swiatek K R, Chao K L. Neurochem Res. 1989;14:667–675. doi: 10.1007/BF00964877. [DOI] [PubMed] [Google Scholar]
- 3.Vicario C, Arizmendi C, Malloch G, Clark J B, Medina J M. J Neurochem. 1991;57:1700–1707. doi: 10.1111/j.1471-4159.1991.tb06370.x. [DOI] [PubMed] [Google Scholar]
- 4.Hawkins R A, Williamson D H, Krebs H A. Biochem J. 1971;122:13–18. doi: 10.1042/bj1220013. [DOI] [PMC free article] [PubMed] [Google Scholar]
- 5.Cremer J E. J Cereb Blood Flow Metab. 1982;2:394–407. doi: 10.1038/jcbfm.1982.45. [DOI] [PubMed] [Google Scholar]
- 6.Cremer J E, Cunningham V J, Pardridge W M, Braun L D, Oldendorf W H. J Neurochem. 1979;33:439–445. doi: 10.1111/j.1471-4159.1979.tb05173.x. [DOI] [PubMed] [Google Scholar]
- 7.Cremer J E, Teal H M, Cunningham V J. J Neurochem. 1982;39:674–677. doi: 10.1111/j.1471-4159.1982.tb07945.x. [DOI] [PubMed] [Google Scholar]
- 8.Kim C M, Goldstein J L, Brown M S. J Biol Chem. 1992;267:23113–23121. [PubMed] [Google Scholar]
- 9.Kim Garcia C, Goldstein J L, Pathak R K, Anderson R G W, Brown M S. Cell. 1994;76:865–873. doi: 10.1016/0092-8674(94)90361-1. [DOI] [PubMed] [Google Scholar]
- 10.Kim Garcia C, Brown M S, Pathak R K, Goldstein J L. J Biol Chem. 1995;270:1843–1849. doi: 10.1074/jbc.270.4.1843. [DOI] [PubMed] [Google Scholar]
- 11.Assaf H M, Ricci A J, Whittington J C, LaManna R A, Ratcheson R A, Lust W D. Metab Brain Dis. 1990;5:143–154. doi: 10.1007/BF00999841. [DOI] [PubMed] [Google Scholar]
- 12.Dringen R, Wiesinger H, Hamprecht B. Neurosci Lett. 1993;163:5–7. doi: 10.1016/0304-3940(93)90215-7. [DOI] [PubMed] [Google Scholar]
- 13.Nedergaard M, Goldman S A. Am J Physiol. 1993;265:R282–R289. doi: 10.1152/ajpregu.1993.265.2.R282. [DOI] [PubMed] [Google Scholar]
- 14.Tildon J T, McKenna M C, Stevenson J, Couto R. Neurochem Res. 1993;18:177–184. doi: 10.1007/BF01474682. [DOI] [PubMed] [Google Scholar]
- 15.Jackson V N, Price N T, Carpenter L, Halestrap A P. Biochem J. 1997;324:447–453. doi: 10.1042/bj3240447. [DOI] [PMC free article] [PubMed] [Google Scholar]
- 16.Gerhart D Z, Enerson B E, Zhdankina O Y, Leino R L, Drewes L R. Am J Physiol. 1997;273:E207–E213. doi: 10.1152/ajpendo.1997.273.1.E207. [DOI] [PubMed] [Google Scholar]
- 17.Pellegri G, Bittar P G, Martin J-L, Magistretti P J. Soc Neurosci Abstr. 1996;22:366. [Google Scholar]
- 18.Carpenter L, Poole R C, Halestrap A P. Biochem Biophys Acta. 1996;1279:157–163. doi: 10.1016/0005-2736(95)00254-5. [DOI] [PubMed] [Google Scholar]
- 19.Chirgwin J M, Przybyla A E, MacDonald R J, Rutter W J. Biochemistry. 1979;18:5294–5299. doi: 10.1021/bi00591a005. [DOI] [PubMed] [Google Scholar]
- 20.Pellegri G, Rossier C, Magistretti P J, Martin J-L. Mol Brain Res. 1996;38:191–199. doi: 10.1016/0169-328x(95)00305-c. [DOI] [PubMed] [Google Scholar]
- 21.Lebeau M C, Alvarez-Bolado G, Braissant O, Wahli W, Catsicas S. Nucleic Acids Res. 1991;19:1337. doi: 10.1093/nar/19.6.1337. [DOI] [PMC free article] [PubMed] [Google Scholar]
- 22.Poole R C, Halestrap A P. Am J Physiol. 1993;264:C761–C782. doi: 10.1152/ajpcell.1993.264.4.C761. [DOI] [PubMed] [Google Scholar]
- 23.Mann G E, Zlokovic B V, Yudilevich D L. Biochim Biophys Acta. 1985;19:241–248. doi: 10.1016/0005-2736(85)90179-8. [DOI] [PubMed] [Google Scholar]
- 24.El Abida K, Duvallet L, Thieulart L, Rieu M, Beaudry M. Acta Physiol Scand. 1992;144:469–471. doi: 10.1111/j.1748-1716.1992.tb09322.x. [DOI] [PubMed] [Google Scholar]
- 25.Timmusk T, Palm K, Metsis M, Reintam T, Paalme V, Saarma M, Persson H. Neuron. 1993;10:475–489. doi: 10.1016/0896-6273(93)90335-o. [DOI] [PubMed] [Google Scholar]
- 26.Yoon H, Fanelli A, Grollman E F, Philp N J. Biochem Biophys Res Commun. 1997;234:90–94. doi: 10.1006/bbrc.1997.6588. [DOI] [PubMed] [Google Scholar]
- 27.Philp N, Chu P, Pan T-C, Zhang R Z, Chu M-L, Stark K, Boettiger D, Yoon H, Kieber-Emmons T. Exp Cell Res. 1995;219:64–73. doi: 10.1006/excr.1995.1205. [DOI] [PubMed] [Google Scholar]
- 28.Bröer S, Rahman B, Pellegri G, Pellerin L, Martin J-L, Verleysdonk S, Hamprecht B, Magistretti P J. J Biol Chem. 1997;272:30096–30102. doi: 10.1074/jbc.272.48.30096. [DOI] [PubMed] [Google Scholar]
- 29.Nehlig A, Pereira de Vasconcelos A. Prog Neurobiol. 1993;40:163–221. doi: 10.1016/0301-0082(93)90022-k. [DOI] [PubMed] [Google Scholar]
- 30.Williamson D H, Lund P. Dev Neurosci. 1993;15:156–164. doi: 10.1159/000111331. [DOI] [PubMed] [Google Scholar]
- 31.Vannucci R C, Duffy T E. Am J Physiol. 1974;226:933–940. doi: 10.1152/ajplegacy.1974.226.4.933. [DOI] [PubMed] [Google Scholar]
- 32.Moore T J, Lione A P, Sugden M C, Regen D M. Am J Physiol. 1976;230:619–630. doi: 10.1152/ajplegacy.1976.230.3.619. [DOI] [PubMed] [Google Scholar]
- 33.Magistretti P J, Pellerin L. Cereb Cortex. 1996;6:50–61. doi: 10.1093/cercor/6.1.50. [DOI] [PubMed] [Google Scholar]
- 34.Tsacopoulos M, Magistretti P J. J Neurosci. 1996;16:877–885. doi: 10.1523/JNEUROSCI.16-03-00877.1996. [DOI] [PMC free article] [PubMed] [Google Scholar]
- 35.Peters A, Palay S L, deF. Webster H. The Fine Structure of the Nervous System. New York: Oxford Univ. Press; 1991. [Google Scholar]
- 36.Morgello S, Uson R R, Schwartz E J, Haber R S. Glia. 1995;14:43–54. doi: 10.1002/glia.440140107. [DOI] [PubMed] [Google Scholar]
- 37.Walz W, Muckerji S. Neurosci Lett. 1988;86:296–300. doi: 10.1016/0304-3940(88)90499-5. [DOI] [PubMed] [Google Scholar]
- 38.Poitry-Yamate C L, Poitry S, Tsacopoulos M. J Neurosci. 1995;15:5179–5191. doi: 10.1523/JNEUROSCI.15-07-05179.1995. [DOI] [PMC free article] [PubMed] [Google Scholar]
- 39.Yu N, Martin J-L, Stella N, Magistretti P J. Proc Natl Acad Sci USA. 1993;90:4042–4046. doi: 10.1073/pnas.90.9.4042. [DOI] [PMC free article] [PubMed] [Google Scholar]
- 40.Pellerin L, Magistretti P J. Proc Natl Acad Sci USA. 1994;91:10625–10629. doi: 10.1073/pnas.91.22.10625. [DOI] [PMC free article] [PubMed] [Google Scholar]
- 41.McIlwain H. J Neurol Neurosurg Psychiatry. 1953;16:257–266. doi: 10.1136/jnnp.16.4.257. [DOI] [PMC free article] [PubMed] [Google Scholar]
- 42.Schurr A, West C A, Rigor B M. Science. 1988;240:1326–1328. doi: 10.1126/science.3375817. [DOI] [PubMed] [Google Scholar]
- 43.Izumi Y, Benz A M, Zorumski C F, Olney J W. NeuroReport. 1994;5:617–620. doi: 10.1097/00001756-199401000-00021. [DOI] [PubMed] [Google Scholar]
- 44.Larrabee M G. J Neurochem. 1995;64:1734–1741. doi: 10.1046/j.1471-4159.1995.64041734.x. [DOI] [PubMed] [Google Scholar]
- 45.Schurr A, Payne R S, Miller J J, Rigor B M. J Neurochem. 1997;69:423–426. doi: 10.1046/j.1471-4159.1997.69010423.x. [DOI] [PubMed] [Google Scholar]
- 46.Bittar P G, Charnay Y, Pellerin L, Bouras C, Magistretti P J. J Cereb Blood Flow Metab. 1996;16:1079–1089. doi: 10.1097/00004647-199611000-00001. [DOI] [PubMed] [Google Scholar]


