

Abstract
We investigated in vivo the characteristics of spike-frequency adaptation and the intrinsic membrane properties of an identified, looming-sensitive interneuron of the locust optic lobe, the lobula giant movement detector (LGMD). The LGMD had an input resistance of 4–5 MΩ, a membrane time constant of about 8 ms, and exhibited inward rectification and rebound spiking after hyperpolarizing current pulses. Responses to depolarizing current pulses revealed the neuron’s intrinsic bursting properties and pronounced spike-frequency adaptation. The characteristics of adaptation, including its time course, the attenuation of the firing rate, the mutual dependency of these two variables, and their dependency on injected current, closely followed the predictions of a model first proposed to describe the adaptation of cat visual cortex pyramidal neurons in vivo. Our results thus validate the model in an entirely different context and suggest that it might be applicable to a wide variety of neurons across species. Spike-frequency adaptation is likely to play an important role in tuning the LGMD and in shaping the variability of its responses to visual looming stimuli.
INTRODUCTION
Spike-frequency adaptation is a widespread feature of sensory neurons. The biophysical mechanisms of spike-frequency adaptation have been extensively studied in vertebrate and invertebrate systems and often involve calcium-dependent potassium conductances (Meech 1978; Sah 1996). Spike-frequency adaptation has a variety of important consequences for the processing of sensory stimuli. For example, it allows to emphasize changes in stimulus parameters, but can also protect neurons from firing frequency saturation and tune sensory responses to specific stimulus features, as demonstrated by several in vivo and in vitro studies (Benda et al. 2005; Sobel and Tank 1994; Wang et al. 2003). Recently, a biophysical model of spike-frequency adaptation was proposed (Liu and Wang 2001; Wang 1998) based on intracellular in vivo recordings of cat visual cortical neurons (Ahmed et al. 1998). The model made several specific predictions on how the firing frequency of adapting neurons should evolve over time and on the relation between variables characterizing spike-frequency adaptation that have not yet been tested experimentally. Although this model was based on cortical pyramidal cell data, it is likely to be widely applicable. This is explained by the fact that it is based either on a simple compartmental model endowed with conductances of the Hodgkin–Huxley type (Wang 1998), which replicates the firing properties of a wide class of neurons (Mainen and Sejnowski 1996; Pinsky and Rinzel 1994), or on a leaky integrate-and-fire approximation (Liu and Wang 2001; for related, phenomenological models, see Benda and Herz 2003; La Camera et al. 2004). We set out to experimentally test the model’s predictions on an identified interneuron in the locust visual system, the lobula giant movement detector (LGMD).
The LGMD is thought to be involved in collision avoidance and escape behavior (for review, see Gabbiani et al. 2004). It projects onto a postsynaptic target neuron called the descending contralateral movement detector (DCMD) that can easily be recorded from the animal’s nerve cord (O’Shea and Williams 1974). The connection between the LGMD and DCMD is mediated by a mixed chemical/electrical synapse (Killmann et al. 1999) and is so strong that spikes in the LGMD and DCMD are in a 1:1 correspondence under visual stimulation (Gabbiani et al. 2005; O’Shea and Williams 1974; Rind 1984). The LGMD can thus be conveniently identified electrophysiologically as the unique neuron in the optic lobe whose spikes precede by nearly 2 ms those of the DCMD. An extensive literature based on DCMD recordings shows that both the LGMD and the DCMD are most sensitive to objects approaching on a collision course (e.g., Hatsopoulos et al. 1995; Rind and Simmons 1992; Schlotterer 1977). Several aspects of the computation the LGMD performs while it is tracking approaching objects were the subject of previous investigations (Gabbiani et al. 1999, 2001; Hatsopoulos et al. 1995). This computation is thought to rely on a multiplicative interaction between two of the inputs impinging on the LGMD’s dendritic arborizations (Gabbiani et al. 2002).
The spatial receptive field structure of the LGMD was recently characterized as were the summation properties of local excitatory inputs and the role of feedforward inhibition on the neuron’s responses to looming stimuli (Gabbiani et al. 2005; Krapp and Gabbiani 2005). The intrinsic membrane properties of the LGMD have not yet been studied in detail, however. We thus started by characterizing them before comparing the LGMD adaptation characteristics to those of the spike-frequency adaptation models proposed by Wang (1998) and Liu and Wang (2001). Recording from a uniquely identified neuron, such as the LGMD, as opposed to different neurons from a population reduces the number of potential sources of variability. The reproducibility of our LGMD data proved advantageous to test the predictions made by these biophysical adaptation models. Furthermore, one of the models’ predictions would have been very difficult to test on a heterogeneous neuronal population.
METHODS
Preparation
Dissections and animal preparation were similar to those described in detail in previous publications (Gabbiani et al. 1999, 2001, 2002, 2005). Briefly, experiments were carried out on adult locusts (Schistocerca americana) taken from the laboratory colony 3–4 wk after their final molt. Animals were fixed in a plastic holder and their head was bathed in locust saline. The head capsule was opened and the gut was removed. The connective contralateral to the recorded side was either cut at the level of the subesopageal ganglion and placed in a suction electrode or recorded extracellularly with hook electrodes after cutting a window in the pronotum of the animal. The brain was exposed and desheathed with fine forceps. To minimize brain movement during intracellular recordings, the mandibular muscles were sectioned and a support was placed under the brain.
Electrophysiology and data acquisition
Extracellular recordings were amplified differentially 10,000 times with standard equipment. The DCMD was easily identified as the unit with the largest extracellular action potentials. Intracellular recordings were obtained with sharp electrodes pulled with a horizontal puller (P-87, Sutter Instruments, Novato, CA) using thin-wall borosilicate glass (1.2/0.9-mm outer/inner diameters; WPI, Sarasota, FL). The pull parameters were optimized to minimize electrode resistance and thus facilitate the passage of large currents necessary for this study. The electrodes were filled with potassium acetate (2 M) and their DC resistance, measured at the beginning of each experiment, ranged between 30 and 50 MΩ. The LGMD was identified as the unique neuron whose spikes were in one-to-one correspondence with those of the DCMD (e.g., Gabbiani et al. 2002; Fig. 4A; Gabbiani et al. 2005; Fig. 2A). As explained in RESULTS, we were interested in correlating single spike shape characteristics with the properties of the current versus spike-frequency discharge curve in individual LGMD neurons. We therefore attempted whenever possible to obtain multiple penetrations in each neuron. After a successful penetration, the electrode was carefully retracted and subsequent attempts at impaling the LGMD were directed to dendritic locations in the optic lobe either more proximal or more distal from the spike initiation zone based on anatomical markers. Electrode withdrawal and renewed penetration did not alter the response properties of the LGMD under visual stimulation or affect its input resistance and the stability of subsequent recordings, suggesting that no measurable damage resulted from this procedure. To minimize the effects of electrode impedance, all current-injection protocols were carried out using the discontinuous current-clamp mode of the intracellular amplifier (Axoclamp 2B). Discontinuous current-clamp sampling rates and electrode capacity compensation were adjusted on a cell-by-cell basis to allow settling of the potential to its steady-state value before sampling. Sampling rates ranged between 4 and 8 kHz and were well above the cutoff frequency set by the LGMD membrane time constant (see RESULTS). For a few recordings, a SEL10 amplifier (npi electronic, Tamm, Germany) was used at 15- to 20-kHz sampling rates. Current pulses were programmed using a Master 8 pulse stimulator (AMPI, Jerusalem, Israel) used to drive the external current input of the amplifier. The intra- and extracellular recordings, current traces, and a voice channel were stored on digital audio tape using a professional recorder (DT800, sampling rate: 8 kHz; MicroData Instrument, South Plainfield, NJ). Subsequently, the data were transferred to a personal computer for analysis. Intracellular recordings typically lasted 40 – 60 min.
FIG. 4.
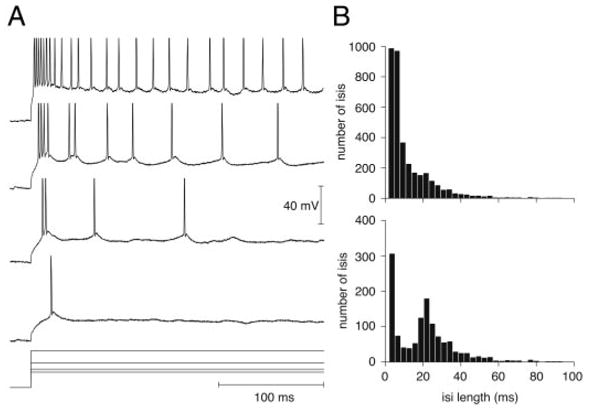
LGMD bursting in response to depolarizing current pulses. A, top 4 traces: intracellular membrane potential recorded in a single neuron in response to +3-, 4-, 6-, and 10-nA current pulses (bottom), respectively. Action potentials are truncated and only the first 280 ms of the pulse are shown. At threshold (bottom membrane potential trace) the LGMD often fires an isolated action potential. For higher currents (middle 2 traces) one or 2 short bursts of spikes are followed by isolated action potentials. At very high current intensities (top trace), the leading burst merges with the subsequent isolated action potentials and cannot be unambiguously separated from them. Note the increasing temporal separation of action potentials over the course of the pulse (adaptation). B, top: histogram of interspike interval (ISI) duration (≤ 100 ms) over the entire range of currents tested (1–10, 12, 15, and 20 nA) in the neuron illustrated in A. Bottom: histogram of ISI duration (≤ 100 ms) for current pulses leading to ≤ 50 spikes/s mean spike frequency at the end of the pulse (3–10 nA).
FIG. 2.
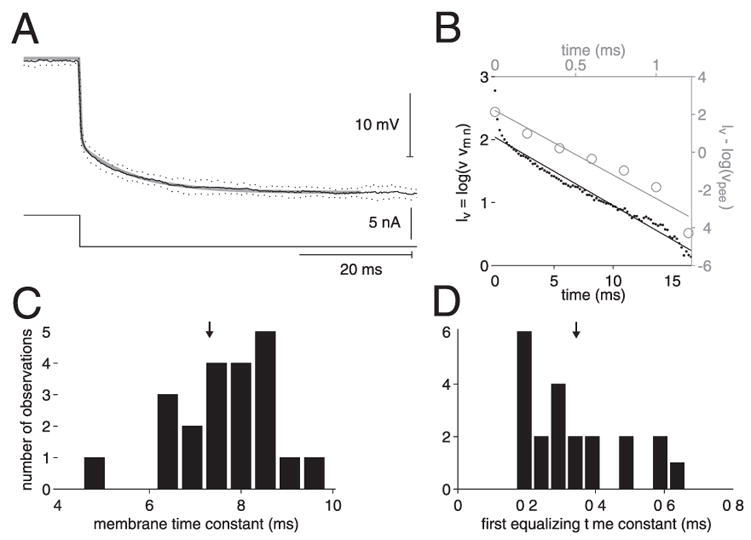
Membrane time constant of the LGMD. A: membrane potential hyperpolarization (top) to a −5-nA current pulse (bottom). Mean and SD across 10 stimulus repetitions are illustrated by the solid and dotted black lines, respectively. Gray line is a double-exponential fit with 2 time constants, τ = 7.8 ms and τe = 0.3 ms obtained using the peeling method illustrated in B. B: time constant estimation through exponential peeling. Membrane time constant (τ, bottom and left axes) was obtained by fitting the logarithm of the membrane potential minus its minimum steady-state value (black dots) to a straight line (black). τ is the absolute value of the inverse fit line slope. Equalization time constant (τe, top and right axes, gray data points and fit line) was obtained in the same manner, after subtraction of the fitted black straight line [log (vpeel)] from the experimental data. C: histogram of τ values averaged across 3 currents (−1, −2, and −5 nA) obtained in 11 neurons (17 penetrations). D: histogram of values obtained for τe (same data sample as in C). In C and D downward pointing arrows indicate mean τ and τe values, respectively.
Current-injection protocols
Each current-injection trial consisted of a square pulse lasting 500 ms. For all but one experiment, positive current pulses were preceded by a 500-ms, −2-nA negative prepulse to minimize possible inactivation of sodium channels. Each trial was repeated eight to ten times before selecting a new current value and two trials were separated by 15 s.
The first protocol consisted of stimulation with negative current pulses of −1, −2, and −5 nA, with eight to ten trials per value. We recorded responses to this protocol in 12 different neurons. In five experiments, we were able to obtain a second or a third penetration in the same neuron. In eight of these penetrations, the protocol could be repeated a second or third time, yielding a total of 23 measurements.
The second protocol consisted of stimulation with negative current pulses of −1 to −12, −15, and −20 nA. We recorded responses to this protocol in two neurons (three penetrations, seven measurements).
The third protocol consisted of stimulation with positive current pulses of +1 to 10, 12, 15, 20, and 25 nA. We recorded responses to this protocol in 13 different neurons, but not all neurons could be recorded at all current values. Three neurons were recorded ≤25, five ≤20, one ≤15, one ≤12, two ≤10, and one ≤7 nA (Fig. 6A). We obtained multiple penetrations in three neurons for a total of 17 penetrations and 32 measurements. When the currents had been injected in increasing order during a measurement, the subsequent measurement was performed in descending order (i.e., from 25 to 1 nA) to allow detection of the effects of current-injection sequence on the cell’s response. No sequence effects (ascending vs. descending) could be observed.
FIG. 6.
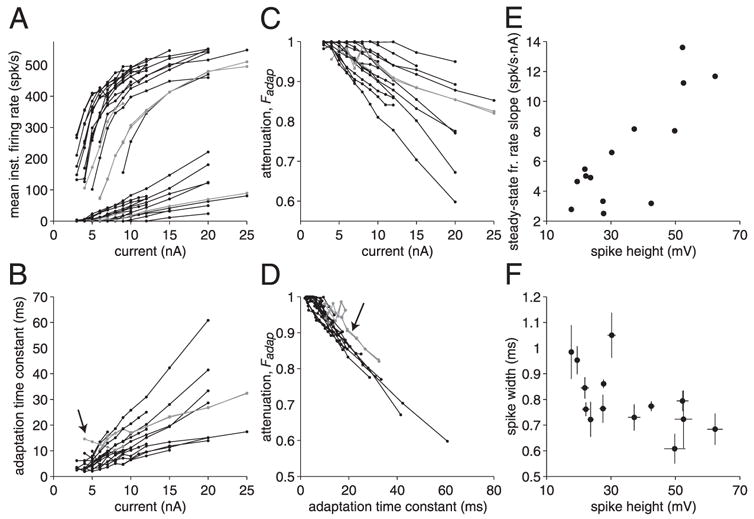
Adaptation characteristics measured in 13 LGMD neurons. A: mean spike frequency derived from the first ISI and steady-state spike frequency as a function of current amplitude. Data presented as gray lines in A–D and marked by black arrows in B and D were obtained from the same 3 neurons. Data from 17 penetrations are illustrated in A–D. B: time constant of adaptation as a function of current magnitude. Arrow indicates the single neuron for which the time constant of adaptation decreased with injected current. C: attenuation factor Fadap, as a function of current magnitude. D: attenuation factor Fadap, as a function of adaptation time constant τadap. Arrow indicates the 2 neurons whose curves are slightly offset from the rest of the data. E: steady-state spike frequency slope (derived from A) as a function of spike height. Nine neurons (14 penetrations) are illustrated in E and F. F: spike width as a function of spike height. Vertical and horizontal error bars denote SDs and are sometimes too small to see.
Data analysis
Multiple measurements during a single penetration were used to monitor the stability and reproducibility of the recordings. Data from different penetrations were treated as independent in pooled analyses. Restricting pooled analyses to different cells did not change any of the results.
RESTING MEMBRANE POTENTIAL
In 11 recordings, we determined the resting membrane potential at the end of the experiment by comparing the intracellular amplifier potential reading within the neuron with that obtained immediately after retracting the electrode to the bath.
INPUT RESISTANCE
An estimate of input resistance was computed for current pulses of −1, −2, and −5 nA by selecting a 300-ms window for each trial, averaging the membrane potential within the window and dividing by the injected current value (Fig. 1A). Usually, the averaging window was centered at the midpoint of the pulse. In some cases, it was shifted earlier or later to avoid clearly visible excitatory postsynaptic potentials. The input resistance was then averaged across the eight to ten trials obtained for each current measurement. For depolarizing pulses of +1, 2, and 3 nA, an estimate of the input resistance was computed similarly, except that each trace was first median-filtered over a 6-ms time window to suppress eventual action potentials (Fig. 1B). The averaging window typically constituted the last 300 ms of the pulse because action potentials were less likely to occur in that period (see RESULTS). In a few trials, one or at most two action potentials were included in the averaging window, but their impact was minimal after median filtering.
FIG. 1.
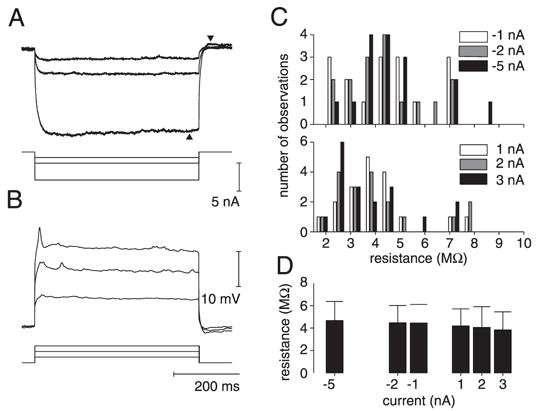
Input resistance of the lobula giant movement detector (LGMD). A: membrane potential hyperpolarization (top) evoked in response to square current pulses (bottom) of −1, −2, and −5 nA, respectively. Each membrane potential trace is an average over 10 stimulus presentations in a single neuron. Two arrowheads indicate the slight sag and rebound activity for the −5-nA current injection, respectively. B: membrane potential depolarization in a single neuron evoked in response to square current pulses of 1, 2, and 3 nA, respectively. In addition to trial averaging as in A, each membrane potential trace was first median-filtered to suppress action potentials. C: histogram of input resistance values derived from A and B for negative and positive current pulses (top and bottom panels, respectively). Negative current pulse data were obtained in 12 neurons (16 different penetrations) and positive current pulse data in 13 neurons (18 different penetrations). D: average input resistance (mean, SD) as a function of injected current derived from the histograms illustrated in C.
MEMBRANE AND EQUALIZATION TIME CONSTANTS
The membrane and equalization time constants were computed by using the peeling method for current pulses of −1, −2, and −5 nA (Rall 1969). The mean membrane potential averaged across eight to ten trials in response to the pulse was plotted in logarithmic coordinates after subtracting its minimum steady-state value. The data were fitted to a straight line by least squares (Fig. 2B). The absolute value of the inverse line slope yielded the membrane time constant. The fitted line was then subtracted from the data, revealing a second, faster linear decay in logarithmic coordinates that was also fitted to a straight line to obtain the equalization time constant. We verified the accuracy of the double-exponential fit by comparing it to the original mean membrane potential time course and its SD obtained from repeated trials (Fig. 2A). We also verified that a direct, double-exponential fit of the membrane potential time course using least squares yielded identical results (Holmes et al. 1992).
INTERSPIKE INTERVAL DISTRIBUTIONS
Interspike intervals (ISIs) were computed by subtracting successive spike occurrence times during each positive current pulse. ISIs were pooled across trials and current values. Histograms were obtained by binning the interval distribution in 30 bins of equal size between 0 and 100 ms (Fig. 4B). The coefficient of variation (CV) of the ISI distribution was obtained by dividing the SD of the ISI distribution (σt) by its mean tm (Fig. 8A). The ISI serial correlation coefficient was computed according to the formula
FIG. 8.
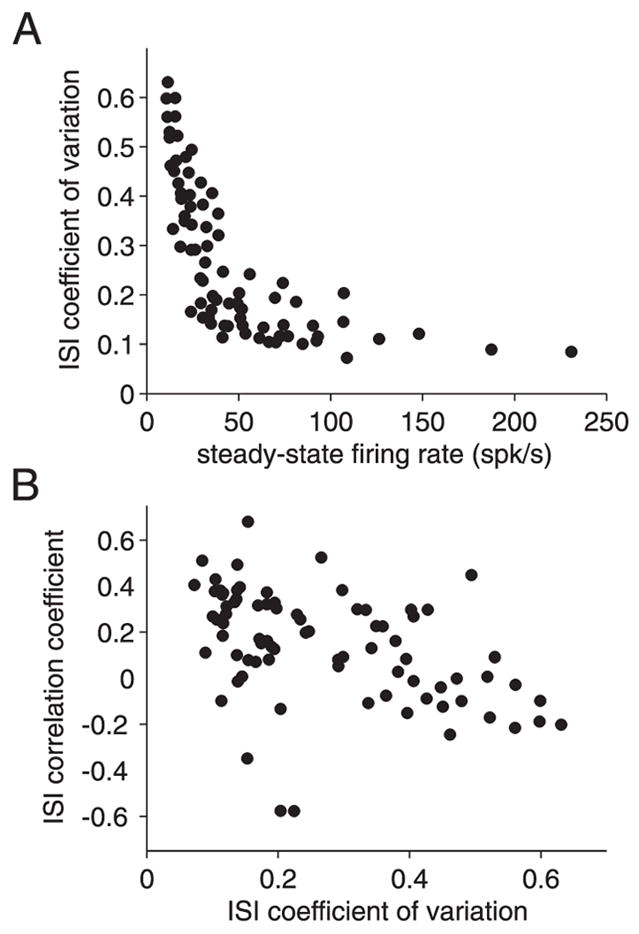
ISI variability and correlation at steady state. A: coefficient of variation of the ISI distribution at steady state as a function of the steady-state spike frequency. B: ISI correlation coefficient as a function of ISI coefficient of variation. Data from 12 different neurons (15 penetrations).
and takes values between −1 and +1 (Fig. 8B). Positive values signify that ISIs longer (shorter) than the mean tend on average to be followed by similar longer (shorter) intervals. Conversely, negative values mean that longer (shorter) intervals tend to be followed by shorter (longer) intervals. A value of zero indicates uncorrelated (possibly independent) ISIs.
INSTANTANEOUS FIRING FREQUENCY
An estimate of the instantaneous firing frequency f (t) was obtained for each trial by computing for each time t the inverse of the ISI in which t was included. At the time of a spike, we averaged the value obtained from the preceding and following ISIs. Specifically, let t1, . . . , tn be the spike occurrence times during a single trial. We set f (t) = 0 if t < t1, f(t) = 0.5/(t2 − t1) if t = t1, f(t) = 1/(ti − ti−1) for ti−1 < t < ti, f(t) = 0.5/(ti − ti−1) + 0.5/(ti+1 − ti) if t = ti, f(t) = 0.5/(tn − tn−1) if t = tn, and f(t) = 0 if t > tn. The mean instantaneous firing rate fm(t), and its SD were obtained by averaging across trials (Fig. 5A). The instantaneous firing rate for the first ISI f0 was obtained by averaging 1/(t2 − t1) across trials and the steady-state firing rate fss, by averaging fm(t) over the last 100 ms of the current pulse (Fig. 5B).
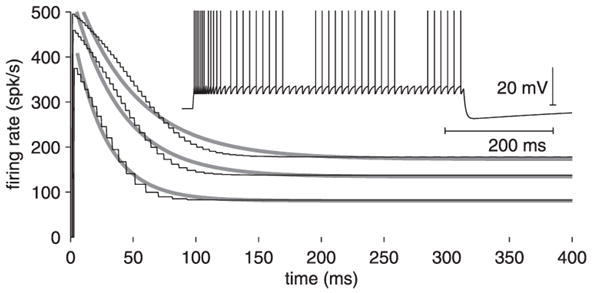
FIG. 5.
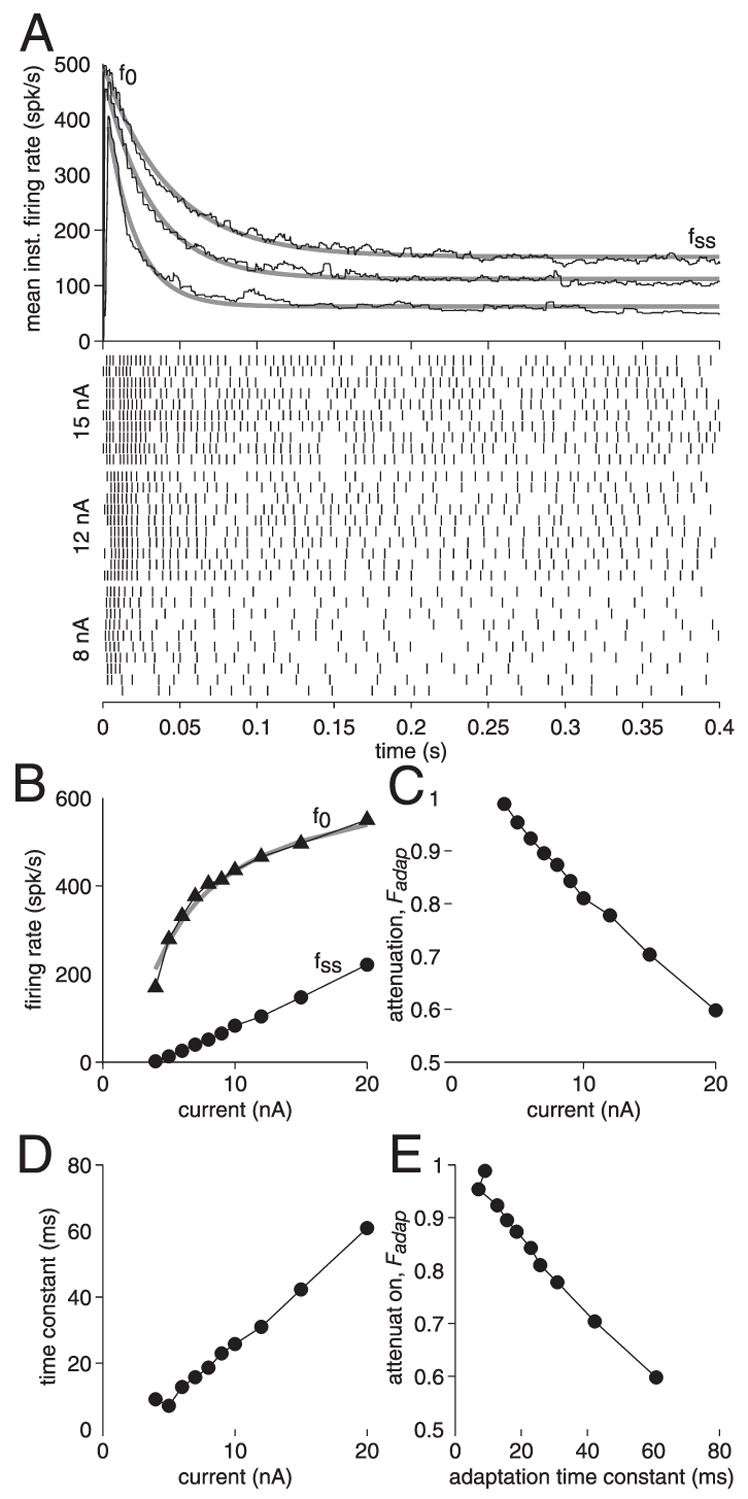
Adaptation of the LGMD spike frequency during depolarizing current pulses. A: LGMD spiking response to depolarizing current injections of 8, 12, and 15 nA. Top: instantaneous firing frequency of the LGMD [fm(t), black lines] as a function of time (in decreasing order of magnitude). Time zero indicates the positive current pulse onset. Three gray lines are exponential fits to the instantaneous spike frequency. Bottom rasters: spike occurrence times (ticks) for each of the 3 current pulses. Each line corresponds to the neuron’s response to a single current pulse (10 pulses per current value). B: mean instantaneous spike frequency for the first ISI (triangles) and at steady-state (circles) as a function of current magnitude. Gray line is a fit to the spike frequency curve of a leaky integrate-and-fire (LIF) neuron with reset different from rest (see Eq. 1, METHODS; rin5 MΩ, τ = 8 ms, v0 = 62 mV, vth = − 58 mV). C: attenuation factor, Fadap = (f0 − fss)/f0, as a function of current magnitude. D: time constant of adaptation τadap, derived from exponential fits (A) as a function of current magnitude. E: attenuation factor Fadap, as a function of the adaptation time constant τadap.
ADAPTATION PARAMETERS τadap AND Fadap
The time constant of spike frequency adaptation τadap was obtained by fitting an exponentially decaying function with three free parameters (initial firing rate f0 fit, exponential adaptation time constant τadap, and steady-state firing rate fss fit) to fm(t) by least squares (Fig. 5, A and D). We verified that double exponential fits did not improve significantly the fit quality, taking into account the SD of fm(t). Following Ahmed et al. (1998) and Wang (1998), the attenuation factor, Fadap, was defined as (Fadap = f0 − fss)/f0 (Fig. 5C).
MEAN SPIKE HEIGHT AND WIDTH
These parameters were measured in 11 neurons (14 different penetrations) using 10 isolated spikes from 10 different trials obtained in response to the lowest positive current above spiking threshold. Spike height was measured as the difference between the value of the membrane potential at the peak of the spike and the value at its inflection point during the initial depolarization leading to the spike. In practice, the inflection point was determined by finding where the first derivative of the membrane potential exceeded 5 mV/ms. Spike width was then measured at half-height. The values obtained for each trial were averaged across trials to obtain the mean spike heights, widths, and their SDs (Fig. 6F, Table 1).
TABLE 1.
Spike parameters and slope of steady-state firing frequency curve as a function of injected current in three neurons recorded in two different locations
| Neuron | Parameter | Penetration 1 | Penetration 2 |
|---|---|---|---|
| 1 | Height | 17.7 mV, SD: 0.6 | 52.2 mV, SD: 1.8 |
| Width | 0.98 ms, SD: 0.11 | 0.77 ms, SD: 0.04 | |
| Slope | 2.8 spikes · s−1 · nA−1 | 13.6 spikes · s−1 · nA−1 | |
| 2 | Height | 42.5 mV, SD: 1.0 | 49.8 mV, SD: 3.3 |
| Width | 0.77 ms, SD: 0.19 | 0.61 ms, SD: 0.06 | |
| Slope | 3.2 spikes · s−1 · nA−1 | 8.1 spikes · s−1 · nA−1 | |
| 3 | Height | 30.2 mV, SD: 1.3 | 37.2 mV, SD: 1.9 |
| Width | 1.05 ms, SD: 0.09 | 0.73 ms, SD: 0.05 | |
| Slope | 6.6 spikes · s−1 · nA−1 | 8.2 spikes · s−1 · nA−1 |
Values of spike width and height are means ± SD; n = 10. Units of measurement for height, width, and slope are expressed, respectively, as millivolts, milliseconds, and spikes per second per nanoampere. Heights and widths in penetrations 1 and 2 were always significantly different (t-test, Smith–Satterthwaite procedure, P < 0.01).
AFTERHYPERPOLARIZATION (AHP) DECAY TIME CONSTANT
The AHP decay time constant was obtained by computing the mean membrane potential time course across trials for each current pulse leading to a peak AHP exceeding −2 mV (gray traces in Fig. 7A). Currents with absolute peak AHPs <2 mV were discarded because of their sensitivity to noise. Each of the mean membrane potential time courses was normalized and their mean was computed (dotted line in Fig. 7C). A single exponential was fitted to the resulting decay by least squares on the first 500 ms after a current pulse (solid line in Fig. 7C). Membrane potential values at later times were discarded because they were sensitive to noise.
FIG. 7.
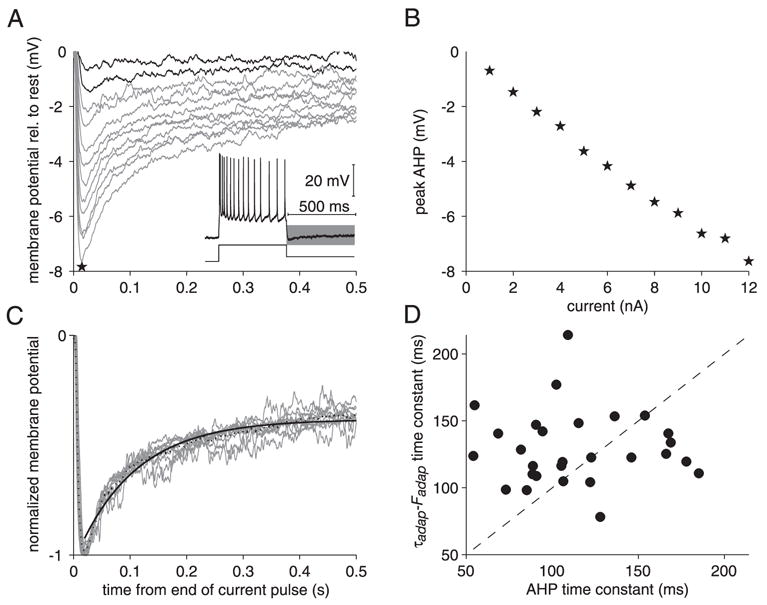
Characteristics of the afterhyperpolarization (AHP) in the LGMD. A: plot of the AHP time course after current pulse offset (illustrated by gray area in inset) for depolarizing currents of 1–12 nA. Time zero denotes the time of pulse offset. Each trace is an average across 10 stimulus presentations. Asterisk denotes the peak AHP amplitude for a current pulse of 12 nA. Data plotted in gray were used to prepare C. B: peak AHP (derived from A, star) as a function of current magnitude. C: normalized AHP time course (peak AHP set to one) for currents of 3–12 nA. Dotted black line is the mean across all traces. Black solid line is a single-exponential fit to the dotted black line. D: time constant derived from τadap–Fadap plots (see Fig. 6D) as a function of the time constant of AHP decay (derived from C) in a sample of 11 neurons (15 penetrations, 28 measurements).
FIT OF f0(I) CURVE TO THAT OF A LEAKY INTEGRATE-AND-FIRE (LIF) MODEL
For positive current pulses, we fitted by least squares the firing rate derived from the first ISI as a function of current, f0(I), to that of an LIF neuron with variable reset. If we denote by vrest the resting membrane potential (relative to an extracellular reference); vth, the spiking threshold; v0, the, the reset potential after a spike; τ, the membrane time constant; rin, the input resistance; and tref, the refractory period, then the LIF firing rate, as a function of injected current I, is given by
| (1) |
where v̄th = vth − vrest and v̄0 = v0 − vrest. In those fits, both vth and v0 were allowed to vary and the other parameters were fixed. The resting membrane potential vrest was set to −70 mV, tref was equal to 1.5 ms, and τ and rin were determined from the responses to the hyperpolarizing current protocols.
LEAKY INTEGRATE-AND-FIRE (LIF) MODEL OF ADAPTATION
We compared the adaptation time course of the LGMD firing rate to that of an LIF model similar to that studied by Liu and Wang (2001). The model includes two dynamic variables: 1) the membrane potential v(t) and 2) the intracellular calcium concentration x(t). The subthreshold dynamics of the model is described by the following two differential equations
| (2) |
| (3) |
The first term on the right-hand side of Eq. 2 represents a leak current; the second term, a potassium current whose activation depends linearly on calcium concentration; and the last term, the current injected through the electrode. The second equation represents calcium extrusion with a time constant τCa (e.g., Helmchen et al. 1996; Traub 1991). An action potential is generated when v(t) reaches vth and the membrane potential is subsequently reset to v0. The membrane potential stays at this value during the refractory period tref before resuming its dynamical evolution according to Eq. 2. After each action potential, the calcium concentration is incremented by α (i.e., x → x + α) and immediately resumes its decay following Eq. 3. The linear dependency of the potassium-dependent current on calcium concentration can be justified by linearizing the model of Wang (1998)
with kd = 30 μM and β 0.0267 μM−1. The approximation is very saccurate for x < 10 μM, as was the case in our simulations. Note that g̃ahp = ḡahpβ has units of conductance/concentration (in μS/μM). We set vrest = − 70 mV, vth = −58 mV, v0 = −62 mV, τ = 8 ms, rin = 5 MΩ, and tref = 1.5 ms. These parameters were determined from the analyses described above (see RESULTS). The calcium extrusion time constant was set to τCa = 130 ms, a value that will be justified in the RESULTS. We followed Liu and Wang (2001) and set α = 0.2 μM and vK = − 80 mV. The value of g̃ahp was adjusted to obtain attenuation factors similar to those observed experimentally and was set to 0.12 μS/μM. Note that it is about 10-fold higher than the value used by Liu and Wang (2001; 0.015 μS/μM). This is expected because the input resistance of the LGMD is about a factor 10 lower than that of pyramidal neurons and the degree of adaptation in the LGMD (see RESULTS) is similar to that of pyramidal cells (Ahmed et al. 1998). The model was simulated using a fourth-order Runge–Kutta algorithm (Henrici 1982) with a time step of 0.01 ms.
AHP DECAY IN THE LIF ADAPTATION MODEL
After a current pulse, Eqs. 2 and 3 imply that both the calcium concentration and the calcium-dependent potassium current decay exponentially toward zero with a time constant τCa. Consequently, the membrane potential v(t) relaxes toward its resting value vrest, with a time course that can be obtained from Eq. 2 by setting dv/dt = 0 (using the approximation τ ≪ tca). For typical average values of the peak AHP (− 4 mV; see RESULTS), the relaxation is slightly slower than an exponential decay with time constant τCa.
Data analysis was performed with Matlab (The MathWorks, Natick, MA). Data fitting was carried out using the optimization toolbox least-square fitting routines. The LIF integration routine used to implement Eqs. 2 and 3 was coded in C and accessed from Matlab as a Mex file to speed up simulations. In the following, correlation coefficients are indicated by ρ. The Smith–Satterthwaite procedure used in Table 1 for comparing means of distributions with unequal variances is described in Milton and Arnold (1995).
RESULTS
We investigated the intrinsic membrane properties of the LGMD by injecting hyperpolarizing and depolarizing current pulses into 15 different neurons and recording the resulting membrane potential responses. The dendritic electrotonic properties of the LGMD have not yet been studied. We thus started by characterizing them: in vivo resting membrane potential, input resistance, and membrane time constants. Next, we studied inward rectification in response to strong hyperpolarizing current pulses and classified the spiking patterns of the LGMD in response to depolarizing pulses. Finally, we studied firing adaptation and its relation to the predictions made by the models of Wang (1998) and Liu and Wang (2001).
Electrotonic properties of the LGMD
The resting membrane potential of the LGMD had a typical mean value of −68 mV (SD: 6.6 mV, n = 11 neurons). Figure 1, A and B illustrates responses to three hyperpolarizing and depolarizing current pulses of varying amplitude, respectively. Figure 1C illustrates the input resistance distributions derived from such experiments by averaging over 300-ms windows (METHODS). Bars of different shades represent input resistance measurements for the six values of injected current. Figure 1D gives the mean and SD of these distributions. There was a slight but nonsignificant trend for the input resistance to decrease with increasing current (P > 0.8, one-way ANOVA; max. difference between −5 and +3 nA: 0.8 MΩ). The overall mean input resistance pooled across all current values was 4.3 MΩ (SD: 1.6; median: 4.0).
Figure 2A shows the response of a single neuron within the first 60 ms of a −5-nA current pulse. Relaxation to the membrane potential steady-state value at the end of the pulse occurred in two phases. The first, rapid phase typically lasted roughly 1.5 ms and was followed by a slower relaxation over the next nearly 40 ms. Accordingly, the membrane potential time course could be fit by a double exponential (Fig. 2A, gray line) whose parameters were determined using the exponential peeling method (Fig. 2B). The first time constant is thought to reflect rapid charge redistribution across the spatial extent of the neuron and will be referred to as the “equalization” time constant, τe (Holmes et al. 1992). The second slower time constant reflects local charging of the membrane and thus corresponds to the membrane time constant τ. In the example depicted in Fig. 2, A and B, τ = 7.8 ms and τe = 0.3 ms. Figure 2, C and D shows histograms of the measured values of τ and τe averaged across three current values (−1, −2, and −5 nA, respectively). The means of τ and τe pooled across currents were 7.3 and 0.34 ms, respectively (SDs: 2.1 and 0.24; medians: 7.8 and 0.26). There was a trend for τ to increase with the amplitude of the pulse (one-way ANOVA, P < 0.0001). The mean values of τ at −1, −2, and −5 nA were 6.6, 7.3, and 9.2 ms, respectively (SDs: 1.7, 1.6, and 1.9).
The LGMD is endowed with an inward rectifying current
Figure 1A (arrowheads) suggests the presence of a small sag in the membrane potential toward the end of the −5-nA current pulse and rebound activity immediately after the pulse. The average difference in membrane potential measured over two 50-ms windows centered 100 and 450 ms after pulse onset was equal to 1.1 mV (SD: 1.4). This change corresponded to a significant difference in the mean membrane potentials over the two windows (t-test, P < 0.05). When pooled across 10 neurons (15 penetrations), the average difference (1.2 mV, SD: 1.7) also corresponded to a significant difference in means (t-test, P < 0.05). To further assess the presence of inward rectification, we injected negative currents of larger amplitude in two neurons (up to −20 nA; three penetrations, seven measurements). Figure 3A illustrates the trial-averaged and median filtered responses to such pulses for one measurement obtained in one of the two neurons. The other measurements in the same neuron (two penetrations total) and in the second neuron showed similar results. The magnitude of the sag increased monotonically with the magnitude of the pulse, which is reflected in the increased difference between the peak hyperpolarization (star in Fig. 3, A and B, top) and the hyperpolarization at the end of the pulse (gray circle in Fig. 3, A and B, top). Because the sag was seen at membrane potentials well below the potassium reversal potential it is more likely to be associated with the opening of a mixed sodium/potassium conductance rather than with closure of a potassium conductance (Halliwell and Adams 1982; Kiehn and Harris-Warrick 1992). The peak rebound value is illustrated in the bottom panel of Fig. 3B (triangles; see also Fig. 3A). The abrupt increase in depolarization at −7 nA (arrow) reflects the reliable generation of a rebound spike by the LGMD at this current value. Thereafter, the number of rebound spikes increased with increasing current magnitude, reaching up to nearly 10 spikes at strongly hyperpolarized potentials (−20 nA, about 100 mV below rest). Similar postpulse rebound spiking was also observed in a separate set of experiments during which five LGMD neurons were filled with Lucifer yellow by injection of large negative current pulses (Peron et al. 2003).
FIG. 3.
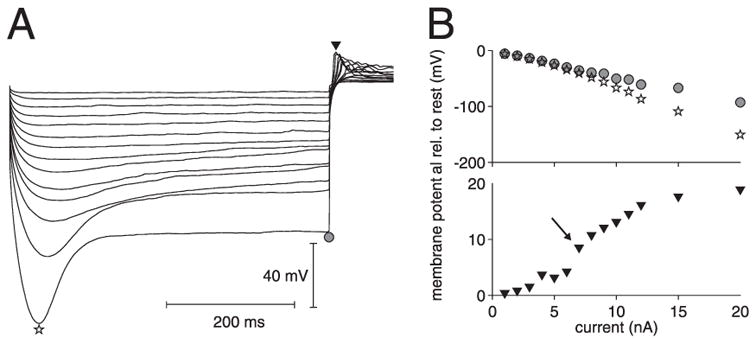
Inward rectification and poststimulus rebound activity in the LGMD. A: membrane potential deflection in response to negative square current pulses of increasing magnitude (−1 to −12, −15, and −20 nA, respectively). Each trace is averaged across 10 stimulus presentations and was median filtered to suppress rebound spikes. Star, gray circle, and black triangle indicate the peak and end-pulse hyperpolarization as well as the maximum rebound activity to the −20-nA square pulse, respectively. B, top: peak and end-pulse hyperpolarization (star and gray circles, respectively, derived from A) as a function of injected current. Bottom: peak membrane potential post-stimulus rebound (black triangle in A) as a function of injected current. Arrow indicates sudden jump in rebound activity caused by a spike.
The LGMD is an intrinsically bursting neuron
Next, we examined the LGMD responses to depolarizing current pulses. Figure 4A illustrates sample traces in a single neuron stimulated with pulses of 3, 4, 6, and 10 nA (from bottom to top). The current threshold eliciting spikes was typically around 3–4 nA. At threshold, the LGMD usually fired either one spike (Fig. 4A, bottommost trace) or a burst of two spikes (Fig. 4A, second bottommost trace). At currents above threshold, the LGMD always fired a short burst of spikes followed by isolated spikes (Fig. 4A, middle two traces). As current increased, the number of spikes in the burst typically increased and sometimes a second burst riding over a single depolarizing envelope was observed (Fig. 4A, second topmost trace), followed by isolated spikes. A characteristic signature of intrinsically bursting neurons is a bimodal interspike interval (ISI) distribution, with an initial peak corresponding to intervals between spikes occurring in bursts and a second, broader peak corresponding to intervals between bursts and/or isolated spikes (see, e.g., Figs. 1 and 2 of Nowack et al. 2003). Accordingly, the ISI distributions pooled across all positive current-injection values were bimodal in 11 of 13 neurons tested (17 penetrations), similar in shape to that illustrated in Fig. 4B (bottom). In two neurons, the ISI distributions were unimodal when pooled across all current values. This was the case for the neuron illustrated in Fig. 4 (see B, top). A closer examination of the responses showed that at current values >10 nA, the initial burst smoothly merged with subsequent isolated spikes (see Fig. 4A, top trace), thus causing the peak of the ISI distribution associated with the burst to gradually merge with the tail of the distribution. This observation was confirmed by analyzing ISI distributions for each individual current value. These ISI distributions were initially strongly bimodal and gradually became unimodal as current amplitude increased above 10 nA. Thus, when positive currents were particularly effective at driving the LGMD, the large number of action potentials obtained at high current magnitudes sometimes masked the bursting behavior seen at lower current values. This was confirmed by computing the pooled ISI distribution for current values ≤ 10 nA (corresponding to steady-state firing frequencies ≤50 spikes/s), which were bimodal in both neurons (see Fig. 4B, bottom). We were also able to obtain a second penetration in one of the neurons with unimodal ISI distribution. In the second penetration, positive currents were less effective at driving the cell, presumably because the electrode was located farther away from the spike initiation zone (see the next section) and the ISI distribution was bimodal across all currents. Based on these experimental data, we conclude that the LGMD is an intrinsically bursting neuron, with the capacity for firing at high sustained rates.
Adaptation of the LGMD firing frequency to sustained current pulses
Another feature evident from Fig. 4A is that the firing rate of the LGMD adapts over the course of a current pulse. In Fig. 5A the mean instantaneous firing frequency is plotted as a function of time during current pulses of 8, 12, and 15 nA in one LGMD neuron (black lines). These curves were derived from 10 current-injection trials whose spike rasters are shown below the graph in Fig. 5A. The peak instantaneous firing rate f0 was always attained during the first ISI, increased with current magnitude and started to saturate for values > 10 nA (Fig. 5B). The shortest intervals reached typical values of about 1.8 ms, corresponding to peak instantaneous firing frequencies of roughly 550 spikes/s. Thus f0 was a nonlinear, saturating function of current and was well fit by the current–firing frequency curve of a leaky integrate-and-fire model with refractory period and a reset potential different from rest (gray line in Fig. 5B; METHODS, Eq. 1). In contrast, the steady-state firing frequency fss was a linear function of injected current (Fig. 5B). Thus in the LGMD as in other neurons, adaptation results in a linear steady-state current–frequency relationship (Ermentrout 1998; Schwindt et al. 1997; Wang 1998). At all current values, the time course of adaptation was well fit by a single-exponential function (Fig. 5A, gray lines). This yielded a time constant of adaptation τadap that increased with the magnitude of the current pulse (τadap values of 19, 31, and 42 ms for pulses of 8, 12, and 15 nA, respectively). The attenuation of the steady-state firing rate relative to the peak firing rate was defined as Fadap = (f0 − fss)/f0 and decreased with current pulse magnitude (Fadap values of 0.87, 0.78, and 0.70 for pulses of 8, 12, and 15 nA, respectively). The values of τadap and Fadap observed in the LGMD were in the same range as those observed in pyramidal cells of cat visual cortex in vivo (0 < τadap < 80 ms and Fadap ≥ 0.50; Ahmed et al. 1998; see also Fig. 6 below).
For cat visual cortex pyramidal neurons, a model of adaptation incorporating a variety of electrophysiological data and based on a calcium-dependent mechanism was previously proposed (Liu and Wang 2001; Wang 1998). According to this model, calcium enters the cell through voltage-gated channels during repetitive firing and activates a calcium-dependent potassium conductance that acts as a negative feedback mechanism, decreasing the cell’s firing rate. In the model, calcium is extruded from the cytoplasm with a time constant τCa (see also Eqs. 2 and 3, METHODS). The model explains the exponential relaxation of the firing frequency during a current pulse observed in pyramidal neurons and in the LGMD. Analysis of the model using semianalytical and simulation techniques makes three predictions that have not yet been tested experimentally (for details see Liu and Wang 2001; Wang 1998). The first prediction is that the time constant of adaptation should increase linearly with injected current (top panel in Fig. 3B of Wang 1998). The second prediction is that the attenuation factor Fadap should decrease linearly with injected current (bottom panel in Fig. 3B of Wang 1998). In Wang’s model, both of these predicted changes originate from a slower rate of intracellular calcium accumulation as the kinetics of the action potential becomes faster with increasing injected current amplitude. The slower rate of calcium buildup results in turn in longer time constants of adaptation and weaker attenuations. These two predictions imply that the attenuation factor Fadap should depend linearly on the time constant of adaptation τadap. The third model prediction is that the inverse slope of this linear relation between τadap and Fadap is a biophysical characteristic of the investigated neuron that matches the model’s time constant of calcium extrusion τCa. In other words
| (4) |
This relation can be derived analytically in the LIF model of Liu and Wang (2001; their Eq. 47) and holds approximately in the two-compartment model of Wang (Fig. 6D in Wang 1998). In the latter case, Eq. 4 can be explained by noting that Fadap is nearly proportional to τadap. The proportionality constant k (units: ms−1) measures the rate of change of calcium concentration influx through voltage-gated Ca2+ channels as a function of intracellular calcium concentration, as determined by the current injection level and instantaneous firing frequency of the cell (k = αGcc in Eq. 18 of Wang 1998; see also his Fig. 3A, bottom). In this model, however, the same constant k also sets the time constant of adaptation through 1/τadap = k + 1/τCa (Eq. 10 in Wang 1998). Combining these two results immediately yields Eq. 4 (which corresponds to Eq. 19 of Wang 1998). Note that Eq. 4 implies that τadap and Fadap vary in antagonistic manner, i.e., as τadap increases, Fadap decreases, as observed for the three example currents considered above. These three predictions are specific to the models considered by Wang (1998) and Liu and Wang (2001). Other biophysical models of spike-frequency adaptation (see, e.g., Koch 1999) do not necessarily fulfill them (Liu and Wang 2001).
To test these theoretical predictions, we plotted the attenuation Fadap and the time constant of adaptation τadap as a function of injected current (Fig. 5, C and D). The graphs were remarkably close to linear (correlation coefficients, ρ = 0.996 and −0.997, respectively). The relation between Fadap and τadap was also nearly linear (ρ = −0.989; τCa = 141 ms), in close agreement with theoretical predictions (Liu and Wang 2001; Wang 1998). In Fig. 6A we show the peak instantaneous and steady-state firing frequency for 13 different LGMD neurons (17 penetrations). Both f0 and fss have similar shapes as in Fig. 5A, but there was quite a range of variability across neurons and penetrations. In particular, the slope of the steady-state firing frequency ranged from 2.5 to 13.7 spikes · s−1 · nA−1. Figure 6, B and C shows the time constant of adaptation and the attenuation for the same recordings as a function of injected current. There was again a wide range of variability across neurons and penetrations. Except in one case (Fig. 6B, arrow), the time constant of adaptation increased linearly with current magnitude and the linear relation predicted theoretically was closely followed (mean ρ = 0.864 across 17 penetrations). Excluding the arrow-marked cell (in Fig. 6B), which had a negative correlation coefficient, yielded a mean ρ = 0.971. The same held true for the attenuation (mean ρ = −0.957 across 17 penetrations). Quite remarkably, when the attenuation was plotted as a function of the time constant of adaptation (Fig. 6D) the variability observed in B and C almost entirely disappeared and data points were tightly clustered around a single, common line. The mean ρ between both variables amounted to −0.868 (17 penetrations) and was even higher (−0.957) when excluding the arrow-marked cell in Fig. 6B. In two neurons, the Fadap–τadap relation had a similar slope, but was slightly shifted to the right relative to the bulk of the data (arrow in Fig. 6D). A linear fit to individual Fadap–τadap relations yielded a mean intercept of 1.02 (SD: 0.05), very close to one, the value predicted by Eq. 4, and a slope of 131 ms (SD: 23 ms). Thus the slope of the Fadap–τadap relation is indeed an invariant biophysical property of the LGMD, independent of the particular animal in which the neuron was recorded and independent of the particular penetration in each LGMD neuron.
These results suggest that the variability observed in Fig. 6, A–C may result from differences in the ability of current injected through the intracellular electrode to stimulate firing in the LGMD. This is to be expected if: 1) the LGMD is not electrotonically compact and 2) the distance of the electrode relative to the spike initiation zone varied across recordings. The first assumption is likely true because the LGMD possesses a complex dendritic morphology (e.g., Fig. 1A of Gabbiani et al. 2002) and visual stimulation mediating inputs at different locations across the main dendrite have differential effects on the firing frequency of the LGMD (Krapp and Gabbiani 2005). The second assumption is also likely, given that in the present recordings the LGMD was penetrated blindly, and thus at random locations of its dendritic tree in the optic lobe. Penetrations in the dendrites at different electrotonic distances of the spike initiation zone are expected to yield spike amplitudes of varying height and width (Stuart et al. 1997). To test these assumptions directly, we took advantage of the fact that we were able to obtain in three different neurons two penetrations that led to significantly different spike heights. In all three cases the decrease in spike height was coupled with an increase in spike width, consistent with the assumption that the recording with smaller spike height was farther away from the spike initiation zone. In all three cases, the recording with the smaller spike height led to a shallower slope of the steady-state firing curve (Table 1). To further test these assumptions across our data set, we plotted in Fig. 6E the steady-state firing frequency slope as a function of spike height measured across 11 neurons (14 penetrations). We found a good correlation between spike height and steady-state firing frequency slope (ρ = 0.81, slope: 0.20 spikes · s−1 · nA−1 · mV−1). As illustrated in Fig. 6F, the spike height was in turn negatively correlated with spike width (ρ = −0.60; slope: −0.0051 ms/mV). We conclude that differences in electrode location relative to the LGMD spike initiation zone explain to a large extent the variations observed in Fig. 6, A–C across LGMD neurons and penetrations.
Properties of the postpulse afterhyperpolarization
After a depolarizing current pulse, the LGMD membrane potential exhibited an afterhyperpolarization (AHP) before relaxing over time toward its resting value. This is illustrated in Fig. 7A where the inset shows the response to a single pulse and the following AHP time course (shaded gray area). The main panel shows the time course of the membrane potential on an expanded timescale for a range of current values (1–12 nA) immediately after termination of the pulse. The peak AHP is plotted in Fig. 7B as a function of current amplitude. The relation between these variables was close to linear (ρ = −0.997) in this and all other cases examined (11 neurons, 15 penetrations, 28 measurements). In the model considered in the previous paragraph, the calcium-dependent potassium current causes both spike-frequency adaptation and the postpulse AHP (see also METHODS, AHP DECAY IN THE LIF ADAPTATION MODEL). If this is also predominantly the case for the LGMD, one expects the potassium current to decay after a current pulse with a time constant independent of the recorded neuron and equal to τCa. Consequently, an approximately similar decay is also expected for the AHP (e.g., Sah 1992; Schwindt et al. 1988). To test this hypothesis, we replotted the normalized AHP time course in cases where the absolute peak AHP value exceeded 2 mV (Fig. 7C, gray traces; obtained from those in Fig. 7A). The time course of AHP decay was similar across current-injection amplitudes and the normalized AHP averaged across current values (dotted line in Fig. 7C) could be fitted with a single exponential (Fig. 7C, black line), although these fits were typically less good than those obtained for spike-frequency adaptation. In Fig. 7D we compare the time constant of AHP decay to that obtained from the slope of the Fadap–τadap relation in 11 neurons. The mean AHP decay time constant was equal to 114 ms (SD: 37) and was slightly lower than the mean τadap–Fadap time constant (131 ms, SD: 23). There was no correlation between these two variables (ρ = −0.03), indicating no systematic changes across cells. These results are thus consistent with a common mechanism governing spike-frequency adaptation and AHP decay in the LGMD. Other conductances, such as inward rectification, might also contribute to a lesser extent to AHP decay, thus speeding up its dynamics (Lorenzon and Foehring 1992).
Interspike interval characteristics at steady-state
As illustrated by the raster plots shown in Fig. 5A (top), firing of the LGMD was very regular at steady state for high firing frequencies. Correspondingly, the coefficient of variation (CV) of the ISI distribution at steady state was between 0.1 and 0.2 for firing frequencies in excess of 50 spikes/s (Fig. 8A). As the steady-state firing frequencies decreased <50 spikes/s, the variability of ISIs rapidly increased, with CV values between 0.2 and 0.6. When the CV is high at low firing frequencies, the theoretical models of Wang (1998) and Liu and Wang (2001) predict negative correlations between ISIs because randomly occurring short intervals cause sufficient calcium entry to activate the AHP conductance, making the next ISI more likely to be longer and vice versa (Fig. 9C of Wang 1998; Fig. 8 of Liu and Wang 2001). In Fig. 8B we show the ISI correlation coefficient (CC) as a function of the CV at steady state. There was a negative correlation (ρ = −0.45) between these two variables and the CC was indeed negative at high CVs. In contrast, when strong current pulses were dominant in driving the LGMD responses, low CVs resulted in predominantly positive CCs. This is expected for strongly periodic firing from results obtained in simplified neuronal models in the presence of weak, correlated noise (Lindner 2004).
FIG. 9.
Modeling of LGMD adaptation using LIF neuron. Plot of instantaneous spike frequency as a function of time for 3 current pulses (8, 12, and 15 nA, as in Fig. 5A). Time zero denotes positive current pulse onset. Gray lines are exponential fits to the simulated firing rate. Inset: response of the model for an 8-nA current injection.
A leaky integrate-and-fire model fails to replicate LGMD adaptation
The linear dependency of the τadap–I, Fadap–I, and Fadap–τadap relations observed in the LGMD were predicted in a conductance-based, two-compartment model (Wang 1998) and in an LIF neuron (Liu and Wang 2001), which both included a calcium-dependent adaptation current and an exponential calcium extrusion mechanism. Because an LIF neuron can be constrained from the electrophysiological data described in the previous paragraphs, we investigated whether this model is able to replicate the adaptation properties of the LGMD. Such a model cannot of course replicate more complex properties such as bursting, but has the advantage of being conceptually simple. It could thus potentially yield insight in the firing properties of the LGMD for stimuli other than current pulses. To be useful, such a model needs to work over a large fraction of the LGMD dynamic range and in particular at high firing frequencies, as observed during stimulation of the LGMD with visual looming stimuli. The inset in Fig. 9 shows a simulation for model parameters matched to the properties of the neuron depicted in Fig. 5 (current pulse amplitude: 8 nA). The firing frequency of the LIF adapts over the course of the current pulse and the model exhibits attenuation and an AHP similar to those observed in the LGMD. An important difference between the model used here and the one studied by Liu and Wang (2001) is that we had to introduce a refractory period (tref = 1.5 ms) to replicate the nonlinear relation between the peak instantaneous firing rate frequency f0 and current over a large fraction of the LGMD firing range (Fig. 5B, gray trace). It follows immediately from Eq. 1 that the firing frequency of an LIF neuron in the presence of a refractory period is given by f (I) = [tref + fnoref(I)−1] −1, where fnoref(I) is the firing frequency with tref set to zero. The refractory period thus plays a negligible role for low currents [tref ≪ fnoref(I)−1], leading to an exponential decay of firing frequency over the time course of the pulse (Fig. 9, bottom black trace and gray line). For higher currents, however, the refractory period is initially predominant and sets its own timescale for firing frequency decay, thus interfering with the negative feedback mechanism mediated by the adaptation current. Accordingly, a single exponential could not fit the decay of the firing frequency observed in the model (Fig. 9, top two black traces and gray lines), in contrast to experimental findings (Fig. 5A). Thus an LIF neuron with refractory period is unable to fit the LGMD adaptation properties over the range of firing frequencies studied experimentally. We conclude that a conductance-based, compartmental model will be required for this purpose.
DISCUSSION
This work presents a detailed characterization of the intrinsic dendritic membrane properties of the LGMD. It shows that the LGMD has a fast membrane time constant, a low input resistance, and an extended electrotonic structure. It also reveals the presence of adaptation, of inward rectification, and places the LGMD in the category of intrinsically bursting neurons (Krahe and Gabbiani 2004). Adaptation followed remarkably well the predictions made by the two-compartment model of Wang (1998). By using a uniquely identifiable neuron, we were in particular able to verify that the relation between attenuation and the time constant of adaptation is linear and that its slope is a biophysical invariant of the LGMD. This prediction would have been very difficult to test on a heterogeneous neuronal population. Our results thus validate the model’s predictions and also rule out a description of the LGMD by a simpler, leaky integrate-and-fire model.
Because we studied the electrotonic properties of the LGMD in vivo, our measurements were presumably affected by more than pure passive membrane properties. Although we did not characterize spontaneous membrane potential fluctuations, intracellular LGMD recordings in vivo typically exhibit a sizable number of spontaneous excitatory and inhibitory postsynaptic potentials. Thus background activity is likely to have affected the input resistance and the membrane time constant of the cell (Bernander et al. 1991). It might also have had an impact on the resting membrane potential. Some active conductances such as the one mediating inward rectification may also be tonically active and contribute to resting membrane properties (Magee 1998). The increase in membrane time constant with hyperpolarizing pulse amplitude would, for example, be consistent with rapid closing of tonically active conductances. Because the input resistance did not change significantly over longer time-scales, this might have been compensated for by a slower activation of inward rectification, for instance. The estimation of electrotonic parameters may also depend on the recording technique. In vitro, differences were observed between sharp electrode recordings (used here) and patch-clamp recordings (Spruston and Johnston 1992; Staley et al. 1992), but may be less conspicuous in vivo (Borg-Graham et al. 1996). Currently, it is unknown whether such differences exist in insect visual interneurons because in vivo patch-clamp recordings have proven difficult to obtain from large wide-field cells such as the LGMD. Nonetheless, the values reported here were similar to those observed in fly tangential neurons obtained under similar circumstances (Borst and Haag 1996). These neurons, like the LGMD, integrate on their extended dendritic arborizations a large number of local visual inputs. In vivo electrotonic properties are directly relevant to information processing in the context of natural visual stimuli. In particular, the low input resistance and fast membrane time constant of the LGMD allow for rapid processing of visual information. As is the case for fly tangential neurons involved in visual flight control (e.g., Borst and Haag 2002; Egelhaaf et al. 2002), rapid visual information processing is critical to support successful collision avoidance and escape behaviors.
Inward rectification has been reported in many vertebrate and invertebrate neurons (e.g., Golowasch and Marder 1992; Kiehn and Harris-Warrick 1992; Lüthi and McCormick 1998). Originally, inward rectifying conductances have been linked to bursting (Jahnsen and Llinas 1984). More recently, inward rectification was shown to shorten the window of synaptic integration (Magee 1998; Migliore et al. 2004; Poolos et al. 2002). The role played by inward rectification in the LGMD during synaptic integration of visual inputs is under study. Inward rectification may also play a role in shaping the bursting properties of the LGMD. In our experiments, the hyperpolarizing prepulses preceding depolarizing current pulses should have activated little additional inward rectification (Fig. 3). In one experiment, we studied the responses to depolarizing current pulses without applying hyperpolarizing prepulses and observed no differences in the bursting characteristics of the LGMD. The role of inward rectification in synaptic integration will also depend on the parameters characterizing the underlying conductance (for very different models see Hill et al. 2001; Liu et al. 1998; Poolos et al. 2002; Wang 1994) and on its distribution within LGMD’s dendritic tree (Migliore and Sheperd 2002).
An alternative mechanism that could explain bursting in the LGMD is the electrical load imposed by its extended dendritic compartments on the spike initiation zone. High dendritic loads are likely to contribute to bursting in cortical neurons (Mainen and Sejnowski 1996) and induce bursting in Wang’s model (Wang 1998; Fig. 5C). Notably, this mechanism should not interfere with the model’s predictions. A detailed reconstruction of LGMD’s dendritic tree (Peron et al. 2003) and a compartmental model derived from it will be required to test this hypothesis. Active conductances, like a persistent sodium current, may also contribute to bursting in the LGMD (Gabbiani et al. 2002), as in other neurons (e.g., Wu et al. 2005).
The LGMD exhibits pronounced adaptation in response to depolarizing current pulses. The degree of adaptation is comparable to that observed in cortical pyramidal neurons in vivo (Ahmed et al. 1998). The firing characteristics of cortical neurons have been investigated particularly thoroughly and categorized according to several distinct classes (McCormick et al. 1985; Nowak et al. 2003; Schwindt et al. 1997). Typically, many cortical neurons that exhibit spike-frequency adaptation are regular spiking, although adaptation is also observed in intrinsically bursting neurons. The LGMD is both intrinsically bursting and strongly adapting. Thus its firing characteristics may lie at an intermediate level between these two categories. Bursting and adaptation are likely to explain several of the properties of LGMD spike trains observed in response to looming stimuli. When an object approaches the animal on a collision course, the spike patterns of the LGMD typically consist initially of short bursts of spikes followed by more prolonged periods of silence (Fig. 1 of Gabbiani et al. 1999 and of Gabbiani et al. 2005). This pattern of firing could readily be explained by the interplay between intrinsic bursting and adaptation mechanisms activated by visually driven synaptic inputs. Spike-frequency adaptation is also likely to contribute to the cell’s preferential tuning to looming objects. This can be illustrated by considering the properties of looming objects as opposed to translating ones. The edge of a looming object is continuously expanding and thus activates an increasing number of excitatory synaptic inputs. This should effectively counteract the onset of spike-frequency adaptation in the LGMD. In contrast, the edges of a translating object activate a constant number of synaptic inputs and are thus expected to be subject to adaptation over relatively short timescales, similar to current pulses of constant amplitude. These ideas can be tested experimentally by manipulating the intracellular calcium concentration of the LGMD in vivo during visual stimulation.
The predictions made by the model of Wang (1998) were remarkably well reproduced in the LGMD. In addition, the variability in the slopes of the τadap and Fadap versus I curves could to a large extent be explained by variability in the location of the electrode relative to the spike initiation zone. The residual variability in the slope of the Fadap versus τadap curve around its mean value (about 130 ms) may result from genuine variations in calcium dynamics from cell to cell. In this case, one would expect a correlation between the time constant derived from the slope of the Fadap versus τadap curve and the rate of decay of the AHP after a current pulse. No such correlation was detected (Fig. 7D), suggesting that systematic cell-to-cell variations, if present, lie within experimental noise. Because spike-frequency adaptation over the timescales reported here is mediated in a vast majority of neurons by calcium-dependent potassium currents (Sah 1996), it is likely that the same mechanism is at work in the LGMD. Specifically, we predict calcium transients to decay with a time constant of about 130 ms within LGMD’s dendritic tree. We base this prediction on the fact that the slope of the Fadap–τadap relation is a biophysical invariant, corresponding to the effective time constant of calcium extrusion in Wang’s model. In the model, spatial variations in local calcium dynamics can be detected by the presence of multiple adaptation time constants. The mono-exponential decay reported here thus suggests fairly homogeneous calcium entry/extrusion and calcium-dependent potassium mechanisms across LGMD’s main dendrites, as recently reported in hippocampal neurons (Ngo-Anh et al. 2005).
The LIF model of Liu and Wang (2001) failed to reproduce the dynamics of adaptation over the full firing range of the cell because of the addition of an absolute refractory period. This feature was necessary to replicate the saturation of the first ISI versus current curves observed experimentally (Fig. 6A), but significantly affected the dynamics of adaptation at high firing frequencies. Clearly, a simple threshold and an absolute refractory period constitute only a crude approximation to more realistic compartmental models (Ermentrout 1998; Liu and Wang 2001). Nonetheless, the LIF model successfully approximates the firing characteristics of cortical pyramidal neurons (Rauch et al. 2003). This may be in part explained by the fact that pyramidal neurons often fire at lower frequencies (Simons and Carvell 1989). In any case, Wang’s model appears sufficiently general to capture the properties of spike-frequency adaptation in the LGMD, a neuron quite different from those originally used to constrain it. We suggest that it might therefore encapsulate fundamental properties of spike-frequency adaptation over timescales of a few hundreds of milliseconds.
Acknowledgments
Thanks to J. Niven and S. Huston for comments.
GRANTS
This work was supported by a Deutsche Forschungsgemeinschaft travel grant to H. G. Krapp, an Alfred P. Sloan Fellowship to F. Gabbiani, and a National Institute of Mental Health R01 grant to F. Gabbiani.
References
- Ahmed B, Anderson JC, Douglas RJ, Martin KAC, Whitteridge D. Estimates of the net excitatory currents evoked by visual stimulation of identified neurons in cat visual cortex. Cereb Cortex. 1998;8:462–476. doi: 10.1093/cercor/8.5.462. [DOI] [PubMed] [Google Scholar]
- Benda J, Herz AVM. A universal model for spike-frequency adaptation. Neural Comput. 2003;15:2523–2564. doi: 10.1162/089976603322385063. [DOI] [PubMed] [Google Scholar]
- Benda J, Longtin A, Maler L. Spike-frequency adaptation separates transient communication signals from background oscillations. J Neurosci. 2005;25:2312–2321. doi: 10.1523/JNEUROSCI.4795-04.2005. [DOI] [PMC free article] [PubMed] [Google Scholar]
- Bernander Ö, Douglas R, Martin KAC, Koch C. Synaptic background activity influences spatiotemporal integration in single pyramidal cells. Proc Natl Acad Sci USA. 1991;88:11569–11573. doi: 10.1073/pnas.88.24.11569. [DOI] [PMC free article] [PubMed] [Google Scholar]
- Borg-Gaham L, Monier C, Fregnac Y. Voltage-clamp measurement of visually-evoked conductances with whole-cell patch recordings in primary visual cortex. J Physiol (Paris) 1996;90:185–188. doi: 10.1016/s0928-4257(97)81421-0. [DOI] [PubMed] [Google Scholar]
- Borst A, Haag J. The intrinsic electrophysiological characteristics of fly lobula plate tangential cells. I. Passive membrane properties. J Comput Neurosci. 1996;3:313–336. doi: 10.1007/BF00161091. [DOI] [PubMed] [Google Scholar]
- Borst A, Haag J. Neural networks in the cockpit of the fly. J Comp Physiol A Sens Neural Behav Physiol. 2002;188:419–437. doi: 10.1007/s00359-002-0316-8. [DOI] [PubMed] [Google Scholar]
- Egelhaaf M, Kern R, Krapp HG, Kretzberg J, Kurtz R, Warzecha AK. Neural encoding of behaviorally relevant visual-motion information in the fly. Trends Neurosci. 2002;25:96–102. doi: 10.1016/s0166-2236(02)02063-5. [DOI] [PubMed] [Google Scholar]
- Ermentrout B. Linearization of F–I curves by adaptation. Neural Comput. 1998;10:1721–1729. doi: 10.1162/089976698300017106. [DOI] [PubMed] [Google Scholar]
- Gabbiani F, Cohen I, Laurent G. Time-dependent activation of feed-forward inhibition in a looming-sensitive neuron. J Neurophysiol. 2005;94:2150–2161. doi: 10.1152/jn.00411.2005. [DOI] [PMC free article] [PubMed] [Google Scholar]
- Gabbiani F, Krapp HG, Hatsopoulos N, Mo CH, Koch C, Laurent G. Multiplication and stimulus invariance in a looming-sensitive neuron. J Physiol (Paris) 2004;98:19–34. doi: 10.1016/j.jphysparis.2004.03.001. [DOI] [PubMed] [Google Scholar]
- Gabbiani F, Krapp HG, Koch C, Laurent G. Multiplicative computation in a visual neuron sensitive to looming. Nature. 2002;420:320–324. doi: 10.1038/nature01190. [DOI] [PubMed] [Google Scholar]
- Gabbiani F, Krapp HG, Laurent G. Computation of object approach by a wide-field, motion-sensitive neuron. J Neurosci. 1999;19:1122–1141. doi: 10.1523/JNEUROSCI.19-03-01122.1999. [DOI] [PMC free article] [PubMed] [Google Scholar]
- Gabbiani F, Mo C, Laurent G. Invariance of angular threshold computation in a wide-field looming sensitive neuron. J Neurosci. 2001;21:314–329. doi: 10.1523/JNEUROSCI.21-01-00314.2001. [DOI] [PMC free article] [PubMed] [Google Scholar]
- Golowasch J, Marder E. Ionic currents of the lateral pyloric neuron of the stomatogastric ganglion of the crab. J Neurophysiol. 1992;67:318–331. doi: 10.1152/jn.1992.67.2.318. [DOI] [PubMed] [Google Scholar]
- Halliwell JV, Adams PR. Voltage-clamp analysis of muscarine excitation in hippocampal neurons. Brain Res. 1982;250:71–92. doi: 10.1016/0006-8993(82)90954-4. [DOI] [PubMed] [Google Scholar]
- Hatsopoulos N, Gabbiani F, Laurent G. Elementary computation of object approach by a wide-field visual neuron. Science. 1995;270:1000–1003. doi: 10.1126/science.270.5238.1000. [DOI] [PubMed] [Google Scholar]
- Helmchen F, Imoto K, Sakmann B. Ca2+ buffering and action potential-evoked Ca2+ signaling in dendrites of pyramidal neurons. Biophys J. 1996;70:1069–1081. doi: 10.1016/S0006-3495(96)79653-4. [DOI] [PMC free article] [PubMed] [Google Scholar]
- Henrici P. Essentials of Numerical Analysis. New York: Wiley; 1982. [Google Scholar]
- Hill AAV, Lu J, Masino MA, Olsen OH, Calabrese RL. A model of a segmental oscillator in the leech heartbeat neuronal network. J Comput Neurosci. 2001;10:281–302. doi: 10.1023/a:1011216131638. [DOI] [PubMed] [Google Scholar]
- Holmes WR, Segev I, Rall W. Interpretation of time constant and electrotonic length estimates in multicylinder or branched neuronal structures. J Neurophysiol. 1992;68:1401–1420. doi: 10.1152/jn.1992.68.4.1401. [DOI] [PubMed] [Google Scholar]
- Jahnsen H, Llinas R. Ionic basis for the electro-responsiveness and oscillatory properties of guinea-pig thalamic neurones in vitro. J Physiol. 1984;349:227–247. doi: 10.1113/jphysiol.1984.sp015154. [DOI] [PMC free article] [PubMed] [Google Scholar]
- Kiehn O, Harris-Warrick RM. 5-HT modulation of hyperpolarization-activated inward current and calcium-dependent outward current in a crustacean motor neuron. J Neurophysiol. 1992;68:496–508. doi: 10.1152/jn.1992.68.2.496. [DOI] [PubMed] [Google Scholar]
- Killmann F, Gras H, Schürmann F-W. Types, numbers and distribution of synapses on the dendritic tree of an identified visual interneuron in the brain of the locust. Cell Tissue Res. 1999;296:645–665. doi: 10.1007/s004410051325. [DOI] [PubMed] [Google Scholar]
- Koch C. Biophysics of Computation. Oxford, UK: Oxford Univ. Press; 1999. [Google Scholar]
- Krahe R, Gabbiani F. Burst firing in sensory systems. Nat Rev Neurosci. 2004;5:13–23. doi: 10.1038/nrn1296. [DOI] [PubMed] [Google Scholar]
- Krapp HG, Gabbiani F. Spatial distribution of inputs and local receptive field properties of a wide-field looming-sensitive neuron. J Neurophysiol. 2005;93:2240–2253. doi: 10.1152/jn.00965.2004. [DOI] [PubMed] [Google Scholar]
- La Camera G, Rauch A, Lüscher HR, Senn W, Fusi S. Minimal models of adapted neuronal responses to in vivo-like input currents. Neural Comput. 2004;16:2101–2124. doi: 10.1162/0899766041732468. [DOI] [PubMed] [Google Scholar]
- Linder B. Interspike interval statistics of neurons driven by colored noise. Phys Rev E. 2004;69:022901. doi: 10.1103/PhysRevE.69.022901. [DOI] [PubMed] [Google Scholar]
- Liu YH, Wang XJ. Spike-frequency adaptation of a generalized leaky integrate-and-fire model neuron. J Comput Neurosci. 2001;10:25–45. doi: 10.1023/a:1008916026143. [DOI] [PubMed] [Google Scholar]
- Liu Z, Golowasch J, Marder E, Abbott LF. A model neuron with activity-dependent conductances regulated by multiple calcium sensors. J Neurosci. 1998;18:2309–2320. doi: 10.1523/JNEUROSCI.18-07-02309.1998. [DOI] [PMC free article] [PubMed] [Google Scholar]
- Lorenzon NM, Foehring RC. Relationshipo between repetitive firing and afterhyperpolarizations in human neocortical neurons. J Neurophysiol. 1992;67:350–363. doi: 10.1152/jn.1992.67.2.350. [DOI] [PubMed] [Google Scholar]
- Lüthi A, McCormick DA. H-current: properties of a neuronal and network pacemaker. Neuron. 1998;21:9–12. doi: 10.1016/s0896-6273(00)80509-7. [DOI] [PubMed] [Google Scholar]
- Magee JC. Dendritic hyperpolarization-activated currents modify the integrative properties of hippocampal CA1 pyramidal neurons. J Neurosci. 1998;18:7613–7624. doi: 10.1523/JNEUROSCI.18-19-07613.1998. [DOI] [PMC free article] [PubMed] [Google Scholar]
- Mainen ZF, Sejnowski TJ. Influence of dendritic structure on firing pattern in model neocortical neurons. Nature. 1996;382:363–366. doi: 10.1038/382363a0. [DOI] [PubMed] [Google Scholar]
- McCormick DA, Connors BW, Lighthall JW, Prince DA. Comparative electrophysiology of pyramidal and sparsely spiny neurons of the neocortex. J Neurophysiol. 1985;54:782–806. doi: 10.1152/jn.1985.54.4.782. [DOI] [PubMed] [Google Scholar]
- Meech RW. Calcium-dependent potassium activation in nervous tissues. Ann Rev Biophys Bioeng. 1978;7:1–18. doi: 10.1146/annurev.bb.07.060178.000245. [DOI] [PubMed] [Google Scholar]
- Migliore M, Messineo L, Ferrante M. Dendritic Ih selectively blocks temporal summation of unsynchronized distal inputs in CA1 pyramidal neurons. J Comput Neurosci. 2004;16:5–13. doi: 10.1023/b:jcns.0000004837.81595.b0. [DOI] [PubMed] [Google Scholar]
- Migliore M, Shepherd GM. Emerging rules for the distribution of active dendritic conductances. Nat Rev Neurosci. 2002;3:362–370. doi: 10.1038/nrn810. [DOI] [PubMed] [Google Scholar]
- Milton JS, Arnold JC. Introduction to Probability and Statistics. 3. New York: McGraw-Hill; 1995. [Google Scholar]
- Ngo-Anh TJ, Bloodgood BL, Lin M, Sabatini BL, Maylie J, Adelman JP. SK channels and NMDA receptors form a Ca2+-mediated feedback loop in dendritic spines. Nat Neurosci. 2005;8:642–649. doi: 10.1038/nn1449. [DOI] [PubMed] [Google Scholar]
- Nowak LG, Azouz R, Sanchez-Vives MV, Gray CM, McCormick DA. Electrophysiological classes of cat primary visual cortical neurons in vivo as revealed by quantitative analyses. J Neurophysiol. 2003;89:1541–1566. doi: 10.1152/jn.00580.2002. [DOI] [PubMed] [Google Scholar]
- O’Shea M, Williams JLD. The anatomy and output connection of a locust visual interneurone; the lobula giant movement detector (LGMD) neurone. J Comp Physiol. 1974;91:257–266. [Google Scholar]
- Peron SP, Krapp HG, Laurent G, Gabbiani F. 2003 Abstract Viewer/Itinerary Planner. Washington DC: Society for Neuroscience; 2003. Role of dendritic morphology in the processing of looming stimuli: a compartmental modeling study. Program No 491.3. Online. [Google Scholar]
- Pinsky PF, Rinzel J. Intrinsic and network rhythmogenesis in a reduced Traub model for CA3 neurons. J Comput Neurosci. 1994;1:39–60. doi: 10.1007/BF00962717. [DOI] [PubMed] [Google Scholar]
- Poolos NP, Migliore M, Johnston D. Pharmacological upregulation of h-channels reduces the excitability of pyramidal neuron dendrites. Nat Neurosci. 2002;5:767–774. doi: 10.1038/nn891. [DOI] [PubMed] [Google Scholar]
- Rall W. Time constants and electrotonic length of membrane cylinders and neurons. Biophys J. 1969;9:1483–1508. doi: 10.1016/S0006-3495(69)86467-2. [DOI] [PMC free article] [PubMed] [Google Scholar]
- Rauch A, La Camera G, Lüscher HR, Senn W, Fusi S. Neocortical pyramidal cells respond as integrate-and-fire neurons to in vivo-like input currents. J Neurophysiol. 2003;90:1598–1612. doi: 10.1152/jn.00293.2003. [DOI] [PubMed] [Google Scholar]
- Rind FC. A chemical synapse between two motion detecting neurons in the locust brain. J Exp Biol. 1984;110:143–167. doi: 10.1242/jeb.110.1.143. [DOI] [PubMed] [Google Scholar]
- Rind FC, Simmons PJ. Orthopteran DCMD neuron: a reevaluation of responses to moving objects. I. Selective responses to approaching objects. J Neurophysiol. 1992;68:1654–1682. doi: 10.1152/jn.1992.68.5.1654. [DOI] [PubMed] [Google Scholar]
- Sah P. Role of calcium influx and buffering in the kinetics of a Ca2+-activated K+ current in rat vagal motoneurons. J Neurophysiol. 1992;68:2237–2247. doi: 10.1152/jn.1992.68.6.2237. [DOI] [PubMed] [Google Scholar]
- Sah P. Ca2+-activated K+ currents in neurones: types, physiological roles and modulation. Trends Neurosci. 1996;19:150–154. doi: 10.1016/s0166-2236(96)80026-9. [DOI] [PubMed] [Google Scholar]
- Schlotterer GR. Response of the locust descending movement detector neuron to rapidly approaching and withdrawing visual stimuli. Can J Zool. 1977;55:1372–1376. [Google Scholar]
- Schwindt P, O’Brien JA, Crill W. Quantitative analysis of firing properties of pyramidal neurons from layer 5 of rat sensorimotor cortex. J Neurophysiol. 1997;77:2484–2498. doi: 10.1152/jn.1997.77.5.2484. [DOI] [PubMed] [Google Scholar]
- Schwindt PC, Spain WJ, Foehring RC, Stafstrom CE, Chubb MC, Crill WE. Multiple potassium conductances and their functions in neurons from cat sensorimotor cortex in vitro. J Neurophysiol. 1988;59:424–449. doi: 10.1152/jn.1988.59.2.424. [DOI] [PubMed] [Google Scholar]
- Simons DJ, Carvell GE. Thalamocortical response transformation in the rat vibrissa/barrel system. J Neurophysiol. 1989;61:311–330. doi: 10.1152/jn.1989.61.2.311. [DOI] [PubMed] [Google Scholar]
- Sobel E, Tank DW. In vivo Ca2+ dynamics in a cricket auditory neuron: an example of chemical computation. Science. 1994;263:823–826. doi: 10.1126/science.263.5148.823. [DOI] [PubMed] [Google Scholar]
- Spruston N, Johnston D. Perforated patch-clamp analysis of the passive membrane properties of three classes of hippocampal neurons. J Neurophysiol. 1992;67:508–529. doi: 10.1152/jn.1992.67.3.508. [DOI] [PubMed] [Google Scholar]
- Staley KJ, Otis TS, Mody I. Membrane properties of dentate gyrus granule cells: comparison of sharp microelectrode and whole cell recordings. J Neurophysiol. 1992;67:1346–1358. doi: 10.1152/jn.1992.67.5.1346. [DOI] [PubMed] [Google Scholar]
- Stuart G, Spruston N, Sakmann B, Häusser M. Action potential initiation and backpropagation in neurons of the mammalian CNS. Trends Neurosci. 1997;20:125–131. doi: 10.1016/s0166-2236(96)10075-8. [DOI] [PubMed] [Google Scholar]
- Traub RD, Wong RKS, Miles R, Michelson H. A model of CA3 hippocampal pyramidal neuron incorporating voltage-clamp data on intrinsic conductances. J Neurophysiol. 1991;66:635–650. doi: 10.1152/jn.1991.66.2.635. [DOI] [PubMed] [Google Scholar]
- Wang XJ. Multiple dynamical modes of thalamic relay neurons: rhythmic bursting and intermittent phase locking. Neuroscience. 1994;59:21–31. doi: 10.1016/0306-4522(94)90095-7. [DOI] [PubMed] [Google Scholar]
- Wang XJ. Calcium coding and adaptive temporal computation in cortical pyramidal neurons. J Neurophysiol. 1998;79:1549–1566. doi: 10.1152/jn.1998.79.3.1549. [DOI] [PubMed] [Google Scholar]
- Wang XJ, Liu YH, Sanchez-Vives MV, McCormick DA. Adaptation and temporal decorrelation by single neurons in the primary visual cortex. J Neurophysiol. 2003;89:3279–3293. doi: 10.1152/jn.00242.2003. [DOI] [PubMed] [Google Scholar]
- Wu N, Enomoto A, Tanaka S, Hsiao CF, Nykamp DQ, Izhikevich E, Chandler SC. Persistent sodium currents in mesencephalic V neurons participate in burst generation and control of membrane excitability. J Neurophysiol. 2005;93:2710–2722. doi: 10.1152/jn.00636.2004. [DOI] [PubMed] [Google Scholar]