

Abstract
We present and validate a novel diffusion tensor imaging (DTI) approach for segmenting the human whole-brain into partitions representing grey matter (GM), white matter (WM) and cerebrospinal fluid (CSF). The approach utilizes the contrast among tissue types in the DTI anisotropy vs. diffusivity rotational invariant space. The DTI-based whole-brain GM and WM fractions (GMf and WMf) are contrasted with the fractions obtained from conventional magnetic resonance imaging (cMRI) tissue segmentation (or clustering) methods that utilized dual echo (proton density-weighted (PDw), and spin-spin relaxation-weighted (T2w) contrast, in addition to spin-lattice relaxation weighted (T1w) contrasts acquired in the same imaging session and covering the same volume. In addition to good correspondence with cMRI estimates of brain volume, the DTI-based accurately depicts expected age vs. WM and GM volume-to-total intracranial brain volume percentage trends on the rapidly developing brains of a cohort of 29 children (6–18 years). This approach promises to extend DTI utility to both micro and macrostructural aspects of tissue organization.
Keywords: DTI, Segmentation, Icosa21, Child Brain Development, Meta Analysis
Introduction
Diffusion tensor imaging (DTI) provides noninvasive orientation based tissue contrast mechanisms and complements relaxation based conventional MRI (cMRI) methods. DTI scalar and orientation maps can provide information about the tissue microstructural integrity in both health and disease. The DTI-derived rotational invariant metrics, including the local tissue eigenvalues and the corresponding anisotropy indices and mean diffusivity, have been utilized in several applications in clinical psychology, neuropsychiatry, neurology, and radiology (Pierpaoli et al, 1996; see Hasan, 2006 for extensive review of literature). In particular, DTI applications to the developing child brain in health and disease offers a unique opportunity to understand the organization of the brain during transition to adolescence and adulthood (Simon et al., 2005). Despite known limitations, at the current stage of DTI technology it seems that echo-planar imaging (EPI) is the mainstay in multidimeniosnal MRI acquisitions that include diffusion-weighted imaging (DWI) and its DTI extension, relaxometry, functional and perfusion MRI (Le Bihan et al., 1995). EPI time-efficiency, motion insensitivity, reduced specific absorption rates (SAR) and recent improvements (Bammer et al., 2002; Wang et al. 2005; Jaerman et al., 2005) make it attractive for mapping brain-structure and function relations. A typical whole-brain high spatial and angular resolution DTI acquisition can be accomplished in under 7 minutes at 3.0 T. Advances in high field technology, parallel imaging, novel coil design and image quality improvements (gradient hardware) promise to make DTI extremely useful for imaging neonates, infants, children and the elderly in both health and disease where exam time is crucial (Dubois et al., 2006; Gupta et. al., 2005; Maas et al., 2005; Mckinstry et al., 2002).
The application of conventional MRI contrast methods to brain tissue segmentation is a well-established set of procedures that provides regional (Shaw et al., 2006; Sowell et al. 2003) or global surrogate markers of development (Castellanos, et al. 2002; Giedd et al. 1999; Matsuzawa et al. 2001; De Bellis, 2001), natural aging (Courchesne et al., 2000; Good et al. 2001; Sowell et al., 2003; see Table 1), and their interactions with neurodevelopmental and neurodegenerative pathologies (Bartzokis et al., 2002; Brunetti et al., 2000; Castellanos et al., 2002; Eliez et al., 2001; Prinster et al., 2006; Simon et al. 2005; Zhang and Sejnowski, 2005; Wilde et al., 2005). To attain soft brain tissue segmentation, multispectral data volumes are acquired in the same session and coregistered to maximize the information content and seperability of tissue clusters (Pham et al, 2000; Good et al., 2001). Tissue segmentation using cMRI requires radio frequency field inhomogeniety correction of the masked and co-registered volumes (Rajapakse et al., 1996a; Good et al., 2001; see Table 1). MRI contrast-to-noise ratio per unit scanning time between tissue types reflects a complex interplay and compromise between intrinsic tissue and extrinsic parameters (Le Bihan, 1995; Conturro et al., 1995). However, confounding variables such as age can make cMRI protocols harder to maintain if a wide age span is included (Chard et al. 2002; Guttmann et al, 1998; Inglese and Ge 2003; Matsuzawa et al., 2001).
Table 1. Key Publications using MRI volumetry of the normal human whole-brain (WB).
| Study | Pop. N, Gender | Age Range MN±SE yrs | Method | Regions | GMf WMf CSFf *100 (%) | GM WM CSF(mL) | GM/WM ratio ~ | Age vs. Tissue Type Trend (r(p) / slope) |
|---|---|---|---|---|---|---|---|---|
| Ben2006 | 89
39M 50F |
11–76
43.6 |
1.5T
5mm×24 axial |
WB | NA | 730
780 |
0.94
(NI) |
GM ↓ 2.8 ml/yr
WM ↓ 1.1 ml/yr CSF NA |
| Bru2000 | 55
24M 31F |
16–76 | 1.5T
4mm×30 axial |
WB | 56
39 4 |
NA | 1.43 | GMf −0.68(0.00001) ↓
WMf not significant CSFf 0.66 (0.00001) ↑ |
| Cas2002 | 139
56F 83M |
4.5–19 yrs
(10.5±3.2) |
1.5T
1.5mm axial |
Cereb | 66
34 |
728±74
377±50 |
1.93 | NA |
| Cav1996 | 30
15M 15F |
7–11
9 |
1.5T
3.1mm × 60 axial |
WB/Cereb | 58
29 13 |
761
380 171 |
2.0 | GM NA
WM ↑ CSF NA |
| Cha2002 | 27
13M 14F |
23.2–55.2
36.1 |
1.5T
1.5mm×124 T1w axial |
WB | 55.5
26 17.5 |
750±56
356±32 237 |
2.1 | NA |
| Cou2000 | 116
79M 37F |
19m–80 yrs
21.4±20 |
1.5T
3mm axial |
WB | 59
29 12 |
805
400 150 |
2.12±0.5 | GM ↓ −0.75(0.001)
WM ↑↓ (peak ~ 40–50 yrs) CSF ↑ 0.85(0.001) |
| Eli2001 | 85
21M 64F |
4–19
10.2±3.8 |
1.5T
5mm axial |
WB | 54
38 8 |
655±74
455±73 100±26 |
1.44 | GM ↓
WM ↑ CSF ↑ |
| Ge2002 | 54
22M 32F |
20–86
46.8±19.3 |
1.5T
3mm 50sl axial |
WB | 50
35 14 |
680±102
478±72 188 |
1.45 | GMf ↓ −0.57 (0.0001)
WMf ↑↓ −0.35 (0.009) CSFf NA |
| Giedd1999 | 145
89M 56F |
4.2–21.6 | 1.5T
1.5mm3daxial |
WB | 55
28 17 |
730
380 225 |
1.92 | GM NA
WM ↑ 12.4% CSF NA |
| Giedd2004 | 161
95M 66F |
4.2–21.6 | n/a | Cereb | NA | 727
383 |
1.90 | GM ↓
WM ↑ CSF NA |
| Good2001 | 465
265M 200F |
17–79 | 2.0T
1.5mm×120 sagmp-rage |
WB | 48
26 25 |
788
424 399 |
1.85 | GM ↓ R²=0.48
WM ↑↓ R²=0.33 CSF ↑ R²=0.38 |
| Gur1999 | 80
40M 40F |
18–45
26±5.6 |
1.5T
5mm axial |
WB | 53
39 8 |
663
483 102 |
1.37 | GM ↓ −0.26 (0.01)
WM NA CSF NA |
| Gut1998 | 72
22M 50F |
18–81 | 1.5T
3mm Dual axial |
WB | 47
36 11 |
1.31 | GM ↓ −0.44(0.46)
WM ↓ −0.084(0.07) CSF ↑ 0.996(0.0003) |
|
| Jer2001 | 78
37M 41F |
30–99
64±17.4 |
1.5T
4mm coronal |
Cereb | NA | NA | NA | GM r = −0.53(0.001)
WM r = − 0.63(0.001) CSF r = 0.74(0.001) |
| Mat2001 | 34
17M17F |
1m–26yrs | 1.5T
1mm×155 axial |
WB | 55
31 14 |
675
375 175 |
1.8 | GM ~↑
WM ↑ CSF~↑ |
| Nop2000 | 84
42M 42F |
19–31
23.3±2.2 |
1.5T
2mm coronal |
WB
(no cerebellum) |
55
38 7 |
708
483 84.5 |
1.47 | NA |
| Pfe1994 | 161 | 3m-70yrs | NA | WB | NA | NA | 2.0 | GM ↓ 0.7 (mL/yr)
WM ↑, CSF ↑ 0.6 |
| Quar2003 | 54
22M 32F |
16–70
38.5 ±13.1 |
1.5T
4mm axial |
WB | 53%
38% 9% |
NA | 1.41 | GM ↓ −0.43(0.001)
WM no change CSF ↑ 0.47(0.001) |
| Raj1996b | 105
56M 49F |
4–18
11.4±3.5 |
1.5T
1.5mm×124 axial |
WB
Shelling No CS F |
54
44 |
NA | 1.23 | GM ↓
WM ↑ |
| Sim2005 | 18
11M 7F |
7.5–14.2
10.4±2 |
1.5T
1mm×160 sag;mp-rage |
WB | 56
28 16 |
763
379 223 |
2.01 | NA |
| Sow2003 | 176
86F 90M |
7–87 yrs
32±22 |
1.5T
1.2mm×124 axial |
WB | 58
32 10 |
825
460 150 |
1.79 | GM ↓
WM ↑↓ peak ~ 40–50 yrs CSF ↑ |
| Tede2005 | 104 | 20–50 | 1 T
4mm×30 axial |
53
35 12 |
1.51 | NA | ||
| Wil2005 | 16
8M 8F |
9–16.4
12.8±2.4 |
1.5T
1mm T1w 1.5mm T2w sagittal |
WB | 69
25 6 |
884±77
333±71 72±33 |
2.65 | NA |
| This Study |
29
14M,15F 25R/4L |
7.2–16.7
11.4±3.1 med=11.4 |
3.0T
3mm×44 DTI-epi |
WB |
61±31
33±3.3 6 ±1.7 |
913±81.4
494±68 97±27 |
1.88±0.26 |
GM ↓ −0.48 (0.008)
WM ↑ 0.35 (0.06) CSF 0.17 (0.38) |
Data reported from healthy control human brains. Studies are listed alphabetically by leading author last name and year. Underlined studies covered the entire human life span. The up and down arrows summarize the reported trends; the up-down arrows indicate a parabolic (rise-plateau and decay trends). M=males; F=females, m=month, yrs=years; GM=grey matter, WM=white matter; WB=whole brain, mL= cm3; NA=not available; NI=not included in the group mean vs. age GM/WM regression in Fig 4.)
There are many published works on the natural aging of the human brain. Due to the use of continuously improving acquisition, spatio-temporal parameters and processing paradigms, it is noteworthy that there are discrepancies in the published works on the developing healthy brain using cMRI (see Table 1). Comparison across these studies can be difficult as the brain coverage may vary and many studies have used different slice thickness/skip and acquisition parameters. Nonetheless, these studies consistently document age-related changes in the regional tissue composition of the brain. In general, to account for variability in the healthy and normal human brain size due to skull size and gender, it is widely recommended to scale the absolute volume of tissues with respect to the intracranial volume (ICV) (Good et al., 2001; Rajapakse et al., 1996a,b). For example, there are at least two major cross-sectional studies that covered the entire human life span and provided consistent estimates of the trends observed in the developing human brain from childhood till late adulthood (Courchesne et al., 2000; Sowell et al., 2003). Consistent with other reports (see Table 1), the whole-brain grey matter fraction (GMf) decreases with age and white matter fractions (WMf) increases during childhood, reflecting the continued myelination and axonal elimination or caliber size changes with age (see Table 1 for more details). However, as Table 1 shows there is considerable variability in the tissue fractions yielded by the cMRI methods, which undoubtedly due to variations in segmentation procedures, imaging acquisition parameters and other factors (see Table 1).
The application of DTI contrast to soft brain tissue clustering was initially described by Pierpaoli et. al. (1996). More recently, DTI methods have been applied to segment the thalamic nuclei (Wiegell et al. 2003), the thalamocortical projections (Behrens et al., 2003), the fetal brain (Maas et al. 2004), and the human corpus callosum (Hasan, 2006). Many recent DTI-based clustering strategies have also been described (Lenglet et al. 2006; Liu et al. 2006; Wang and Vemuri, 2005). The incorporation and fusion of cMRI contrasted maps, DWI, DTI-derived metrics “mean diffusivity and anisotropy” in tissue segmentation and applications have also been described on humans (Jones et al. 1999; Hadjiprocopis et al., 2005) and rodent brains (Ali et al., 2005; Carano et. al. 2000).
In this paper, we present and validate an application of whole-brain DTI to tissue segmentation of the developing healthy human child and adolescent brains; thus, extending the benefits of DTI to include the provision of regional and global atrophy micro- and macrostructural metrics that can be used in combination with region-of-interest and fiber based tracking methods to monitor the brain-behavior relations. We validate the DTI-based results against estimates from cMRI and against age to determine if the expected patterns of developmental change emerge.
Materials and methods
Participants
The participants included 15 girls and 14 boys (age range, mean ± SE = 7–17, 11.4 ± 3.1 years); 25/29 children were right-handed. The male and female groups did not differ in age (p=0.35). All children were primarily English-speaking, were identified as neurologically normal by review of medical history and were medically stable at the time of the assessments. All scans were read as “normal” by a board certified radiologist (LK). Written informed consent was obtained from the guardians and adolescents and assent from the children participating in these studies per the University of Texas Health Science Center at Houston institutional review board regulations for the protection of human research subjects.
MRI Data Acquisition
We acquired whole-brain data using a Philips 3.0 T Intera system with a SENSE parallel imaging receive head coil. The MRI protocol included (a) conventional MRI (3d spoiled gradient-echo, field-of-view=240×240 mm2 (isotropic voxel size = 0.9375 mm) and (b) 2d dual spin-echo images TE1/TE2/TR=10/90/5000 ms, in the axial plane (3mm slice thickness, square field-of-view=240×240 mm2 @ 44 sections) (c) phase-sensitive MRI in the sagittal and axial planes, in addition to a matching prescription of axial diffusion-encoded data as described below.
Diffusion Tensor Acquisition
The diffusion-weighted data were acquired using a single-shot spin echo diffusion sensitized echo-planar imaging (EPI) sequence with the balanced Icosa21 encoding scheme (Hasan, 2006; Hasan and Narayana 2003; 2006), a diffusion sensitization of b=1000 sec.mm−2, a repetition and echo times of TR=6.1 s, TE= 84 ms, respectively. EPI image distortion artifacts were reduced by using a SENSE acceleration factor or k-space undersampling of R of two (Bammer et. al., 2002; Hasan and Narayana, 2006; Jaermann et al., 2004). The slice thickness was 3 mm with 44 axial slices covering the whole-brain (foramen magnum to vertex), a square field-of-view=240×240 mm2, and an image matrix of 256×256 that matched the 3d-SPGR (spoiled gradient or field echo) and 2d conventional MRI dual spin echo sequences described above. The number of non-diffusion weighted or b~0 magnitude image averages was 8; in addition, each encoding was repeated twice and magnitude-averaged to enhance the signal-to-noise ratio (SNR) (Conturo et al., 1995); thus, effectively 50 images were acquired for each of the 44 axial sections to cover the whole-brain. The total DTI acquisition time was approximately 7 minutes and resulted in SNR-independent DTI-metric estimation (in brain parenchyma --grey and white matter tissue); SNR (b~0) ~ 50–60, SNR (DWI) ~ 20–30) which gave reproducible results.
Conventional MRI Data Processing and Tissue Segmentation
The whole-brain cMRI data (i.e 3d SPGR and 2d dual-echo) were converted into ANALYZE formatted volumes (T1w, PDw & T2w) and skull stripped using MRIcro software package which has the brain extraction tool. Using SPM99 (see Good et al., 2001), the PDw and T2w images were coregistered and resliced to their corresponding T1w volumes. Following recommendations by Simon et al. (2005), the Cincinnati Children’s Hospital Medical Center, (CCHMC, Cincinnati, OH) pediatric brain template was obtained and the T1w images were spatially normalized to the same stereotactic space by registering each of the images to the CCHMC template. Average PDw and T1w brain templates were created in SPM2 as suggested by Good et al. (2001). Following the template formation, automated tissue segmentation was performed on the PDw and T2w images in addition to the T1w using their respected templates. Tissue volumes were calculated from the segmented volumes as suggested elsewhere (Good et al, 2001; Simon et al., 2005).
DTI Data Processing
Although the DTI raw images were acquired with fat suppression, all image volumes were semi-automatically stripped to remove non-parenchymal tissue. Diffusion-weighted data were distortion-corrected using the mutual information maximization approach (Netsch and Van Muisvinkel, 2004). The details of the DTI processing are provided elsewhere (Hasan, 2006).
DTI-derived Metrics
The DTI-derived rotationally-invariant metrics used are the parallel (λ||=λ1) and transverse diffusivity (λt). The transverse (perpendicular) diffusivity was defined as the mean of the minor (third) and medium (second) eigenvalues (λt = λ⊥ = (λ2+λ3)/2) (Beaulieu, 2002; Hasan and Narayana, 2006; Song et al., 2005). The fractional anisotropy (FA) and mean diffusivity (Dav) are computed using the eigenvalues as:
| [1] |
| [2] |
Notice that FA is scale-independent (i.e. FA(cλ1; cλ2 cλ3) = FA). The apparent diffusivities are generally estimated by log-linear algebraic transformations (Basser et al., 1994) or by the moments of the log-transformed apparent diffusion coefficients (Ackerman, 2003; Arfanakis et al, 2002; Frank, 2001; Hasan and Narayana, 2003). This log-linear decoupling of intensity makes anisotropy indices more immune to local intensity modulations due RF field excitation inhomogenieties (Bammer et al., 2002).
Region-of-Interest and DTI Feature Space Formation
The regions-of-interest derived from the analysis represented 50 “normally appearing” white matter structures, grey matter structures and ventricular CSF. The structures included the right-left (contralateral) caudate head, putamen, internal capsule (anterior, external, posterior limb), corpus callosum segments (see Figure 1), corticospinal tract, forceps minor and major, inferior and superior longitudinal fasciculi and arcuate fasciculus and other grey (cortical, hippocampal) and white matter structures (cerebellar, peduncular). The compact white matter structures belonged to three major categories: commissural, association, and projection fibers that are involved in inter and intra-hemispheric communication. The ROI placement and fiber tracking procedures were done by trained raters and used anatomical landmarks from the conventional MRI sets (sagittal phase-sensitive inversion recovery). The ROI placement procedure was supervised by a radiologist and used a sophisticated three-dimensional system that fused DTI maps with conventional high resolution anatomical MRI (Hasan, 2006); this procedure was shown to help reduce partial averaging artifacts due to CSF. From these ROIs, a feature space was created to determine the tissue classification thresholds (see Figure 1).
Figure 1.

Illustration of the formation of the DTI metric (mean diffusivity vs. fractional anisotropy) training feature space on all children. The scatter plot shows the FA vs. Dav two dimensional space on 50 manually selected ROIs that span the whole-brain white matter fiber networks (association, projection, and commissural), grey matter (cortical and basal ganglia) and ventricular CSF.. For scanner temporal stability and quality assurance, the scatter plot also includes the DTI (FA vs. Dav) results on the entire isotropic water phantom collected using the same protocol over the time span of acquisition of the data on controls. Notice the ability to classify the different tissue types in this space
DTI based Tissue Segmentation
The collected ROI DTI metrics and their corresponding errors were further used in a multidimensional supervised and trained feature space initiated clustering procedure to segment the whole-brain (cerebrum, brain stem and cerebellum) tissue into three tissue types: white matter, grey matter and cerebrospinal fluid (CSF). The method uses the contrast in FA maps between CSF, white matter, and grey matter and the cluster separability and discriminability of white matter and grey matter based on the principal diffusivity indices. The CSF was segmented based on its high diffusivity and low anisotropy (Pierpaoli et al., 1996; Hasan, 2006).
Statistical analysis
Group mean comparisons were made using the t-test for unpaired groups: within group comparisons were conducted using paired t-tests. Alpha levels were adjusted for the number of dependent univariate tests M=3 (GM, WM & CSF) (p < 0.05/M). Correlations with age were based on the Pearson coefficient (Glanttz, 2002; Howell, 2006). For reproducibility studies on the same rater, same subjects, and SNR measurements we have used the intraclass indices (ANOVA), paired student t-test and the Bland-Altman bias analysis as described elsewhere (Glantz 2002; Hasan, 2006). Meta statistical analyses of published reports were conducted as described elsewhere (Hedges, 1985; Hunter and Schmidt, 2004)
Data Quality and Reproducibility
Since the data from all healthy control children were collected over a one-year span at high SNR, we collected, using identical protocols a database of water phantom measurements, healthy adult controls to assure the field uniformity and stability of the MRI scanner. The diffusion encoding (Icosa21b) provided three levels of SNR and hence the SNR dependence of the DTI-metrics and estimates (fiber tracks, group comparisons, correlations) reported in this work were also studied on all subjects. The DTI feature space generated by carefully placed ROIs was invariant to rating as judged by the intraclass correlation coefficient.
Results
Illustration of the DTI based feature Space
Figure 1 illustrates the formation of the tissue clustering borders using the FA vs. mean diffusivity space. We have also included results from the entire spherical water phantom measurements acquired using the same DTI protocol over the time span of the brain studies. Notice the stability and reproducibility of our studies as judged by the insignificant spread of water phantom DTI-metric measurements over a one year span. The GM, WM and CSF are separable using this two dimensional feature space at the selected high SNR and spatial resolution working levels.
Comparison of DTI segmentation with cMRI methods
Figure 2 shows a group mean comparison of the DTI results and cMRI results on all healthy controls. Notice that although the approaches yielded roughly comparable estimates, the differences are statistically significant (p<0.01) using post-hoc paired comparisons (see Table 2 for more quantitative details). However, both the DTI and cMRI methods gave group means comparable consistent with published results on children (see Table 1). The DTI measured volume tend to be higher for GM and lower for WM but are largely consistent with many of the studies on children listed in Table 1, yielding a GMf of ~ 0.6. Our results are particularly convergent with more recent studies (e.g. Sowell et al. 2003; Castellanos et al. 2002; De Bellis, 2001).
Figure 2.
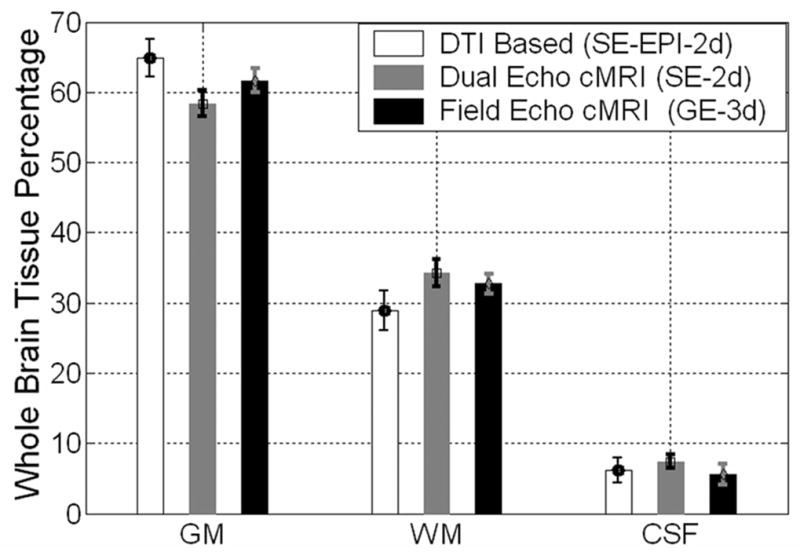
Group comparison of three different approaches used in tissue segmentation of the whole-brain (a) DTI based and (b) cMRI based using the 2d dual echo and (c) using the 3d spgr data sets. The ANOVA tests and ad hoc follow-up paired comparisons indicated that the three methods are comparable but differed significantly (p<0.01). The sources of the variability in the DTI approach as function of age is analyzed in Figure 3.
Table 2. Detailed group mean, age correlations and rate of change comparisons between the three methods used.
| N=28 | cMRI-2d Dual Echo Method 1 | cMRI-3d SPGR Method 2 | DTI-segmentation Method 3 |
|---|---|---|---|
| μ±σ (GMf ) p Group Means paired t-test | 0.5838 ± 0.0178
p(1,3)=0.001 |
0.6169 ± 0.0174
p(1,2)<1e-5 |
0.6074 ± 0.0305
p(2,3)=0.10 |
| μ±σ (WMf) | 0.3424±0.0198
p(1,3)= 0.07 |
0.3281± 0.0131
p(1,2)= 0.0005 |
0.3291 ± 0.0323
p(2,3)= 0.87 |
| μ±σ (GM/WM) | 1.7131 ± 0.1447
p(1,3)= 0.009 |
1.8847 ± 0.1130
p(1,2) < 1e-5 |
1.8696 ± 0.2609
p(2,3)= 0.76 |
| r (GMf, age)& p | −0.1916 (0.33)
p(1,3)=0.21 |
−0.2234(0.25)
p(1,2)= 0.91 |
−0.4969(0.007)
p(2,3)= 0.26 |
| r (WMf, age) & p | 0.1294(0.51)
p(1,3)=0.28 |
0.2076(0.29)
p(1,2)=0.78 |
0.4088(0.03)
p(2,3)=0.43 |
| r (GM/WM) & p | −0.1532(0.44
) p(1,3)=0.18 |
−0.2424(0.21)
p(1,2)=0.74 |
−0.4899(0.008)
p(2,3)= 0.31 |
| β ± σ(β) (GMf, age) | −0.0011 ± 0.0011
p(1,3)=0.06 |
−0.0013 ± 0.0011
p(1,2)=0.90 |
−0.005 ± 0.0017
p(2,3)=0.07 |
| β ± σ(β) (WMf, age) | 0.0008 ± 0.0013
p(1,3)= 0.28 |
0.0009 ± 0.0008
p(1,2)=0.95 |
0.0043 ± 0.0029
p(2,3)=0.26 |
| β ± σ(β) (GM/WM) | −0.0073 ± 0.0092
p(1,3)= 0.05 |
−0.0090±0.0071
p(1,2)=0.88 |
−0.0421 ± 0.0147
p(2,3)=0.05 |
- The subjects (N=28) are the same included in Figure 1 (one female subject 1/29 was excluded as the cMRI segmentation results were not feasible)
- GMf=GM/ICV & WMf=WM/ICV (volume fractions to total intracranial volume are used to account for variability due to gender and brain size at equal age).
- The correlation ( r ) is the Pearson coefficient. The slope β for the least squares regression (rate of change of y = GMf, WMf or GM/WM per unit x = age in years can also be computed from r as (x=age (μ±σ) = 11.2 ± 3.0; N=28)
- All possible post hoc paired comparisons between the three methods (1, 2&3) are two-tailed. The paired t-test is used for group comparisons (1,3; 2,1 & 3,2).
- The age-correlation (r) and rate (β) comparisons are done as described in Glantz (2002) and Howell (2006).
The cMRI methods were generally less sensitive to age variation compared to the DTI approach (see Table 2 for detailed summary and comparisons). To investigate the origin of the group variance in the DTI based method we plotted the GMf, WMf, total intracranial volume and GM-to-WM ratio as function of age (Figure 3). The DTI based group mean whole brain volume partitions in cm3 (mL) were found to be (GMv = 913±81, WMv= 494± 68, CSFv= 97±27 cm3; N=29), group fraction means ± SE: (GMf = 60.7 ± 3.1, GMf = 32.9 ± 3.3, CSFf = 6.4 ± 1.7) and age trends: r(age, GMf; p) = (−0.48; 0.008), r(WMf, age;p) =0.35;0.06), r(CSFf, age;p) = (0.145; 0.47). Notice the ability of the DTI approach to capture the predicted trends (see Table 1 for an extensive comparison). The DTI-segmented whole-brain fractions (GMf, WMf & CSf) and age trends were not significantly different between the age-matched males and females in our sample. The cMRI published or non-DTI based (Table 1) GM-to-WM volume ratios are shown in Figure 4 as function of the population mean age (see Table 1), and contrasted with our own results. A meta analysis (Hedges 1985; Hunter and Schmidt 2004) of the 22 cMRI published quantitative reports incorporating age of the population (Table 1) on the gray matter fractions provided the regression equation GMf = 0.67 - 0.00187 * Average Age; r=-0.245, p<0.03). Our DTI segmentation results are consistent with published results on both mean values and rate of change of GMf and WMf (Rajapakse et al., 1996; see Table 1).
Figure 3.

The scatter plots and least squares linear regression fits of age vs. (a) GMf and (b) WMf as obtained using the DTI-based tissue segmentation approach. The age vs. total intra cranial volume and grey-to-white matter volume ratios are shown in c and d respectively. Notice (a) the decrease in GMf, (b) increase in WMf, (c) the variability of the ICV due to variations in head size and gender and (d) the global decrease in GM/WM ratio (or corresponding whole-brain fractions) as function of age. The correlation coefficient and corresponding p values are also shown.
Figure 4.

A scatter plot showing the mean population age in years vs. the whole-brain GM/WM volume ratio reported in 22 quantitative studies summarized in Table 1 on both children, young and older adults. The least-squares linear regression fit predicts a steady decrease in the GM/WM ratio vs. age relation (our study result is also shown; see also Figure 3d and the underlined entire life span studies in Table 1).
Discussion
In this report, we described and applied for the first time a novel automated approach for tissue segmentation that is based on intrinsic rotationally-invariant and coregistered metrics derived from the DTI data. The approach is based on deterministic and trained feature space (Figure 1) derived on a population of subjects using the same high SNR protocol. The simple approach presented and used can also be adapted for more regionally driven segmentation and to incorporate more established statistical and probabilistic segmentation methods (Ali et al., 2005; Lenglet et al. 2006; Liu et al. 2006; Maas et al. 2004; Wang et al. 2005; Wiegell et al. 2003). We have validated the approach using a cohort of developing child and adolescent brains and found that the whole brain GM and WM fractions derived and the corresponding rate of change per unit year are comparable to published trends (see meta analysis results above, Table 1, 2; Figs 2–4), and to estimates based on two alternative methods based on cMRI. The two cMRI methods also yielded significantly different estimates of tissue fractions even though they were based on the same brains, image acquisition sequences, and normalized to the same template (see Table 2). Thus, the differences across methods cannot be attributed to the DTI method alone. This DTI approach can be fused with cMRI methods or used, for example, as a first pass segmentation to evaluate the needed thresholds for compact white matter fiber tracking. We have tested this approach using optimally designed encoding schemes that were shown to have minimal rotational variance and biases in the estimation of grey and white matter DTI metrics (Hasan, 2006; Hasan and Narayana 2006). Our approach used the DTI-derived eigenvalues and the corresponding scalar maps such as mean diffusivity and FA.
Since DTI requires high signal-to-noise ratios (SNR) and high spatial accuracy to distinguish white-grey matter tissue boundaries, the estimation of anisotropy in grey matter, in particular, is expected to be problematic (Conturo et. al., 1995; Hasan and Narayana, 2003; Le Bihan, 1995; Pierpaoli et al., 1996). This problem is mitigated by the use of rotationally-invariant encoding schemes at high SNR as implemented in this paper. The entire DTI scan took 7 minutes, which is tolerable by most children, young and older adults. In special situations when imaging sedated children or uncooperative subjects, the optimized DTI data set would provide both microstrutural and macrostructural information, so that the approach presented here offers an efficient use of available scan time. The DTI data acquired did not undergo any further special steps as all data were coregistered as part of the DTI processing pipeline. Additional advantages of the DTI approach over multi-modal cMRI include (I) the use of high SNR isotropically distributed and rotationally invariant diffusion encoding scheme (Hasan and Narayana 2003; Pierpaoli et al., 1996), (II) the use of reduced image distortions following the adoption of parallel imaging (Bammer et al., 2002; Jaerman et al., 2005), (III) the utility of intrinsic tissue diffusion based contrast in the self-registered DTI maps, and (IV) the fact that DTI processing involves decoupling of radio frequency inhomogeniety field related intensity variations which are common in conventional MRI based approaches (Bammer et al., 2002; Rajapakse et al., 1996a,b; Table 1 references). The whole-brain GM, WM and CSF fractions found using this approach are consistent with published reports using validated multispectral cMRI approaches on children, adolescents (Castellanos et al., 2002; Corchesne et al. 2000; Giedd et al., 1999; Giedd et al, 2004; Simon et al., 2005; Sowell et al. 2003; Wilde et al. 2005; Table 1) and the smooth transitions from birth to childhood (Matsuzawa et al., 2001) and the universal transition to adulthood (Ge et al., 2002; Ingelese and Ge 2004; Corchesne et al. 2000; Sowell et al., 2003; see also Table 1).
GM/WM ratios across cMRI studies of children and adolescents show marked variability, ranging from 1.23 to 2.65. Despite this variability, the DTI-based GM/WM ratio of our normally developing sample was 1.88, which closely fit the age-adjusted regression line for all studies and provided further support for the validity of our approach (see Fig. 4 and Table 2). In contrast to the cMRI segmentation solutions, the DTI volumetry metrics were sensitive to age-related variation that reflects the dynamic progressive and regressive neural processes regulating axonal and dendritic development and connectivity. This sensitivity represents a significant advantage for studies of developmental changes in tissue microstructure and macrostructure. DTI-based volumetry also has potential to enhance understanding of changes in tissue composition in clinical populations due to interactions of developmental changes with injury or disease processes
It is also noteworthy that the partial averaging in the voxel and SNR related biases in DTI can be studied further as function of spin history preparation (CSF fluid, GM or WM attenuation), encoding, slice thickness, or the b-factor. For example, the encoding scheme adopted in our work (Icosa21b) can provide independent rotationally-invariant data sets (Icosa6 and Icosa15) at different SNR values using the same data (Hasan and Narayana, 2003), and hence some sensitivity analysis can be conducted to show the SNR performance of this approach both regionally and globally. These studies will be reported in a future communication.
Acknowledgments
This work is funded by NICHD grants, P01 HD35946 awarded to JF and NINDS grant R01 NS046308 awarded to LEC, and NIH R01 NS052505 awarded to KMH. Christopher Halphen was funded in part by the Summer Research Program, UTHSC at Houston Medical School and the Dunn research foundation. We wish to thank Vipul Kumar Patel for helping in data acquisition.
Footnotes
Publisher's Disclaimer: This is a PDF file of an unedited manuscript that has been accepted for publication. As a service to our customers we are providing this early version of the manuscript. The manuscript will undergo copyediting, typesetting, and review of the resulting proof before it is published in its final citable form. Please note that during the production process errors may be discovered which could affect the content, and all legal disclaimers that apply to the journal pertain.
References
- 1.Ali AA, Dale AM, Badea A, Johnson GA. Automated segmentation of neuroanatomical structures in multispectral MR microscopy of the mouse brain. Neuroimage. 2005;27:425–435. doi: 10.1016/j.neuroimage.2005.04.017. [DOI] [PubMed] [Google Scholar]
- 2.Ackerman EM. Efficient measurement and calculation of MR diffusion anisotropy images using the Platonic variance method. Magn Reson Med. 2003;49:599–604. doi: 10.1002/mrm.10365. [DOI] [PubMed] [Google Scholar]
- 3.Arfanakis K, Cordes D, Haughton VM, Carew JD, Meyerand ME. Independent component analysis applied to diffusion tensor MRI. Magn Reson Med. 2002;47:354–363. doi: 10.1002/mrm.10046. [DOI] [PubMed] [Google Scholar]
- 4.Bammer R, Auer M, Keeling SL, Augustin M, Stables LA, Prokesch RWStollberger R, Moseley ME, Fazekas F. Diffusion tensor imaging using single-shot SENSE-EPI. Magn Reson Med. 2002;48:128–136. doi: 10.1002/mrm.10184. [DOI] [PubMed] [Google Scholar]
- 5.Bartzokis G, Beckson M, Lu PH, Edwards N, Bridge P, Mintz J. Brain maturation may be arrested in chronic cocaine addicts. Biol Psychiatry. 2002;51:605–611. doi: 10.1016/s0006-3223(02)01315-x. [DOI] [PubMed] [Google Scholar]
- 6.Basser PJ, Mattiello J, LeBihan D. Estimation of the effective self-diffusion tensor from the NMR spin echo. J Magn Reson B. 1994;103:247–254. doi: 10.1006/jmrb.1994.1037. [DOI] [PubMed] [Google Scholar]
- 7.Beaulieu C. The basis of anisotropic water diffusion in the nervous system - a technical review. NMR Biomed. 2002;15:435–455. doi: 10.1002/nbm.782. [DOI] [PubMed] [Google Scholar]
- 8.Behrens TE, Johansen-Berg H, Woolrich MW, Smith SM, Wheeler-Kingshott CA, Boulby PA, Barker GJ, Sillery EL, Sheehan K, Ciccarelli O, Thompson AJ, Brady JM, Matthews PM. Non-invasive mapping of connections between human thalamus and cortex using diffusion imaging. Nat Neurosci. 2003;6:750–757. doi: 10.1038/nn1075. [DOI] [PubMed] [Google Scholar]
- 9.Benedetti B, Charil A, Rovaris M, Judica E, Valsasina P, Sormani MP, Filippi M. Influence of aging on brain grey and white matter changes assessed by conventional, MT, and DT MRI. Neurology. 2006;66:535–539. doi: 10.1212/01.wnl.0000198510.73363.c6. [DOI] [PubMed] [Google Scholar]
- 10.Brunetti A, Postiglione A, Tedeschi E, Ciarmiello A, Quarantelli M, Covelli EM, Milan G, Larobina M, Soricelli A, Sodano A, Alfano B. Measurement of global brain atrophy in Alzheimer’s disease with unsupervised segmentation of spin-echo MRI studies. J Magn Reson Imaging. 2000;11:260–236. doi: 10.1002/(sici)1522-2586(200003)11:3<260::aid-jmri4>3.0.co;2-i. [DOI] [PubMed] [Google Scholar]
- 11.Carano RA, Li F, Irie K, Helmer KG, Silva MD, Fisher M, Sotak CH. Multispectral analysis of the temporal evolution of cerebral ischemia in the rat brain. J Magn Reson Imaging. 2000;12(6):842–58. doi: 10.1002/1522-2586(200012)12:6<842::aid-jmri7>3.0.co;2-5. [DOI] [PubMed] [Google Scholar]
- 12.Castellanos FX, Lee PP, Sharp W, Jeffries NO, Greenstein DK, Clasen LS. Developmental trajectories of brain volume abnormalities in children and adolescents with attention-deficit/hyperactivity disorder. JAMA. 2002;288:1740–1748. doi: 10.1001/jama.288.14.1740. [DOI] [PubMed] [Google Scholar]
- 13.Chard DT, Parker GJ, Griffin CM, Thompson AJ, Miller DH. The reproducibility and sensitivity of brain tissue volume measurements derived from an SPM-based segmentation J methodology. Magn Reson Imaging. 2002;15:259–67. doi: 10.1002/jmri.10064. [DOI] [PubMed] [Google Scholar]
- 14.Conturo TE, McKinstry RC, Aronovitz JA, Neil JJ. Diffusion MRI: precision, accuracy and flow effects. NMR Biomed. 1995;8:307–332. doi: 10.1002/nbm.1940080706. [DOI] [PubMed] [Google Scholar]
- 15.Courchesne E, Chisum HJ, Townsend J, Cowles A, Covington J, Egaas B, Harwood M, Hinds S, Press GA. Normal brain development and aging: quantitative analysis at in vivo MR imaging in healthy volunteers. Radiology. 2000;216:672–682. doi: 10.1148/radiology.216.3.r00au37672. [DOI] [PubMed] [Google Scholar]
- 16.De Bellis MD, Keshavan MS, Beers SR, Hall J, Frustaci K, Masalehdan A, Noll J, Boring AM. Sex differences in brain maturation during childhood and adolescence. Cereb Cortex. 2001;11:552–557. doi: 10.1093/cercor/11.6.552. [DOI] [PubMed] [Google Scholar]
- 17.Dubois J, Hertz-Pannier L, Dehaene-Lambertz G, Cointepas Y, Le Bihan D. Assessment of the early organization and maturation of infants’ cerebral white matter fiber bundles: a feasibility study using quantitative diffusion tensor imaging and tractography. Neuroimage. 30:1121–1132. doi: 10.1016/j.neuroimage.2005.11.022. [DOI] [PubMed] [Google Scholar]
- 18.Duncan JS, Papademetris X, Yang J, Jackowski M, Zeng X, Staib LH. Geometric strategies for neuroanatomic analysis from MRI. NeuroImage. 2004;23:S34–S45. doi: 10.1016/j.neuroimage.2004.07.027. [DOI] [PMC free article] [PubMed] [Google Scholar]
- 19.Eliez S, Blasey CM, Freund LS, Hastie T, Reiss AL. Brain anatomy, gender and IQ in children and adolescents with fragile X syndrome. Brain. 2001;124:1610–1618. doi: 10.1093/brain/124.8.1610. [DOI] [PubMed] [Google Scholar]
- 20.Frank LR. Anisotropy in high angular resolution diffusion-weighted MRI. Magn Reson Med. 2001;49:599–604. doi: 10.1002/mrm.1125. [DOI] [PubMed] [Google Scholar]
- 21.Ge Y, Grossman RI, Babb JS, Rabin ML, Mannon LJ, Kolson DL. Age-related total grey matter and white matter changes in normal adult brain. Part I: volumetric MR imaging analysis. AJNR Am J Neuroradiology. 2002;23:1327–1333. [PMC free article] [PubMed] [Google Scholar]
- 22.Giedd JN, Blumenthal J, Jeffries NO, Castellanos FX, Liu H, Zijdenbos A, Paus T, Evans AC, Rapoport JL. Brain development during childhood and adolescence: a longitudinal MRI study. Nature Neuroscience. 1999;2:861–863. doi: 10.1038/13158. [DOI] [PubMed] [Google Scholar]
- 23.Giedd JN. Structural magnetic resonance imaging of the adolescent brain. Ann N Y Acad Sci. 2004;1021:105–109. doi: 10.1196/annals.1308.009. [DOI] [PubMed] [Google Scholar]
- 24.Good CD, Johnsrude IS, Ashburner J, Henson RN, Friston KJ, Frackowiak RS. A voxel-based morphometric study of ageing in 465 normal adult human brains. Neuroimage. 2001;14:21–36. doi: 10.1006/nimg.2001.0786. [DOI] [PubMed] [Google Scholar]
- 25.Gupta RK, Hasan KM, Trivedi R, Pradhan M, Das V, Parikh NANarayana PA. Diffusion tensor imaging of the developing human cerebrum. J Neuroscience Res. 2005;81:172–178. doi: 10.1002/jnr.20547. [DOI] [PubMed] [Google Scholar]
- 26.Gur RC, Turetsky BI, Matsui M, Yan M, Bilker W, Hughett P, Gur RE. Sex Differences in Brain Grey and White Matter in Healthy Young Adults: Correlations with Cognitive Performance. J Neuroscience. 1999;19:4065–4072. doi: 10.1523/JNEUROSCI.19-10-04065.1999. [DOI] [PMC free article] [PubMed] [Google Scholar]
- 27.Guttmann CR, Jolesz FA, Kikinis R, Killiany RJ, Moss MB, Sandor T, Albert MS. White matter changes with normal aging. Neurology. 1998;1998:972–978. doi: 10.1212/wnl.50.4.972. [DOI] [PubMed] [Google Scholar]
- 28.Hadjiprocopis A, Rashid W, Tofts PS. Unbiased segmentation of diffusion-weighted magnetic resonance images of the brain using iterative clustering. Magn Reson Imaging. 2005;23:877–885. doi: 10.1016/j.mri.2005.07.010. [DOI] [PubMed] [Google Scholar]
- 29.Hasan KM, Narayana PA. Computation of the fractional anisotropy and mean diffusivity maps without tensor decoding and diagonalization: Theoretical analysis and validation. Magn Reson Med. 2003;50:589–598. doi: 10.1002/mrm.10552. [DOI] [PubMed] [Google Scholar]
- 30.Hasan KM, Narayana PA. Retrospective measurement of the diffusion tensor eigenvalues from diffusion anisotropy and mean diffusivity in DTI. Magn Reson Med. 2006;56:130–137. doi: 10.1002/mrm.20935. [DOI] [PubMed] [Google Scholar]
- 31.Hasan KM. Fundamentals of Diffusion Tensor Imaging of the Entire Human Brain: Review of Basic Theory, Data Acquisition, Processing and Potential Applications at 1.5 T and 3.0 T. In: Chen FJ, editor. Progress in Brain Mapping Research. Chapter 1. Nova Science Publishers Inc; Hauppauge, NY: 2006. pp. 1–80. [Google Scholar]
- 32.Hedges LV, Olkin I. Statistical Method for Meta-Analysis. Academic Press; San Diego: 1985. [Google Scholar]
- 33.Howell DC. Statistical Methods for Psychology. Belmont, CA: Wadsworth Publishing Company; 2006. [Google Scholar]
- 34.Hunter JE, Schmidt FL. Methods of Meta-Analysis: Correcting Error and Bias in Research Findings. Sage; Newbury Park, CA: 2004. [Google Scholar]
- 35.Glantz SA. Primer of biostatistics. 5. New York: McGraw-Hill; 2002. [Google Scholar]
- 36.Inglese M, Ge Y. Quantitative MRI. Hidden Age-Related Changes in Brain Tissue. Top Magn Reson Imaging. 2004;15:355–363. doi: 10.1097/01.rmr.0000168069.12985.15. [DOI] [PubMed] [Google Scholar]
- 37.Jaermann T, Crelier G, Pruessmann KP, Golay X, Netsch T, Van Muiswinkel AM, Mori S, van Zijl PC, Valavanis A, Kollias S, Boesiger P. SENSE-DTI at 3 T. Magn Reson Med. 2004;51:230–236. doi: 10.1002/mrm.10707. [DOI] [PubMed] [Google Scholar]
- 38.Jernigan TL, Archibald SL, Fennema-Notestine C, Gamst AC, Stout JC, Bonner J, Hesselink JR. Effects of age on tissues and regions of the cerebrum and cerebellum. Neurobiology Aging. 2001;22:581–594. doi: 10.1016/s0197-4580(01)00217-2. [DOI] [PubMed] [Google Scholar]
- 39.Jones DK, Dardis R, Ervine M, Horsfield MA, Jeffree M, Simmons A, Jarosz J, Strong AJ. Cluster analysis of diffusion tensor magnetic resonance images in human head injury. Neurosurgery. 2000;47:306–313. doi: 10.1097/00006123-200008000-00008. [DOI] [PubMed] [Google Scholar]
- 40.Le Bihan D. Diffusion and Perfusion Magnetic Resonance Imaging-Applications to Functional MRI. New York: Raven Press; 1995. [Google Scholar]
- 41.Lenglet C, Rousson M, Deriche R. DTI segmentation by statistical surface evolution. IEEE Trans Med Imaging. 2006;25:685–700. doi: 10.1109/tmi.2006.873299. [DOI] [PubMed] [Google Scholar]
- 42.Lim KO, Zipursky RB, Watts MC, Pfefferbaum A. Decreased grey matter in normal aging: an in vivo magnetic resonance study. J Gerontology. 1992;47:B26–30. doi: 10.1093/geronj/47.1.b26. [DOI] [PubMed] [Google Scholar]
- 43.Liu T, Young G, Huang L, Chen NK, Wong ST. 76-space analysis of grey matter diffusivity: methods and applications. Neuroimage. 2006;31:51–65. doi: 10.1016/j.neuroimage.2005.11.041. [DOI] [PubMed] [Google Scholar]
- 44.Maas LC, Mukherjee P, Carballido-Gamio J, Veeraraghavan S, Miller SP, Partridge SC, Henry RG, Barkovich AJ, Vigneron DB. Early laminar organization of the human cerebrum demonstrated with diffusion tensor imaging in extremely premature infants. NeuroImage. 2004;22:1134–1140. doi: 10.1016/j.neuroimage.2004.02.035. [DOI] [PubMed] [Google Scholar]
- 45.Matsuzawa J, Matsui M, Konishi T, Noguchi K, Gur RC, Bilker W, Miyawaki T. Age-related volumetric changes of brain grey and white matter in healthy infants and children. Cerebral Cortex. 2001;11:335–342. doi: 10.1093/cercor/11.4.335. [DOI] [PubMed] [Google Scholar]
- 46.McKinstry RC, Mathur A, Miller JH, Ozcan A, Snyder AZ, Schefft GL, Almli CR, Shiran SI, Conturo TE, Neil JJ. Radial organization of developing preterm human cerebral cortex revealed by non-invasive water diffusion anisotropy MRI. Cerebral Cortex. 2002;12:1237–1243. doi: 10.1093/cercor/12.12.1237. [DOI] [PubMed] [Google Scholar]
- 47.Netsch T, Van Muiswinkel A. Quantitative evaluation of image-based distortion correction in diffusion tensor imaging. IEEE-TME. 2004;23:789–798. doi: 10.1109/TMI.2004.827479. [DOI] [PubMed] [Google Scholar]
- 48.Nopoulos P, Flaum M, O’Leary D, Andreasen NC. Sexual dimorphism in the human brain: evaluation of tissue volume, tissue composition and surface anatomy using magnetic resonance imaging. Psychiatry Res. 2000;98:1–13. doi: 10.1016/s0925-4927(99)00044-x. [DOI] [PubMed] [Google Scholar]
- 49.Paus T, Collins DL, Evans AC, Leonard G, Pike B, Zijdenbos A. Maturation of white matter in the human brain: a review of magnetic resonance studies. Brain Res Bull. 2001;54:255–266. doi: 10.1016/s0361-9230(00)00434-2. [DOI] [PubMed] [Google Scholar]
- 50.Pfefferbaum A, Mathalon DH, Sullivan EV, Rawles JM, Zipursky RB, Lim KO. A quantitative magnetic resonance imaging study of changes in brain morphology from infancy to late adulthood. Arch Neurology. 1994;51:874–887. doi: 10.1001/archneur.1994.00540210046012. [DOI] [PubMed] [Google Scholar]
- 51.Pham DL, Xu C, Prince JL. Current methods in medical image segmentation. Annu Rev Biomed Eng. 2000;2:315–337. doi: 10.1146/annurev.bioeng.2.1.315. [DOI] [PubMed] [Google Scholar]
- 52.Pierpaoli C, Jezzard P, Basser PJ, Barnett A, Di Chiro G. Diffusion tensor MR imaging of the human brain. Radiology. 1996;201:637–648. doi: 10.1148/radiology.201.3.8939209. [DOI] [PubMed] [Google Scholar]
- 53.Prinster A, Quarantelli M, Orefice G, Lanzillo R, Brunetti A, Mollica C, Salvatore E, Morra VB, Coppola G, Vacca G, Alfano B, Salvatore M. Grey matter loss in relapsing-remitting multiple sclerosis: a voxel-based morphometry study. Neuroimage. 2006;29:859–67. doi: 10.1016/j.neuroimage.2005.08.034. [DOI] [PubMed] [Google Scholar]
- 54.Quarantelli M, Ciarmiello A, Morra VB, Orefice G, Larobina M, Lanzillo R, Schiavone V, Salvatore E, Alfano B, Brunetti A. Brain tissue volume changes in relapsing-remitting multiple sclerosis: correlation with lesion load. Neuroimage. 2003;18:360–6. doi: 10.1016/s1053-8119(02)00018-6. [DOI] [PubMed] [Google Scholar]
- 55.Rajapakse JC, DeCarli C, McLaughlin A, Giedd JN, Krain AL, Hamburger SD, Rapoport JL. Cerebral magnetic resonance image segmentation using data fusion. J Comput Assist Tomography. 1996a;20:206–218. doi: 10.1097/00004728-199603000-00007. [DOI] [PubMed] [Google Scholar]
- 56.Rajapakse JC, Giedd JN, DeCarli C, Snell JW, McLaughlin A, Vauss YC, Krain AL, Hamburger S, Rapoport JL. A technique for single-channel MR brain tissue segmentation: application to a pediatric sample. Magn Reson Imaging. 1996b;14:1053–1065. doi: 10.1016/s0730-725x(96)00113-0. [DOI] [PubMed] [Google Scholar]
- 57.Shaw P, Greenstein D, Lerch J, Clasen L, Lenroot R, Gogtay N, Evans A, Rapoport J, Giedd J. Intellectual ability and cortical development in children and adolescents. Nature. 2006;440:676–679. doi: 10.1038/nature04513. [DOI] [PubMed] [Google Scholar]
- 58.Simon TJ, Ding L, Bish JP, McDonald-McGinn DM, Zackai EH, Gee J. Volumetric, connective, and morphologic changes in the brains of children with chromosome 22q11.2 deletion syndrome: an integrative study. Neuroimage. 2005;25:169–180. doi: 10.1016/j.neuroimage.2004.11.018. [DOI] [PubMed] [Google Scholar]
- 59.Song SK, Yoshino J, Le TQ, Lin SJ, Sun SW, Cross AH, Armstrong RC. Demyelination increases radial diffusivity in corpus callosum of mouse brain. Neuroimage. 2005;26:132–140. doi: 10.1016/j.neuroimage.2005.01.028. [DOI] [PubMed] [Google Scholar]
- 60.Sowell ER, Peterson BS, Thompson PM, Welcome SE, Henkenius AL, Toga AW. Mapping cortical change across the human life span. Nature Neuroscience. 2003;6:309–315. doi: 10.1038/nn1008. [DOI] [PubMed] [Google Scholar]
- 61.Tedeschi G, Lavorgna L, Russo P, Prinster A, Dinacci D, Savettieri G, et al. Brain atrophy and lesion load in a large population of patients with multiple sclerosis. Neurology. 2005;65:280–5. doi: 10.1212/01.wnl.0000168837.87351.1f. [DOI] [PubMed] [Google Scholar]
- 62.Wang FN, Huang TY, Lin FH, Chuang TC, Chen NK, Chung HW, Chen CY, Kwong KK. PROPELLER EPI: an MRI technique suitable for diffusion tensor imaging at high field strength with reduced geometric distortions. Magn Reson Med. 2005;54:1232–1240. doi: 10.1002/mrm.20677. [DOI] [PMC free article] [PubMed] [Google Scholar]
- 63.Wang Z, Vemuri BC. DTI segmentation using an information theoretic tensor dissimilarity measure. IEEE Trans Med Imaging. 2005;24:1267–1277. doi: 10.1109/TMI.2005.854516. [DOI] [PubMed] [Google Scholar]
- 64.Wiegell MR, Tuch DS, Larsson HB, Wedeen VJ. Automatic segmentation of thalamic nuclei from diffusion tensor magnetic resonance imaging. NeuroImage. 2003;19:391–401. doi: 10.1016/s1053-8119(03)00044-2. [DOI] [PubMed] [Google Scholar]
- 65.Wilde EA, Hunter JV, Newsome MR, Scheibel RS, Bigler ED, Johnson JL, Fearing MA, Cleavinger HB, Li X, Swank PR, Pedroza C, Roberson GS, Bachevalier J, Levin HS. Frontal and temporal morphometric findings on MRI in children after moderate to severe traumatic brain injury. J Neurotrauma. 2005;22:333–344. doi: 10.1089/neu.2005.22.333. [DOI] [PubMed] [Google Scholar]
- 66.Zhang K, Sejnowski TJ. A universal scaling law between grey matter and white matter of cerebral cortex. Proc Natl Acad Sci U S A. 2000;97:5621–5621. doi: 10.1073/pnas.090504197. [DOI] [PMC free article] [PubMed] [Google Scholar]