

SUMMARY
Translocation requires large-scale movements of ribosome-bound tRNAs. Using tRNAs that are proflavin-labeled and single turnover rapid kinetics assays, we identify one or possibly two kinetically competent intermediates in translocation. EF-G.GTP binding to the pretranslocation (PRE) complex and GTP hydrolysis is rapidly followed by formation of the securely identified intermediate complex (INT), which is more slowly converted to the posttranslocation (POST) complex. Peptidyl tRNA within the INT complex occupies a hybrid site, having puromycin reactivity intermediate between those of the PRE and POST complexes. Thiostrepton and viomycin inhibit INT formation, whereas spectinomycin selectively inhibits INT disappearance. The effects of other translocation modulators suggest that EF-G-dependent GTP hydrolysis is more important for INT complex formation than for INT complex conversion to POST complex, and that subtle changes in tRNA structure influence coupling of tRNA movement to EF-G.GTP-induced conformational changes.
INTRODUCTION
Translation elongation requires the movement of tRNAs among three distinct sites within the bacterial ribosome, the aminoacyl-tRNA site (A-site), the peptidyl-tRNA site (P-site) and the exit site (E-site). The first cycle of translation elongation proceeds via serial formation of three ribosomal complexes (Ramakrishnan, 2002): the initiation complex (IC70), containing fMet-tRNAfMet in the P-site bound to the AUG initiation codon of mRNA; the pretranslocation complex (PRE), formed by addition of cognate ternary complex EF-Tu.aminoacyl-tRNA.GTP to IC70 and, following a peptidyl transferase reaction, containing fMet-aminoacyl-tRNA in the A-site and tRNAfMet in the P-site; and the posttranslation complex (POST), formed by addition of EF-G.GTP to the PRE complex and, following translocation of both tRNAs and mRNA, containing fMet-aminoacyl-tRNA in the P-site and tRNAfMet in the E-site. The translocation process opens up the A-site for binding of a second cognate ternary complex, concomitant with dissociation of tRNAfMet, thus completing the first elongation cycle.
The three ribosomal complexes are reasonably well-defined structurally with, for example, the locations of the decoding center for codon:anticodon recognition on the 30S subunit and of the peptidyl transferase center on the 50S subunit being known in detail (Yusupov et al., 2001; Yusupova et al., 2001; Ogle and Ramakrishnan, 2005; Schmeing et al., 2005; Yonath, 2005; Mitra and Frank, 2006; Selmer et al., 2006). Several functional properties of the complexes are also well understood (Boelens and Gualerzi, 2002; Laursen et al., 2005; Wintermeyer et al., 2004). Of particular pertinence to this work is that the reactivity of peptidyl-tRNA toward reaction with the antibiotic puromycin, a small molecule analogue of the 3’-end tyrosyl-tRNA, is more than 1000-fold greater in the POST complex than in the PRE complex (Semenkov et al., 1992; Sharma et al., 2004; Peske et al., 2004; Dorner et al., 2006).
In contrast, the detailed mechanisms for interconversions of the ribosomal complexes are less well characterized. One of the outstanding questions concerns the significance of the so-called ‘hybrid state’. It was originally proposed in the 1960s (Bretscher, 1968), that tRNAs might move independently with respect to the 50S and 30S subunits during the elongation cycle, leading to the formation of hybrid tRNA binding sites. Thus, a PRE complex could exist in one of two states, a “classical” state in which peptidyl tRNA is bound in the A/A site and discharged tRNA is bound in the P/P site (the first and second letters represent binding sites on the 30S and 50S subunits, respectively) and a hybrid state in which peptidyl-tRNA is bound in the A/P site and discharged tRNA is bound in the P/E site. Subsequently, hybrid state formation within a PRE complex was demonstrated by two independent methods that employed poly(U)-encoded ribosomes, chemical tRNA footprinting (Moazed and Noller, 1989), and the slow puromycin reactivity of A-site bound peptidyl-tRNAs (Semenkov et al., 1992). The latter demonstration was more recently repeated using ribosomes encoded with natural mRNA (Peske et al., 2004; Sharma et al., 2004). However, structural studies (Yusupov et al., 2001; Valle et al., 2003; Selmer et al., 2006) show no evidence for hybrid state formation in the absence of added EF-G.GTP. A second question concerns the exact manner by which translocation is kinetically and thermodynamically coupled to EF-G dependent GTP hydrolysis (Zavialov et al., 2005; Wilden et al., 2006).
The tertiary core region of tRNA is formed by interactions between the D- and T-loops. Recently we used single-turnover rapid kinetics assays to demonstrate the importance during translocation of ribosome interaction with the tertiary core region of P-site bound tRNA (Pan et al., 2006). Here we utilize fluorescent derivatives of E. coli initiator tRNAfMet [tRNAfMet (prf20)], and of both E. coli and yeast tRNAPhe [tRNAPhe(prf16/20) and tRNAPhe(prf16/17), respectively], formed by proflavin (prf) substitution of dihydrouridine residues within their D-loops, to monitor tRNA movement from both the A- and P-sites during translocation. Our results demonstrate that EF-G.GTPase dependent translocation during the first elongation cycle proceeds via at least one and possibly two newly-described kinetically competent intermediates. The securely identified intermediate, denoted the INT complex, has a peptidyl-tRNA reactivity toward puromycin that falls in between those of the PRE and POST complexes and is specifically stabilized by the antibiotic spectinomycin (Spc). The properties of this intermediate are important for evaluating the importance of the hybrid state in translocation and for understanding the coupling of GTP hydrolysis to tRNA movement. The second intermediate, denoted the P/E complex, has very low peptidyl-tRNA reactivity toward puromycin and may be formed just prior to the INT complex during translocation.
RESULTS
Fluorescent PRE complexes are functional in EF-G.GTP-dependent translocation
fMet-tRNAfMet(prf20) binds tightly to 70S ribosomes programmed with mRNA 022 to form a fully functional 70S initiation complex, which is rapidly transformed via a biphasic process into a fluorescent PRE complex, denoted PRE 20P, on mixing with ternary complex EF-Tu.GTP.Phe-tRNAPhe (Supplemental Figure 1). This result closely parallels that obtained earlier when PRE 16/17A complex formation was measured on mixing of EF-Tu.GTP.Phe-tRNAPhe(prf16/17) with initiation complex (Pape et al., 1998; Tomsic et al., 2000).
The studies presented below involve translocation from three fluorescently-labeled PRE complexes, the PRE 20P and PRE 16/17A complexes described above, as well as the PRE 16/20A complex formed on mixing EF-Tu.GTP.Phe-tRNAPhe(prf16/20) with initiation complex. The apparent rate constants for fMetPhe-puromycin formation following rapid mixing of each of the three labeled PRE complexes (16/17A, 16/20A, and 20P) and of unlabeled PRE complex with EF-G.GTP and puromycin are virtually identical (Figure 1A), demonstrating that each of the fluorescent PRE complexes is functional in translocation.
Figure 1.
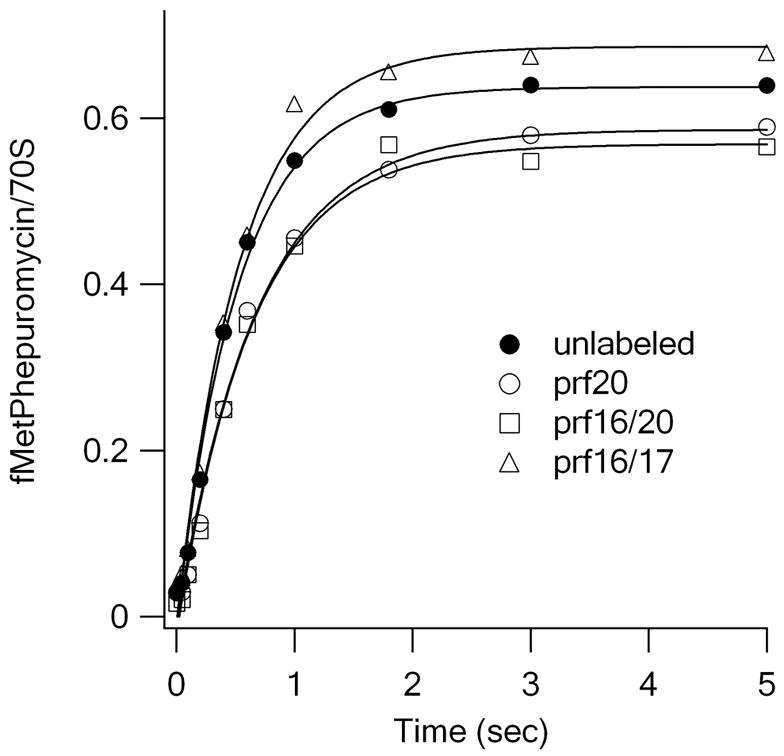


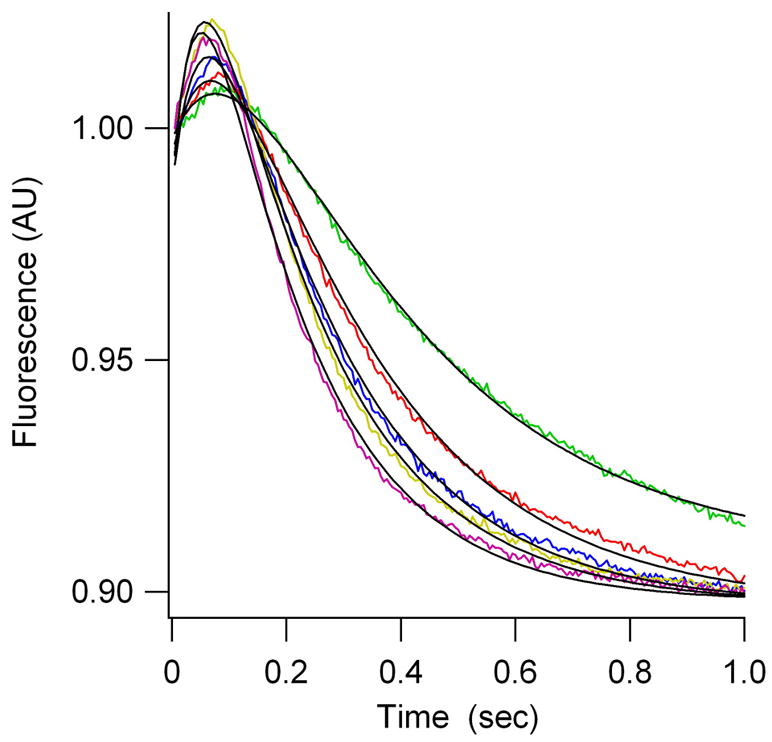
EF-G.GTP dependent translocation. (A) As measured by fMetPhe-puromycin formation. kapp values are (in s-1): Filled circles, unlabeled tRNAs, 1.9 ± 0.1 ; open circles, tRNAfMet(prf20), 1.5 ± 0.1; squares, tRNAPhe(prf16/20), 1.6 ± 0.1; triangles, tRNAPhe(prf16/17), 1.8 ± 0.2 s−1. (B) – (D) As measured by changes in fluorescence of prf-labeled tRNAs as a function of EF-G concentration, in μM (green, 0.5; red, 1.0; blue, 2.0; yellow, 3.0; magenta, 5.0). (B) using yeast fMetPhe-tRNAPhe(prf16/17) (PRE 16/17A). (C) Using E. coli fMetPhe-tRNAPhe(prf16/20) (PRE 16/20A). (D) Using E. coli prf-tRNAfMet(prf20) (PRE 20P). Traces shown were obtained with E. coli fMetPhe-tRNAPhe - results obtained with yeast fMetPhe-tRNAPhe were superimposable. Curves were fit with the kcat and Km(EF-G) values given in Table 1, and the following relative fluorescent values (PRE complex equals 1.0): PRE 16/17A POST 1.09; PRE 16/20A INT 1.19, POST 1.13; PRE 20P INT 1.054, POST 0.90.
EF-G.GTP dependent tRNA movement during translocation occurs in at least two steps
Rates of translocation were also determined by stopped-flow monitoring of fluorescent change following EF-G.GTP addition to labeled PRE complexes. Confirming earlier work (Rodnina et al., 1997; Savelsbergh et al., 2003), rapid addition of EF-G.GTP to PRE 16/17A leads to an apparent monophasic increase in fluorescence as A-site tRNA is translocated to the P-site (Figure 1B). By contrast, translocation clearly proceeds via a two-step reaction for PRE 16/20A (Figure 1C), or PRE 20P (Figure 1D), in each case involving an initial increase in fluorescence intensity followed by a decrease. These results provide the first clear evidence that translocation of tRNAs from a PRE complex to form a POST complex proceeds via a kinetically competent intermediate, which we denote the INT complex, as shown in Scheme 1.
Scheme 1.

kapp values for PRE 16/17A, and kapp1 and kapp2 values for PRE 16/20A and PRE 20P, were determined as functions of EF-G.GTP concentration (Supplemental Figure 2), giving the results summarized in Table 1. Each of the four parameters that are evaluated by this analysis, kcat1, kcat2, Km1(EF-G), and Km2(EF-G), is very similar for the PRE 16/20A and PRE 20P complexes, demonstrating that A-site and P-site tRNA movements during both steps of translocation are tightly coupled. Measured under identical conditions (Pan et al., 2006), GTP hydrolysis proceeds considerably more rapidly than step 1. As a result, INT complex formation must follow GTP hydrolysis and kcat1 somewhat underestimates the rate constant for this process. On the other hand, kcat2 directly measures the rate constant for INT conversion to POST. The ratios of kcat1/kcat2 and Km1/Km2 are ~4.5 and ~3, respectively, for both the PRE 16/20A and PRE 20P complexes. This is consistent with the clear buildup of the INT complex, which in both cases has higher fluorescence intensity than either the PRE or POST complex (Figure 1), as EF-G.GTP concentration is increased.
Table 1.
kcat and Km(EF-G) values for translocationa
| PRE complex | GXP, 0.5 mM | kcat1, s−1 | Km1(EF-G), μM | kcat2, s−1 | Km2(EF-G), μM |
|---|---|---|---|---|---|
| PRE 16/17Ab | GTP | 8.9 ± 0.1 | 1.14 ± 0.04 | - | - |
| PRE 16/20A | GTP | 21 ± 2 | 1.4 ± 0.2 | 5.0 ± 0.2 | 0.5 ± 0.1 |
| PRE 20P | GTP | 28 ± 2 | 1.6 ± 0.3 | 6.0 ± 0.2 | 0.59 ± 0.06 |
| PRE 20P + 1 mM Spc | GTP | 26 ± 1 | 0.86 ± 0.04 | 0.037 ± 0.003c | n.d. |
| PRE 20P | GDPNP | 3.8 ± 0.6 | 5 ± 1 | 6 ± 2 | <1 |
| PRE 20P + 4 mM Spc | GDPNP | 3.0 ± 0.9d | n.d. |
kapp1 and kapp2 values were determined by fitting traces in Figure 1 to the equation
single exponential fit
kapp2 at 1 μM EF-G
single exponential fit at 5 μM EF-G
The failure to observe INT complex buildup in the case of PRE 16/17A is likely due to the INT complex having a fluorescence intensity intermediate between that of the PRE and POST complexes, rather than to a difference in mechanism. In fact, the results in Figure 1B can be well-fit to a two step mechanism if the INT complex is assumed to have a relative fluorescence intensity of 1.03 and kcat1, kcat2 Km1(EF-G), and Km2(EF-G) are assigned values corresponding to the averages of the values determined for the 16/20 and 20 complexes. Independent evidence for an intermediate fluorescence intensity for INT 16/17 is presented below.
Fluorescence is very sensitive to the environment of the fluorophore, and we attribute differences in the observed fluorescence changes (Figure 1B – 1D) to differences in the placements of the prf groups in the three labeled PRE complexes during translocation. Fluorescence intensities of complexes containing labeled fMetPhe-tRNAPhe fall in the order INT>POST>PHE for the 16/20 complexes and POST>INT>PRE for the 16/17 complexes. Such intensity differences could reflect differences within the INT complex in the structures of the homologous E. coli tRNAPhe(16/20) as compared with the heterologous yeast tRNAPhe(16/17) and/or in the local environments of peptidyl tRNA positions 17 and 20.
Modulation of tRNA movement during translocation
Identification of the INT complex led us to re-examine the effects of three known modulators of the translocation reaction, antibiotics, GTP analogues, and tRNA posttranscriptional modification and mutation, to determine whether their effects on step 1 could be differentiated from their effects on step 2.
Antibiotic Effects
Thiostrepton (ThS), spectinomycin (Spc), and viomycin (Vio), while not inhibiting single turnover EF-G.GTPase (Rodnina et al., 1999; Peske et al., 2004; Seo et al., 2006), do have marked effects on the three fluorescence translocation assays (Figure 2). Added ThS abolishes all fluorescent change, strongly inhibiting step 1 and thus step 2 as well. This result is consistent with known effect of ThS in directly interfering with EF-G function following the GTPase step (Rodnina et al., 1999; Seo et al., 2006).
Figure 2.
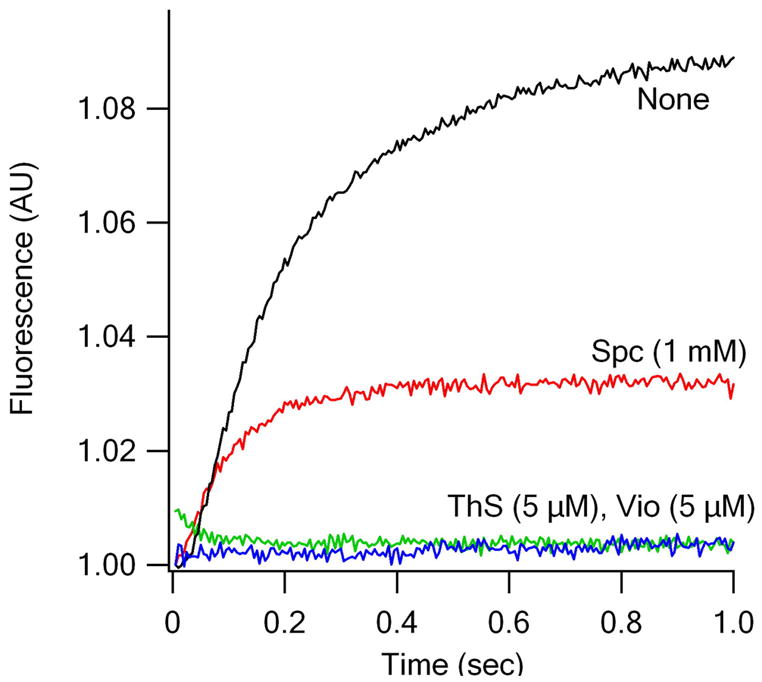


Antibiotic effects on rates of fluorescent tRNA translocation. EF-G.GTP (1 μM) was rapidly mixed with the following PRE complexes. (A) PRE 16/17A. (B) PRE 16/20A. (C) PRE 20P. Antibiotic concentrations: Spc, 1 mM; ThS, 5 μM; Vio, 5 μM. All concentrations are final. Calculated rate constants (s−1) : + Spc: (A) 9.5 ± 0.4, (B) 13 ± 1, (C) 9.2 ± 0.7; + Vio: (C) 8.9 ± 0.8.
By contrast, Spc allows step 1 to proceed unimpeded while severely inhibiting step 2, thus effectively stabilizing the INT complex. This is seen most clearly in Figure 2C. Spc addition results in essentially stoichiometric accumulation of INT complex, so that the observed increase in fluorescence is considerably greater than that seen in the absence of antibiotic. The same explanation accounts for the increased fluorescence change induced by added Spc for translocation of PRE 16/20A (Figure 2B). In contrast, added Spc leads to a decrease in the fluorescence change during translocation of PRE 16/17A (Figure 2A), consistent with the notion that the INT complex has a fluorescence that is intermediate (relative intensity 1.03) between that of the PRE and POST complexes, as mentioned above.
Measurement of the rate of fluorescence increase of the PRE 16/20A complex as a function of EF-G.GTP concentration at 1 mM Spc (Supplemental Figure 2), a concentration well in excess of the apparent Kd for Spc binding (see below), yields values for kcat and Km(EF-G) (Table 1) similar to the values determined in the absence of Spc for kcat1 and Km(EF-G). The relative fluorescence of the Spc-stabilized INT complex, 1.20, is also similar to the value of 1.19 found in the absence of Spc (Figure 1). The lack of major effect of Spc on either the kinetics of INT formation or on the fluorescence of the INT complex suggests that Spc neither interferes with INT formation nor dramatically alters its structure.
Conversion of the INT 20 to POST 20 complex (step 2) is seen even in the presence of quite high Spc concentration, but the rate of such conversion is very slow, with kapp2 equal to 0.037 ± 0.003 s−1 at 1 mM Spc (Table 1). Similar results were obtained for conversion of INT 16/17 to POST 16/17 and of INT 16/20 to POST 16/20, with kapp2 equal to 0.028 ± 0.002 s−1 and 0.047 ± 0.003 s−1, respectively, at 1 mM Spc. Conversion of INT 20 to POST 20 complex at nonsaturating concentrations of Spc proceeds in a biphasic manner, with the proportion of the slower phase rising as a function of Spc concentration (Supplemental Figure 3), allowing estimation of a Kd for Spc binding to the PRE or INT complex of 0.18 ± 0.02 mM, in agreement with earlier estimates (Wallace et al., 1974; Peske et al., 2004). The results are most straightforwardly interpreted as indicating that the INT and Spc-stabilized INT complexes are not freely interconvertible. Peske et al. [04] observed similar biphasic effects of Spc on the rate of translocation measured using fluorescent mRNA. Unlike Peske et al. [04], we see no evidence for a small fraction of slow INT 20 to POST 20 conversion in the absence of Spc, although we can’t rigorously exclude this possibility.
Added Vio decouples P-site from A-site movement on EF-G.GTP addition, allowing a clear increase in the fluorescence of P-site bound E. coli tRNAfMet (prf20), (Figure 2C) while blocking any corresponding change in the fluorescence of either A-site bound fMetPhe-tRNAPhe [(prf16/20) or (prf16/17)] (Figure 2A, B).
The apparent rate constants for the increase in P-site tRNA fluorescence in the presence of either Vio or Spc (Figure 2C) are virtually identical and quite similar to the value for kapp1 (11 s−1) in the absence of antibiotic, measured under the same conditions. A plausible interpretation of these results is that step 1 in Scheme 1 can be further resolved into step 1A, corresponding to some partial P-site tRNA movement and permitted by viomycin, and Step 1B, corresponding to A-site tRNA movement to form the INT complex and inhibited by viomycin. Given the apparent tight coupling of A-site and P-site tRNA movements during translocation (Figure 1, Table 1), this would require the rate constant for step 1B in the absence of viomycin to be very large.
Puromycin reactivity of the Spc-stabilized INT complex
In semi-quantitative agreement with earlier results (Semenkov et al., 1992, Sharma et al., 2004, Peske et al., 2004), POST complex reacts some 3000-times faster with puromycin to form fMetPhe-puromycin than does the PRE complex (Table 2). Simultaneous rapid addition of puromycin and EF-G.GTP to the PRE complex gives an observed rate constant for fMetPhe-puromycin formation that is 6 times lower than for the POST complex, due to the translocation process being largely rate-determining. When this experiment is repeated in the presence of saturating Spc (4 mM), the observed rate constant is some 23 times slower than for POST complex. This rate constant provides a direct measure of INT reactivity toward puromycin, since, in the presence of Spc, INT formation on mixing with EF-G.GTP proceeds more than 10-fold faster than fMetPhe-puromycin formation (Figure 2C) whereas POST complex formation proceeds more than 10-fold more slowly (Table 1, Supplemental Figure 3). By contrast, when the experiment is repeated in the presence of Vio, the observed rate constant for puromycin reaction is only slightly greater than that of the PRE complex. Also, added Spc has no effect on the low reactivity of PRE complex, as reported earlier (Peske et al., 2004).
Table 2.
kapp values for fMetPhe-puro formation ([EF-G]) = 1 μM)a
| Initial Complex | GXP, 0.5 mM | Added antibiotic | [Puro], mM | kapp, s−1 |
|---|---|---|---|---|
| POSTb | GTP | - | 5 | 11.8 ± 0.8 |
| POSTb | GDPNP | - | 5 | 8.1 ± 0.7 |
| PREc | - | - | 5 | 0.0041 ± 0.0001 |
| PRE | GTP | - | 5 | 1.85 ± 0.14 |
| PRE | GTP | - | 2 | 2.04 ± 0.17 |
| PRE | GTP | Spc, 1 mM | 5 | 0.80 ± 0.08 |
| PRE | GTP | Spc, 1 mM | 2 | 0.33 ± 0.04 |
| PRE | GTP | Spc, 2 mM | 5 | 0.57 ± 0.06 |
| PRE | GTP | Spc, 4 mM | 5 | 0.50 ± 0.05 |
| PREc | - | Spc, 1 mM | 5 | 0.0043 ± 0.0003 |
| PRE | GTP | Vio, 5 μM | 5 | 0.0069 ± 0.0006 |
| PRE | GDPNP | - | 5 | 0.55 ± 0.06 |
kapp values were determined with single exponential fits – in no case was there any evidence for biphasic fMetPhe-puro formation. EF-G, GXP, and puromycin were rapidly mixed with initial complex, except as otherwise noted.
preincubated with EF-G (see Experimental Procedures)
no added EF-G
Measuring fMetPhe-puromycin formation as a function of puromycin concentration (Supplemental Figure 4) shows that, relative to the POST complex, the Spc-stabilized INT complex has a 22-fold lower kcat (0.88 ± 0.07 s−1 vs. 20 ± 2 s−1) but only a slightly higher Km(puro) value (4.5 ± 0.8 mM vs. 3.5 ± 0.8 mM). These Km (puro) values are similar to those reported earlier for comparable PRE and POST complexes (Sharma et al., 2004).
GTP analogue effects
The ability of GDP to substitute for GTP in stimulating EF-G dependent translocation has been controversial, due to concerns over possible GTP contamination of commercial GDP sources [Wilden et al., 2006; Zavialov and Ehrenberg, 2003; Zavialov et al., 2005]. A potential second source of GTP contamination is PRE complex, since GTP is needed for both IC70 and ternary complex preparation. Indeed, using commercial GDP and PRE complex prepared using a single sucrose-cushion centrifugation we measured apparent rate constants for overall translocation of all three fluorescent PRE complexes with GDP that were 3 − 5 % of that obtained with GTP (EF-G = 1 μM). Substituting GTP-free GDP (see Experimental) for commercial GTP lowered this rate constant considerably (~ 3-fold), whereas using GTP-free GDP and PRE complex prepared by double sucrose-cushion centrifugation eliminated translocation altogether, in agreement with Zavialov et al. (2005) (Figure 3A). In addition, EF-G added alone did not stimulate translocation of such purified PRE complexes, in contrast to the low level of activity reported earlier (Rodnina et al., 1997). By contrast, both kapp1 and kapp2 for translocation stimulated by EF-G.GTP or EF-G.GDPNP translocation were unaffected by the second sucrose-cushion centrifugation (Figure 3A), although the stoichiometry of bound peptidyl-tRNA was somewhat reduced (see Materials and Methods). We suspect that the low activity recently reported by Wilden et al. (2006) using EF-G.GDP prepared with GTP-free GDP is due to residual GTP contamination of PRE complex.
Figure 3.


GTP analogue and tRNA mutation effects on rates of fluorescent tRNA translocation. All concentrations are final. G nucleotide concentrations were 0.5 mM except as otherwise indicated. PRE complexes were 0.1 μM. Translocation was initiated by rapid mixing of EF-G.G nucleotide with PRE complex. (A) Translocation of PRE 20P complex, prepared using two sucrose cushion centrifugation steps, in the presence of GTP (0.05 mM, green; 0.5 mM red), GDPNP (0.5 mM purple), or GTP-free GDP (0.05 mM black; 0.5 mM blue) or in the absence of added G-nucleotide (yellow). EF-G is 1 μM. An essentially identical final fluorescence value was obtained for the traces in the presence of GTP or GDPNP. Inset compares early time period in the presence of 0.5 mM GTP (red) or GDPNP (purple). (B) Translocation of PRE 20P complex as a function of EF-G.GDPNP concentration (in μM) (green, 0.5; red, 1; blue, 3; magenta, 5). The light blue curve is for a sample containing 5 μM EF-G.GDPNP and 4 mM Spc. (C) SDS-PAGE analysis of proteins extracted from unlabeled PRE complex incubated with EF-G and the nucleotides indicated. FA is fusidic acid. Only the region of the gel corresponding to ribosomal protein S1 and EF-G is shown. (D) EF-G.GTP dependent translocation of PRE (16/20) complex using the following forms of tRNAfMet: native, wt-transcript, G18A variant, or U55A variant. EF-G is 2 μM.
The overall lower rate of translocation when EF-G.GDPNP is substituted for EF-G.GTP is in qualitative accord with the previously reported results of Katunin et al. (2002) and of Zavialov and Ehrenberg (2003), although it is in quantitative accord only with the latter (Supplemental Table 1), with Katunin et al. reporting much lower relative rates when GDPNP is substituted for GTP than what we and Zavialov and Ehrenberg observe. The reasons for this quantitative disagreement are unclear. The results presented in Figure 3A for the PRE 20P complex, show that substituting GDPNP for GTP not only reduces the translocation rate but also leads to reduced transient INT complex accumulation, i.e., reduces the kapp1/kapp2 ratio. Results obtained with the PRE 16/17A and PRE 16/20A complexes (Table 3) lead to the same conclusion. Thus, the higher activity of EF-G.GTP principally reflects its effect on INT complex formation from PRE complex, rather than on INT complex conversion to POST complex.
Table 3.
kapp1 and kapp2 values for translocationa.
| PRE complex | GXP | kapp1, s-1 | kapp2, s-1 | |
|---|---|---|---|---|
| PRE 16/17A | native | GTP | (10)c | (3.6)c |
| GDPNP | 0.77 ± 0.07 | > 3 | ||
| PRE 16/20A | native | GTP | 9 ± 1 | 3.4 ± 0.3 |
| GDPNP | 0.96 ± 0.10 | 3.2 ± 0.4 | ||
| wt-transcript | GTP | 2.5 ± 0.5 | 7 ± 3 | |
| variant G18Ab | GTP | 0.27 ± 0.03 | > 0.4 | |
| variant U55Ab | GTP | 0.11 ± 0.01 | > 0.2 | |
| PRE 20P | native | GTP | 11 ± 1 | 3.8 ± 0.4 |
| GDPNP | 0.71 ± 0.06 | 6 ± 2 |
.[EF-G] = 1 μM.
Rate constant values were estimated assuming that INT fluorescence intensity is not affected by changes in tRNAfMet structure
average for PRE 16/20A and PRE 20P
Measurement of EF-G.GDPNP-dependent translocation as a function of EF-G concentration (Figure 3B) permitted estimation of kcat1, kcat2, Km1(EF-G) and Km2(EF-G) (Table 1), from which it is clear that the reduced rate of INT complex formation when GDPNP replaces GTP derives from both a lower kcat1 and a higher Km1(EF-G). The translocation rate advantage of EF-G.GTP over EF-G.GDPNP is thus much higher at low EF-G concentration than when EF-G is saturating (10-fold vs. 2-fold, respectively). Moreover, at 1 μM EF-G, there is a clear change in rate determining step, from INT complex conversion to POST complex for EF-G.GTP to INT complex formation for EF-G.GDPNP. As with EF-G.GTP, the INT complex formed from PRE 20P complex in response to EF-G.GDPNP addition is stabilized by added Spc, and has a similar fluorescence intensity (Figure 2C).
Interestingly, added GDPNP stabilizes EF-G binding to POST complex, as measured by co-sedimentation, to about the same extent as added fusidic acid stabilizes EF-G.GDP binding (Willie et al., 1975; Seo et al., 2006), whereas EF-G.GDP formed during EF-G.GTP catalysis of translocation or added directly to PRE complex, is much less tightly bound (Figure 3C)
tRNA structure effects
Elsewhere we have shown that PRE complexes containing wild-type transcript or the tertiary core G18A and U55A variants of tRNAfMet have reduced rates of translocation compared with PRE complexes containing native tRNAfMet (Pan et al., 2006). The results presented in Figure 3D and Table 3 show that these changes in tRNAfMet structure have larger effects on kapp1 than on kapp2, paralleling the results observed with GTP analogues.
DISCUSSION
A revised kinetic model for translocation
The results presented above lead us to formulate the model for translocation shown in Figure 4, which includes two new transient intermediates (the INT and P/E complexes shown in blue) not previously identified in rapid kinetics studies (Savelsbergh et al., 2003, 2005). Unambiguous evidence for the formation of the INT complex as a kinetically competent intermediate in normal translocation is provided by the data presented in Figure 1 for the PRE 16/20A and PRE 20P complexes. With the assumption that the presence of Spc does not dramatically alter the chemistry of the INT complex, the justification for which is given above, the rate of fMetPhe-puromycin formation of the INT complex is about 5% of that of the POST complex. This reactivity is much greater than that of the PRE complex (0.03%, Table 2), indicating that INT complex formation from PRE complex requires substantial movement of the 3’-termini of both A- and P-site bound tRNAs. Such movement would not be expected to be interfered with by Spc, which binds base pair G1064-C1192 within the minor groove of H34 of the 30S subunit (Moazed and Noller, 1987; Brink et al., 1994; Carter et al., 2000), close to the binding region of the anticodon stem loop of P-site tRNA (Yusupov et al., 2001). In contrast, conversion of INT complex to POST complex requires tRNA-mRNA movement on the 30S subunit, consistent with strong Spc inhibition of this step.
Figure 4.

Mechanism of translocation showing stepwise movement of tRNA following GTP hydrolysis. Two new intermediates are shown in blue. Inhibitions by antibiotics or tRNA mutations are shown by red dashed lines.
Added Vio blocks movement of A-site bound tRNA (Figure 2A,B), consistent with its induction of a >1000-fold increase of tRNA affinity to the A site (Peske et al., 2004), and stabilizes a species, denoted the P/E complex in Figure 4. The P/E complex has a puromycin reactivity much like that of PRE complex, so that its formation from PRE complex does not require movement of the 3’-end of A-site tRNA. While it is possible that the P/E complex is only formed in the presence of Vio and is not an intermediate during normal translocation, there are two arguments for its inclusion within Figure 4. First, the rate of P/E complex formation in the presence of Vio is compatible with the rate of formation of INT complex in the absence of Vio, assuming rapid conversion of P/E complex to INT complex; second, movement of P-site tRNA prior to A-site tRNA is likely, since the interaction between the 3’ end of peptidyl-tRNA and the 50S P-site cannot be established until the 3’ end of tRNAfMet leaves.
The mechanism of translocation
Formation of the PRE complex places discharged tRNA at the P-site. Such placement is believed to result in a conformationally labile ribosome structure (Valle et al., 2003), which disposes the ribosome to a ratchet-like rotation of subunits on EF-G.GTP binding. This major conformational change, which is accompanied by movements of the L1 stalk and L11 region (Agrawal et al., 2001, Datta et al., 2005, Seo et al., 2006), facilitates the large-scale tRNA movements that are required for translocation. Our finding that the rate constant for Step 1 (Scheme 1) at saturating EF-G (21 – 28 s−1, Table 1) is identical to the rate constant for conformational change within the complex formed by EF-G.GTP and a vacant ribosome, lacking either bound tRNA or mRNA (24 s−1, Seo et al., 2006), strongly supports the conclusion, reached earlier by others (Savelsbergh et al., 2003), that the conformational change step in the ribosome following EF-G-dependent GTP hydrolysis precedes tRNA movement. This conformational change is then rapidly propagated to the tRNA binding sites. Part of this initial conformational change process, requiring GTP hydrolysis and resulting in rapid movement of the G’-domain of EF-G toward the GTPase activation center, is, like Step 1, inhibited by thiostrepton (Seo et al., 2006).
What is the first movement of tRNA following EF-G-dependent GTP hydrolysis? Recently, and prior to our characterization of the INT complex, we suggested that partial P-site tRNA movement precedes any A-site tRNA movement and is directly coupled to EF-G conformational change (Pan et al., 2006), in a step corresponding to P/E complex formation in Figure 4. Our results in the presence of Vio support this suggestion, showing that some P-site tRNA movement can occur rapidly, fully decoupled from A-site movement (Figure 2, Table 2). Also supporting this suggestion are cryoelectron microscopy results showing that added EF-G induces movement of tRNA from the classic P/P site to the hybrid P/E site even in the absence of A-site bound tRNA (Valle et al., 2003), and structural probing experiments, indicating the presence of an allosteric linkage between the elongation factor binding site and the P-loop of the 23S rRNA (Sergiev et al., 2005). However, since P/E complex formation could be Vio-induced rather than Vio-stabilized, we cannot exclude the possibility that, following GTP hydrolysis, the normal translocation pathway proceeds via fully coupled movement of both A-site and P-site tRNA to form the INT complex in a single step from PRE complex. In either case, it is clear that the rate constant for INT complex formation (~30 s−1) is considerably larger than the rate constant for overall translocation (~ 5 s-1), so that the conformational change step following EF-G-dependent GTP hydrolysis is not uniquely rate-limiting for translocation, as earlier proposed (Savelsbergh et al., 2003). Indeed, in the present case it is step 2, INT complex conversion to POST complex, which is more nearly rate-determining for overall translocation. However, initiator tRNAfMet is structurally distinct from other tRNAs (Rajbhandary, 1994), and it is possible that the balance between the rate constants for INT formation and disappearance is different for PRE complexes formed after the first elongation cycle that don’t contain initiator tRNAfMet.
The coupling of tRNA movement to conformational changes resulting from EF-G.GTP binding to the ribosome is an important aspect of translocation. The strong sensitivity of the translocation process, and, in particular, INT formation, to even subtle changes in the structure of P-site bound tRNA is shown by the effect of replacing native tRNAfMet by its wild-type transcript, lacking posttranscriptional modification, which lowers kapp1 almost 4-fold while not decreasing kapp2 (Table 3). D-loop or T-loop mutation within the tertiary core of the tRNA transcript, which would be expected to give rise to more profound changes in tRNA structure, have even more drastic effects on kapp1, leading to reductions of 30- to 80-fold, with lesser effects on kapp2.
The role of GTP
Both kinetic and thermodynamic factors are important in the translocation process, and GTP is important for both (Wilden et al., 2006). Our present results show that whereas GDPNP can substitute for GTP, albeit with lower efficiency, GDP cannot, and further show that the major difference between GTP and GDPNP is on the rate of INT complex formation, with little effect on INT complex conversion to POST complex. Since INT formation follows GTP hydrolysis and precedes Pi release (Figure 4), it is clear that the major rate enhancement effect of EF-G on translocation is produced while it is bound to the ribosome in the EF-G.GDP.Pi form (Savelsbergh et al., 2003; Pan et al., 2006). The complete lack of facilitation of translocation found with EF-G.GDP leads us to conclude that the conformations of the ribosome complexes formed by EF-G.GDP.Pi and EF-G.GDP are quite different, and the reduced rate found with EF-G.GDPNP suggests that it forms a ribosome complex more nearly resembling that formed by EF-G.GDP.Pi.
Efficient protein synthesis depends on translocation being unidirectional. The observations that 1) the final fluorescence changes for translocation are quite similar on addition of EF-G.GTP or EF-G.GDPNP to PRE complex (Figure 3A and Supplemental Figure 5) and 2) the POST complex formed in the presence of GDPNP has almost full reactivity toward puromycin (Table 2) suggest that, at least under our conditions, the POST complex containing EF-G.GDPNP is thermodynamically favored over the PRE complex, so that peptidyl-tRNA occupies the P/P site even in the absence of GTP hydrolysis. However, the overall decrease in free energy that is accompanied by both Pi and EF-G.GDP release should be important for driving the overall PRE to POST equilibrium even further in the direction of the POST complex, thus making reverse translocation exceedingly unfavorable. This conclusion is consistent with the reported ability of added GDP to reverse translocation from the POST complex achieved in the presence of GDPNP but not in the presence of GTP (Zavialov et al., 2005). The persistence of EF-G.GDPNP binding (Figure 3C), which blocks access to the A-site, accounts for the failure of the POST complex formed in the presence of GDPNP to react with release factor 2 and to react only slowly with Rel E (Zavialov and Ehrenberg, 2003; Zavialov et al., 2005).
The INT complex and the hybrid state
As the rate of mRNA translocation is equal to the rate of overall tRNA translocation to form the POST complex (Savelsbergh et al., 2003; Studer et al., 2003), and INT complex formation is clearly faster (Table 1, Figure 1) than overall translocation, we infer that peptidyl-tRNA within the INT complex binds to a hybrid A/P’ site, where P’ designates a reactivity toward puromycin that falls in between that of the PRE and POST complexes. The A/P’ hybrid site differs from the A/P* site proposed earlier (Green and Noller, 1997) to rationalize the very low puromycin reactivity of the PRE complex on two grounds: its rapid occupancy as a major species is EF-G.GTP dependent, and it has much higher puromycin reactivity. Identification of the INT complex and determination of its puromycin reactivity provide the first clear evidence for a movement of the 3’-terminus of peptidyl-tRNA to a position intermediate between the 50S A- and P-sites as part of the EF-G.GTP-dependent translocation process. It was previously shown that substitution of a deletion mutant of EF-G for the full-length protein leads to formation of a puromycin-reactive species in the absence of translocation on the 30S subunit (Borowski et al., 1996), but the rate of formation of this species is much too slow to be kinetically competent as an intermediate in normal translocation.
Since there is good evidence that peptidyl-tRNA bound in the classical A/A site has essentially no puromycin reactivity (Sharma et al., 2004; Dorner et al., 2006), the very low puromycin reactivity of the PRE complex (Table 2) can be ascribed to a small amount of A/P’ site occupancy (≤ 1%) within the PRE complex, with INT complex formation on EF-G.GTP addition shifting the A/A ⇌ A/P’ equilibrium strongly to the right. This is consistent with evidence showing that for the PRE complex in the first elongation cycle, peptidyl-tRNA binding to the A/A site is strongly favored, due perhaps to the unique structure of initiator tRNAfMet (Dorner et al., 2006). Other PRE complexes may populate the A/P’ site to a greater extent, depending on both the identity of the bound tRNAs, and the length of attached polypeptide (Dorner et al., 2006). Single molecule studies that have been interpreted as indicating facile interconversion of classical and hybrid states (Blanchard et al., 2004) support the notion of an A/A ⇌ A/P’ equilibrium within the PRE complex.
In summary, we have shown that a) during the translocation step of translation, conversion of PRE complex to POST complex proceeds via a kinetically competent INT complex, in which peptidyl-tRNA, bound in a hybrid site, has a puromycin reactivity intermediate between that of PRE and POST complexes, b) translocation is facilitated by EF-G.GTP and less well by EF-G.GDPNP, but not at all by EF-G.GDP or EF-G alone, and c) the greater potency of EF-G.GTP in facilitating translocation derives from its effects on INT complex formation, with the rate constant for INT complex conversion to POST complex being similar for EF-G.GTP and EF-G.GDPNP.
EXPERIMENTAL PROCEDURES
Tight-coupled ribosomes from E. coli MRE600 cells, cloned E. coli His-tagged proteins EF-G, EF-Tu, IF1, IF2, and IF3, and mRNA AUG022 were obtained and purified as described (Pan et al., 2006), except the EF-G went through an additional FPLC MonoQ column using a gradient of 50 mM to 350 mM KCl.
tRNAfMet and tRNAPhe from E. coli and tRNAPhe from yeast, all acquired from Chemical Block (Moscow) were prepared in fluorescently labeled form via reduction of D-loop dihydrouridines with NaBH4 and replacement of the resulting ureidopropanols with proflavin, as described earlier for the preparation of yeast tRNAPhe(prf16/17) (Wintermeyer and Zachau, 1979). The positions of prf labeling are 20 (E. coli tRNAfMet) 16 and 20 (E. coli tRNAPhe), and 16 and 17 (yeast tRNAPhe). The following stoichiometries of prf labeling were achieved: E. coli tRNAfMet, 1.0; E. coli tRNAPhe, 1.9; yeast tRNAPhe, 1.7. Unlabeled and prf-labeled E. coli tRNAfMet and E. coli tRNAPhe were charged with either partially purified E. coli tRNA synthetase (Pan et al., 2006) or pure E. coli Phe tRNA synthetase (a gift from Ya-Ming Hou) in buffer containing 100 mM Tris (pH 7.8), 4 mM ATP, 20 mM MgCl2, 1 mM EDTA, 10 mM KCl, and 7 mM 2-mercaptoethanol, and purified by FPLC monoQ column chromatography (Rodnina et al., 1994) giving 1200 and 680 pmol/A260 for unlabeled and prf-labeled tRNAfMet respectively, and 1130 pmol/A260 and 550 pmol/A260 for unlabeled and prf-labeled tRNAPhe, respectively. Addition of 30% DMSO was required for efficient charging of prf-labeled tRNAPhe. Prf labeled yeast tRNAPhe was charged with partially purified yeast tRNA synthetase in buffer containing 100 mM Tris (pH 8.0), 10 mM ATP, 50 mM MgCl2, and 3 mM 2-mercaptoethanol, and purified as above, giving 530 pmol/A260.
Complex preparation
All complexes were made up in Buffer A (50 mM Tris-HCl (pH 7.5), 70 mM NH4Cl, 30 mM KCl, 7 mM MgCl2, 1 mM DTT) at 37 oC. Initiation complex was formed by incubating ribosomes (1 μM) with mRNA022 (4 μM), IF1 (1.5 μM), IF2 (1.5 μM), IF3 (1.5 μM), GTP (1 mM) and [35S]-fMet-tRNAfMet (1.5 μM) for 25 min. Ternary complex was formed by incubating EF-Tu (3 μM) with [3H]-Phe-tRNAPhe(prf16/17) (3 μM), GTP (1 mM), phosphoenolpyruvate (Roche Diagnostics) (1.5 mM), pyruvate kinase (Roche Diagnostics) (0.5 mg/L) for 5 min. Pre-translocation complex (PRE) was formed by mixing initiation complex (0.5 μM) with ternary complex (0.75 μM) and incubating for 30 sec, and purified by centrifugation through 400 μL of a 1.1 M sucrose cushion in Buffer B (same as buffer A but with 20 mM MgCl2) (450,000 g, 45 min, 4 ºC) The stoichiometries per ribosome of tRNA-bound [35S ]-fMet and [3H]-Phe, measured by nitrocellulose filtration, were 0.7–0.8 and 0.6–0.7, respectively. A second sucrose cushion centrifugation was sometimes employed, as indicated, to remove all traces of GTP contamination derived from inititation and ternary complexes. This reduced tRNA-bound [35S ]-fMet and [3H]-Phe stoichiometries relative to single sucrose-cushion purification by ~ 25%. Post-translocation complex (POST) was formed by mixing 0.2 μM PRE complex with 0.4 μM EF-G and either GTP or GDPNP (0.5 mM) and incubating for 1 min in 37 ºC. All protein concentrations were determined by Bradford (1968) assay. Stock solutions of antibiotics were made up in water [spectinomycin (Sigma); viomycin (Research Diagnostics)] or DMSO [thiostrepton (Sigma)].
EF-G binding
PRE complex (0.3 μM) and EF-G (1 μM) were mixed on ice in the presence or absence of G-nucleotide (1 mM) and/or of fusidic acid (1 mM) in a total volume of 200 μL and incubated at 37 ºC for 2 min and centrifuged through 400 uL 1.1 M sucrose cushion in buffer A (450,000 g, 45 min, 4 ºC ). The pellet was dissolved in water and analyzed by one-dimensional SDS-PAGE (10% acrylamide).
Kinetics
Kinetics experiments were carried out in buffer A at 25 ºC. Given below are concentrations after mixing. In all translocation experiments, pretranslocation complex (0.1 μM) was rapidly mixed with EF-G and either GTP, GDPNP, or GDP (all 0.5 mM unless otherwise indicated). Experiments with GDP were performed either with GDP as purchased from Sigma, or after purification on MonoQ, as described (Wilden et al, 2006). The latter was devoid of GTP content, and is denoted GTP-free. The former had a GTP content of ~ 0.6 %, as measured by HPLC- ion exchange column PARTISIL 10 SAX (Whatman) chromatography (linear gradient, 0.07 mM NaH2PO4/0.4 M NaCl to 0.35 mM NaH2PO4/2 M NaCl, 20 min; isocratic elution, 0.35 mM NaH2PO4/2 M NaCl, 5 min.). As appropriate, antibiotics were preincubated with PRE complex for 1 min at 37 ºC before mixing with EF-G.GTP. Stopped flow and quench flow experiments were performed as described (Pan et al., 2006). Apparent rate constants were obtained by fitting to either single- or double-exponential equations using Igor-Pro (Wavemetrics). kcat and Km values were obtained by fitting the curves of kapp as a function of EF-G or puromycin concentration to the Michaelis-Menton equation.
Supplementary Material
Acknowledgments
This work is supported by an NIH grant to B.S.C. (GM071014). We thank Ya-Ming Hou for providing tRNAfMet mutants.
Footnotes
Publisher's Disclaimer: This is a PDF file of an unedited manuscript that has been accepted for publication. As a service to our customers we are providing this early version of the manuscript. The manuscript will undergo copyediting, typesetting, and review of the resulting proof before it is published in its final citable form. Please note that during the production process errors may be discovered which could affect the content, and all legal disclaimers that apply to the journal pertain.
References
- Agrawal RK, Linde J, Sengupta J, Nierhaus KH, Frank J. Localization of L11 protein on the ribosome and elucidation of its involvement in EF-G-dependent translocation. J Mol Biol. 2001;311:777–787. doi: 10.1006/jmbi.2001.4907. [DOI] [PubMed] [Google Scholar]
- Blanchard SC, Kim HD, Gonzalez RL, Jr, Puglisi JD, Chu S. tRNA dynamics on the ribosome during translation. Proc Natl Acad Sci USA. 2004;101:12893–12898. doi: 10.1073/pnas.0403884101. [DOI] [PMC free article] [PubMed] [Google Scholar]
- Boelens R, Gualerzi CO. Structure and function of bacterial initiation factors. Curr Protein Pept Sci. 2002;3:107–119. doi: 10.2174/1389203023380765. [DOI] [PubMed] [Google Scholar]
- Borowski C, Rodnina MV, Wintermeyer W. Truncated elongation factor G lacking the G domain promotes translocation of the 3' end but not of the anticodon domain of peptidyl-tRNA. Proc Natl Acad Sci USA. 1996;93:4202–4206. doi: 10.1073/pnas.93.9.4202. [DOI] [PMC free article] [PubMed] [Google Scholar]
- Bradford MM. A rapid and sensitive method for the quantitation of microgram quantities of protein utilizing the principle of protein-dye binding. Anal Biochem. 1976;72:248–254. doi: 10.1016/0003-2697(76)90527-3. [DOI] [PubMed] [Google Scholar]
- Bretscher MS. Translocation in protein synthesis: a hybrid structure model. Nature. 1968;218:675–677. doi: 10.1038/218675a0. [DOI] [PubMed] [Google Scholar]
- Brink MF, Brink G, Verbeet MP, de Boer HA. Spectinomycin interacts specifically with the residues G1064 and C1192 in 16S rRNA, thereby potentially freezing this molecule into an inactive conformation. Nucleic Acids Res. 1994;22:325–331. doi: 10.1093/nar/22.3.325. [DOI] [PMC free article] [PubMed] [Google Scholar]
- Carter AP, Clemons WM, Brodersen DE, Morgan-Warren RJ, Wimberly BT, Ramakrishnan V. Functional insights from the structure of the 30S ribosomal subunit and its interactions with antibiotics. Nature. 2000;407:340–348. doi: 10.1038/35030019. [DOI] [PubMed] [Google Scholar]
- Datta PP, Sharma MR, Qi L, Frank J, Agrawal RK. Interaction of the G' domain of elongation factor G and the C-terminal domain of ribosomal protein L7/L12 during translocation as revealed by cryo-EM. Mol Cell. 2005;20:723–731. doi: 10.1016/j.molcel.2005.10.028. [DOI] [PubMed] [Google Scholar]
- Dorner S, Brunelle JL, Sharma D, Green R. The hybrid state of tRNA binding is an authentic translation elongation intermediate. Nat Struct Mol Biol. 2006;13:234–241. doi: 10.1038/nsmb1060. [DOI] [PMC free article] [PubMed] [Google Scholar]
- Green R, Noller HF. Ribosomes and translation. Annu Rev Biochem. 1997;66:679–716. doi: 10.1146/annurev.biochem.66.1.679. [DOI] [PubMed] [Google Scholar]
- Katunin VI, Savelsbergh A, Rodnina MV, Wintermeyer W. Coupling of GTP hydrolysis by elongation factor G to translocation and factor recycling on the ribosome. Biochemistry. 2002;41:12806–12812. doi: 10.1021/bi0264871. [DOI] [PubMed] [Google Scholar]
- Laursen BS, Sorensen HP, Mortensen KK, Sperling-Petersen HU. Initiation of protein synthesis in bacteria. Microbiol Mol Biol Rev. 2005;69:101–123. doi: 10.1128/MMBR.69.1.101-123.2005. [DOI] [PMC free article] [PubMed] [Google Scholar]
- Mitra K, Frank J. Ribosome dynamics: insights from atomic structure modeling into cryo-electron microscopy maps. Annu Rev Biophys Biomol Struct. 2006;35:299–317. doi: 10.1146/annurev.biophys.35.040405.101950. [DOI] [PubMed] [Google Scholar]
- Moazed D, Noller HF. Interaction of antibiotics with functional sites in 16S ribosomal RNA. Nature. 1987;327:389–394. doi: 10.1038/327389a0. [DOI] [PubMed] [Google Scholar]
- Moazed D, Noller HF. Intermediate states in the movement of transfer RNA in the ribosome. Nature. 1989;342:142–148. doi: 10.1038/342142a0. [DOI] [PubMed] [Google Scholar]
- Ogle JM, Ramakrishnan V. Structural insights into translational fidelity. Annu Rev Biochem. 2005;74:129–177. doi: 10.1146/annurev.biochem.74.061903.155440. [DOI] [PubMed] [Google Scholar]
- Pan D, Kirillov S, Zhang CM, Hou YM, Cooperman BS. Rapid ribosomal translocation depends on the conserved 18–55 base pair in P-site transfer RNA. Nat Struct Mol Biol. 2006;13:354–359. doi: 10.1038/nsmb1074. [DOI] [PubMed] [Google Scholar]
- Pape T, Wintermeyer W, Rodnina MV. Complete kinetic mechanism of elongation factor Tu-dependent binding of aminoacyl-tRNA to the A site of the E. coli ribosome. EMBO J. 1998;17:7490–7497. doi: 10.1093/emboj/17.24.7490. [DOI] [PMC free article] [PubMed] [Google Scholar]
- Peske F, Savelsbergh A, Katunin VI, Rodnina MV, Wintermeyer W. Conformational changes of the small ribosomal subunit during elongation factor G-dependent tRNA-mRNA translocation. J Mol Biol. 2004;343:1183–1194. doi: 10.1016/j.jmb.2004.08.097. [DOI] [PubMed] [Google Scholar]
- RajBhandary UL. Initiator transfer RNAs. J Bacteriol. 1994;176:547–552. doi: 10.1128/jb.176.3.547-552.1994. [DOI] [PMC free article] [PubMed] [Google Scholar]
- Ramakrishnan V. Ribosome structure and the mechanism of translation. Cell. 2002;108:557–572. doi: 10.1016/s0092-8674(02)00619-0. [DOI] [PubMed] [Google Scholar]
- Rodnina MV, Semenkov YP, Wintermeyer W. Purification of fMet-tRNA(fMet) by fast protein liquid chromatography. Anal Biochem. 1994;219:380–381. doi: 10.1006/abio.1994.1282. [DOI] [PubMed] [Google Scholar]
- Rodnina MV, Savelsbergh A, Katunin VI, Wintermeyer W. Hydrolysis of GTP by elongation factor G drives tRNA movement on the ribosome. Nature. 1997;385:37–41. doi: 10.1038/385037a0. [DOI] [PubMed] [Google Scholar]
- Rodnina MV, Savelsbergh A, Matassova NB, Katunin VI, Semenkov YP, Wintermeyer W. Thiostrepton inhibits the turnover but not the GTPase of elongation factor G on the ribosome. Proc Natl Acad Sci USA. 1999;96:9586–9590. doi: 10.1073/pnas.96.17.9586. [DOI] [PMC free article] [PubMed] [Google Scholar]
- Savelsbergh A, Katunin VI, Mohr D, Peske F, Rodnina MV, Wintermeyer W. An elongation factor G-induced ribosome rearrangement precedes tRNA-mRNA translocation. Mol Cell. 2003;11:1517–1523. doi: 10.1016/s1097-2765(03)00230-2. [DOI] [PubMed] [Google Scholar]
- Savelsbergh A, Mohr D, Kothe U, Wintermeyer W, Rodnina MV. Control of phosphate release from elongation factor G by ribosomal protein L7/12. EMBO J. 2005;24:4316–4323. doi: 10.1038/sj.emboj.7600884. [DOI] [PMC free article] [PubMed] [Google Scholar]
- Schmeing TM, Huang KS, Strobel SA, Steitz TA. An induced-fit mechanism to promote peptide bond formation and exclude hydrolysis of peptidyl-tRNA. Nature. 2005;438:520–524. doi: 10.1038/nature04152. [DOI] [PubMed] [Google Scholar]
- Selmer M, Dunham CM, Murphy FV, IV, Weixlbaumer A, Petry S, Kelley AC, Weir JR, Ramakrishnan V. Structure of the 70S ribosome complexed with mRNA and tRNA. Science. 2006;313:1935–1942. doi: 10.1126/science.1131127. [DOI] [PubMed] [Google Scholar]
- Semenkov YP, Shapkina TG, Kirillov SV. Puromycin reaction of the A-site bound peptidyl-tRNA. Biochimie. 1992;74:411–417. doi: 10.1016/0300-9084(92)90080-x. [DOI] [PubMed] [Google Scholar]
- Seo HS, Abedin S, Kamp D, Wilson DN, Nierhaus KH, Cooperman BS. EF-G-dependent GTPase on the ribosome conformational change and fusidic acid inhibition. Biochemistry. 2006;45:2504–2514. doi: 10.1021/bi0516677. [DOI] [PubMed] [Google Scholar]
- Sergiev PV, Lesnyak DV, Burakovsky DE, Kiparisov SV, Leonov AA, Bogdanov AA, Brimacombe R, Dontsova OA. Alteration in location of a conserved GTPase-associated center of the ribosome induced by mutagenesis influences the structure of peptidyltransferase center and activity of elongation factor G. J Biol Chem. 2005;280:31882–31889. doi: 10.1074/jbc.M505670200. [DOI] [PubMed] [Google Scholar]
- Sharma D, Southworth DR, Green R. EF-G-independent reactivity of a pre-translocation-state ribosome complex with the aminoacyl tRNA substrate puromycin supports an intermediate (hybrid) state of tRNA binding. RNA. 2004;10:102–113. doi: 10.1261/rna.5148704. [DOI] [PMC free article] [PubMed] [Google Scholar]
- Studer SM, Feinberg JS, Joseph S. Rapid kinetic analysis of EF-G-dependent mRNA translocation in the ribosome. J Mol Biol. 2003;327:369–381. doi: 10.1016/s0022-2836(03)00146-3. [DOI] [PubMed] [Google Scholar]
- Tomsic J, Vitali LA, Daviter T, Savelsbergh A, Spurio R, Striebeck P, Wintermeyer W, Rodnina MV, Gualerzi CO. Late events of translation initiation in bacteria: a kinetic analysis. EMBO J. 2000;19:2127–2136. doi: 10.1093/emboj/19.9.2127. [DOI] [PMC free article] [PubMed] [Google Scholar]
- Valle M, Zavialov A, Sengupta J, Rawat U, Ehrenberg M, Frank J. Locking and unlocking of ribosomal motions. Cell. 2003;114:123–134. doi: 10.1016/s0092-8674(03)00476-8. [DOI] [PubMed] [Google Scholar]
- Wallace BJ, Tai PC, Davis BD. Selective inhibition of initiating ribosomes by spectinomycin. Proc Natl Acad Sci USA. 1974;71:1634–1638. doi: 10.1073/pnas.71.5.1634. [DOI] [PMC free article] [PubMed] [Google Scholar]
- Wilden B, Savelsbergh A, Rodnina MV, Wintermeyer W. Role and timing of GTP binding and hydrolysis during EF-G-dependent tRNA translocation on the ribosome. Proc Natl Acad Sci USA. 2006;103:13670–13675. doi: 10.1073/pnas.0606099103. [DOI] [PMC free article] [PubMed] [Google Scholar]
- Willie GR, Richman N, Godtfredsen WP, Bodley JW. Some characteristics of and structural requirements for the interaction of 24,25-dihydrofusidic acid with ribosome - elongation factor G complexes. Biochemistry. 1975;14:1713–1718. doi: 10.1021/bi00679a025. [DOI] [PubMed] [Google Scholar]
- Wintermeyer W, Zachau HG. Fluorescent derivatives of yeast tRNAPhe. Eur J Biochem. 1979;98:465–475. doi: 10.1111/j.1432-1033.1979.tb13207.x. [DOI] [PubMed] [Google Scholar]
- Wintermeyer W, Peske F, Beringer M, Gromadski KB, Savelsbergh A, Rodnina MV. Mechanisms of elongation on the ribosome: dynamics of a macromolecular machine. Biochem Soc Trans. 2004;32:733–737. doi: 10.1042/BST0320733. [DOI] [PubMed] [Google Scholar]
- Yonath A. Ribosomal crystallography: peptide bond formation, chaperone assistance and antibiotics activity. Mol Cells. 2005;20:1–16. [PubMed] [Google Scholar]
- Yusupov MM, Yusupova GZ, Baucom A, Lieberman K, Earnest TN, Cate JH, Noller HF. Crystal structure of the ribosome at 5.5 A resolution. Science. 2001;292:883–896. doi: 10.1126/science.1060089. [DOI] [PubMed] [Google Scholar]
- Yusupova GZ, Yusupov MM, Cate JH, Noller HF. The path of messenger RNA through the ribosome. Cell. 2001;106:233–241. doi: 10.1016/s0092-8674(01)00435-4. [DOI] [PubMed] [Google Scholar]
- Zavialov AV, Ehrenberg M. Peptidyl-tRNA regulates the GTPase activity of translation factors. Cell. 2003;114:113–122. doi: 10.1016/s0092-8674(03)00478-1. [DOI] [PubMed] [Google Scholar]
- Zavialov AV, Hauryliuk VV, Ehrenberg M. Guanine-nucleotide exchange on ribosome-bound elongation factor G initiates the translocation of tRNAs. J Biol. 2005;4:9. doi: 10.1186/jbiol24. [DOI] [PMC free article] [PubMed] [Google Scholar]
Associated Data
This section collects any data citations, data availability statements, or supplementary materials included in this article.