

Abstract
We previously showed that spike count response distributions in anterior cingulate neurons can be fitted by a mixture of a few Poisson distributions in our reward schedule task. Here we report that the neuronal responses in insular cortex, an area connected to anterior cingulate cortex, can also be nicely fitted. The ratio of Poisson distributions changed with schedule progress, suggesting that neuronal responses in these areas fall into discrete firing modes. More insular neurons show mode changes across the schedules. The selection of firing modes might be related to cognitive processes, but seems independent across the two areas.
Keywords: single unit, spike count, Poisson distribution, neural coding, response variability, rhesus monkey, reward expectancy
The numbers of spikes emitted by single neurons are often different even when the trial type is repeated several times. Describing responses according to their means and variances can be adequate when the distributions are unimodal. Wiener and Richmond (2002) pointed out that the distributions of spike counts across repeated trials in V1 could be fitted nicely using a mixture of a small number (usually 3 or fewer) of Poisson distributions. Each distribution has a different mean rate. Because the types and amounts of serial correlations within the spike trains will depend on the specific mixture of Poisson processes, responses represented by different mixtures of Poisson processes will have different temporal correlation structures. When monkeys performed a reward schedule task the spike counts of the neuronal responses in anterior cingulate cortex were well fitted by a mixture of small number of Poisson distributions (Shidara et al. 2005). Furthermore, the ratio of the mixtures of Poisson components seemed correlated with schedule progress in the reward schedule task. This mixture of Poisson distributions seemed to account for much of the non-Poisson temporal structure of the spike trains. We speculated that the cognitive states that were exhibited during performance of the reward schedule task might underlie probability changes in higher and lower firing components in anterior cingulate neurons.
Richmond et al. (2003) conceptualized anterior cingulate as a part of system related to the balance between work and reward. Their notion was consistent with past reports that proposed anterior cingulate and ventral striatum as components of a circuit that contributes to initiating the action elicited by motivationally salient stimuli (Alexander et al. 1986). Although the functional characteristics have not been specified, the anterior insula is part of a parallel circuit connecting to anterior cingulate and ventral striatum (Augustine, 1996). The connections across these circuits suggest that activity in anterior insula could be affected by reward-related signals arising from anterior cingulate. Preliminary results showed that a substantial number of single neuronal responses in monkey anterior insula encode information about the immediacy of forthcoming reward (Mizuhiki et al., 2003 SFN meeting). Thus the question arises: can anterior insular neurons be fitted by a mixture of Poisson distributions, in a manner similar to the anterior cingulate neurons? To investigate the hypothesis, we examined the responses of 120 single neurons in anterior insula of two rhesus monkeys while they performed a multitrial reward schedule task.
The task we used here was the same as that used for studying anterior cingulate cortex (Shidara and Richmond, 2002) and ventral striatum (Bowman et al., 1996; Shidara et al., 1998). In this task the monkeys touch a bar to initiate trials. To obtain a juice reward they must release the bar when a red target spot appearing shortly later turns green (simple sequential color discrimination trials). After the training period, these color discrimination trials are run as short schedules of 1, 2, 3 or 4 trials. A schedule is defined as the number of correct trials needed to obtain a reward. There are 10 schedule states across these four schedules. These schedule states are denoted as 1/1, 1/2, 2/2, 1/3, 2/3, 3/3, 1/4, 2/4, 3/4 and 4/4. A visual cue appears in each trial and remains on throughout the trial. The cue brightens stepwise as the schedule progresses, indicating whether the oncoming trial is to be rewarded. In non-rewarded trials, the cue brightness also indicates how many trials remain in the schedule. Thus, the cue’s brightness is related to the reward contingency and can be used to know whether the given trial is rewarded.
As shown in previous studies (Bowman et al., 1996; Shidara et al., 1998; Shidara and Richmond, 2002) the error rates and reaction times were smallest in the rewarded trials, and were progressively larger as the number of trials remaining before reward increased. These behavioral results show that the monkeys are sensitive to the meaning of the cue brightness and their motivation is related to reward proximity.
After the training period an aseptic surgical procedure was carried out under general anesthesia to attach a recording cylinder at anterior 15mm and lateral 18mm with respect to Horsely-Clarke reference frame. From MR examination the insula was estimated to extend from anterior 3 to 25mm. Recordings were made from anterior 13 to 18 mm, that is, in the middle to anterior part of the insula. All of the experiment procedures were approved by the Animal Care and Use Committee of AIST and were in accordance with the Guide for the Care and Use of Laboratory Animals as adopted by AIST.
Insular neurons responded at the various points in the trials, i.e., cue onset, wait signal, go signal, bar-release, correct signal, reward apparatus activation, and during the intertrial interval. We first identified the task events related to each neuronal response. To determine which events were best related to the neuronal responses, the spike trains of successfully completed trials were aligned to each task event. Then each response was convolved with a Gaussian pulse (s.d. 20 msec). The task event for which the peak of the average response was largest was identified. The numbers of neurons were 2, 11, 12, 23, 26, 37 and 9 for cue onset, wait signal, go signal, bar-release, correct signal, reward apparatus activation and intertrial interval, respectively. To determine the analysis window onset, the variance of spike counts was calculated by sliding a 400 msec window across the response in 5 msec steps over the 2000 msec period centered at the onset of related task event. We then carried out further analyses of the spike trains in a 400 msec period centered at the time of peak variance observed. In anterior cingulate we arbitrarily defined the data analysis window to cover entire response window, neuron by neuron (Shidara et al. 2005). In present study, however, we operationally defined the analytic window for each neuron as around the time of largest variability which is considered to carry largest amount of information. Figure 1 shows an example of a spike density plot overlaid with the variance curve of spike counts (dashed line). The response of this neuron was related to the bar-release event. The peak of the variance curve was at almost the same time as that of spike density. The 400ms period used for analysis is shaded. The spike counts within shaded period were fitted according to following model:
Fig. 1.
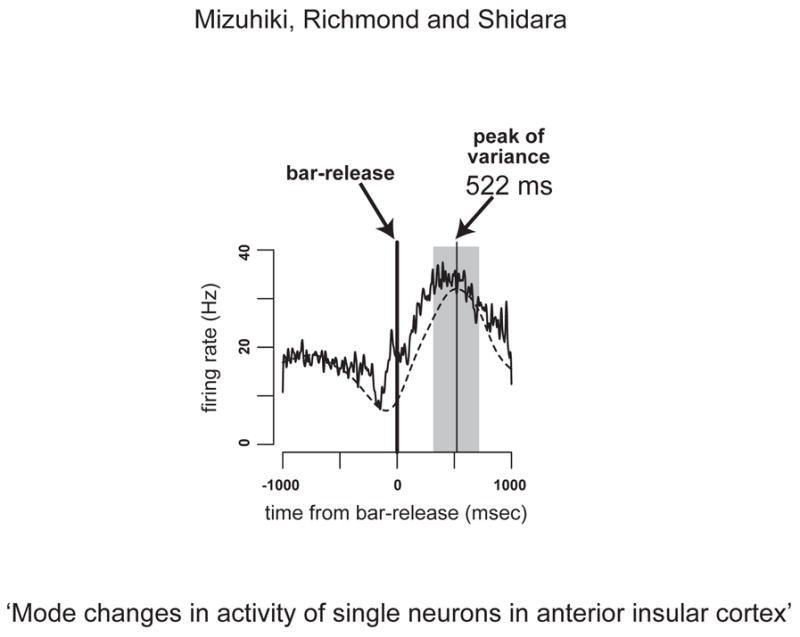
Example of a neuronal response related to bar-release. Horizontal axis indicates the time from bar-release (msec). Vertical axis indicates the firing rates. The spike density plot (solid line) was overlaid with variance curve (dashed line) which was analyzed by sliding 400 msec window across the response in 5 msec steps. The peak variance occurred 522 msec after the bar-release. The shaded area shows the 400 msec analysis window. We examined the spike trains within the shaded period.
where k is the number of Poisson distributions, wi is the weight and mi is the mean of ith distribution in the mixture. Here the probability of a particular spike count n from a mixture of Poisson distributions is the weighted sum of the probabilities of the count n from each of the individual Poisson distributions in the mixture. The same fitting algorithm was applied as in anterior cingulate (Shidara et al, 2005). A single Poisson distribution was fitted. If a chi-squared test showed that this spike count distribution adequately fitted (p > 0.05), the fitting was stopped. Otherwise, the spike count distribution was fitted again now using two Poisson distributions. The number of Poisson distributions was increased until a significant fit was achieved or 6 Poisson distributions were used. The parameters mi and wi of each distribution were estimated by maximizing log likelihood of the observed spike counts given the corresponding model. Figure 2 shows an example of neuronal responses and fitting results using data from the same neuron used for Figure 1. Figure 2a shows that this neuron had bar-release-related responses, and average firing rate in the shaded analysis window showed significant differences between the rewarded (1/1, 2/2, 3/3 and 4/4) and unrewarded (remaining all) schedule states, however, there were no significant differences among unrewarded schedule states (Tukey-test, p<0.01 between rewarded and unrewarded schedule states, p>0.01 among unrewarded schedule states). Figure 2b shows that the responses were well fitted by two Poisson distributions: a ‘low mode’ with fewer than 10 spikes, and a ‘high mode’ with more than 10 spikes. The mean and weight value for each mode is indicated on the fitting plots. For this example, the ratio of the mode corresponding to the higher firing rates increased as the schedule state came closer to the reward and that for the lower firing rates decreased. Therefore, change in the ratio of each mode across schedule is not simply due to the change in average firing rate within analysis window. In anterior cingulate neurons it seemed that the mode changes might be related to gradual changes in mean firing rate as the schedule progressed (Shidara and Richmond 2002). This did not seem to be the case for anterior insular neurons (Mizuhiki et al., 2003), suggesting that the mode change in anterior insula might act differently than in anterior cingulate neurons.
Fig. 2.
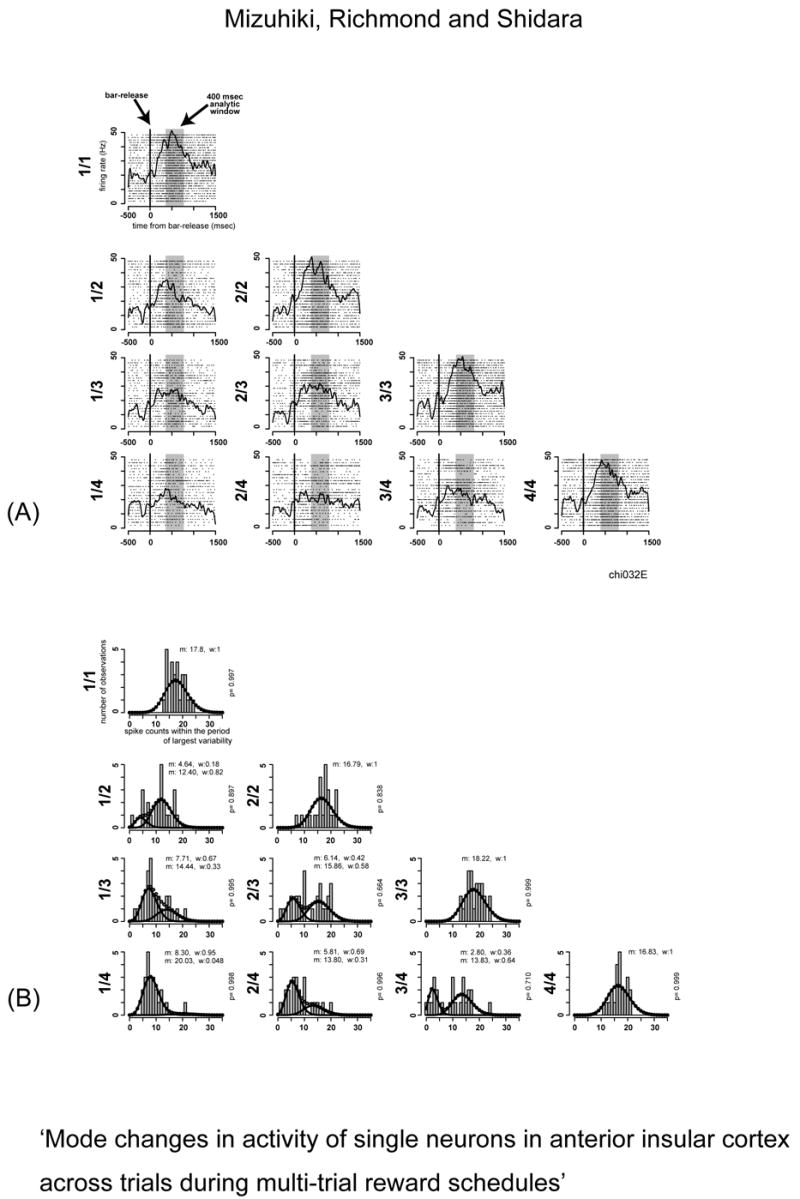
Example of neuronal responses and fitted results. This is the same neuron illustrated in figure 1. (A) The spike density plots with raster plots are shown in each schedule state. The responses are aligned to the time of bar-release. The shaded areas indicate the analysis window used for fitting. The bar-release related responses appeared in all trials. The differences were significant only between the rewarded state and the others (unrewarded states). (B) Histograms of spike counts superimposed with weighted Poisson distributions are shown for each schedule state. Mean (m) and weight (w) parameters of each distribution are also indicated on each plot. The p value indicated in right side of each plot shows the degree of goodness-of-fit (chi-squared test). The responses consist of a lower mode with fewer than 10 spike counts and higher mode with more than 10 spike counts taken from the shaded period in Panel (A).
These analyses were performed for all 10 schedule states over 120 neurons (a total of 1200 response distributions). Because we used a different method for identifying the time window for analysis in this study (Shidara et al. 2005), we also refitted the data from the anterior cingulate cortex using the method described here. The results are summarized in Table 1. Almost all of response sets were fitted by a mixture of 3 or fewer Poisson distributions for both anterior insula and anterior cingulate. We found that 51/120 (42.5%), 47/120 (39.2%) and 40/120 (33.3%) of insular neurons showed changes in the ratio of the different firing modes over the progress of the 4, 3 and 2 trial schedules, respectively. As shown in the lower row of Table 1, these percentages were significantly higher than those of anterior cingulate cortex (p < .005 for 2, 3 and 4 trial schedules, chi-squared test).
Table 1.
Classification of fitted responses in anterior insula and anterior cingulate.
| anterior insula | anterior cingulate | ||
|---|---|---|---|
| number of response sets fitted by Poisson distributions | single distribution | 675/1200 response sets (56.2%) | 1199/2360 (50.8%) |
| 2 | 463/1200 (38.6%) | 1073/2360 (45.5%) | |
| 3 | 60/1200 (5.0%) | 82/2360 (3.5%) | |
| over 4 | 2/1200 (0.2%) | 6/2360 (0.2%) | |
| number of neurons showing multimodal firing in more than 1 response set | 107/120 neurons (89.2%) | 223/236 (94.5%) | |
| number of neurons showing mode changes over schedule progress | 4 trial schedule | 51/120 neurons (42.5%) | 60/236 (25.4%) |
| 3 | 47/120 (39.2%) | 53/236 (22.5%) | |
| 2 | 40/120 (33.3%) | 45/236 (19.1%) | |
The classifications of the neurons in anterior cingulate were updated using the current method for determining the analysis window. The trends are consistent with the previous report (Shidara et al., 2005). A significantly higher proportion of insular neurons (see text) show mode changes along schedule progress (lower row).
Only 70/1200 (5.83%) response sets in insula showed significant correlation between the reaction times and spike counts (Pearson’s coefficient, p<0.05), as opposed to the approximately 30% seen in the anterior cingulate. These results suggest that the insular neurons are related to cognitive states in a different manner than anterior cingulate neurons. Anatomically, the insula has connections with a wide variety of neural structures including areas representing reward, and limbic integration of emotion, and visceral function (Mesulam and Mufson, 1982; Augustine, 1996). Although the insula is multifaceted, the mean firing rates of the insular neurons we recorded were stereotyped (cf Figure 2a). None of the insular neurons showed graded responses like those seen in anterior cingulate (Mizuhiki et al. 2003). One way that complex cognitive states can be represented using fewer neuronal states might be that larger numbers of insular neurons participate in ensembles of active neurons. Support for this idea comes from Cossart et al. (2003), who reported that synchronized UP state transitions (‘cortical flashes’) occur in spatially organized pattern of neurons in mouse cortex. They observed that different collections of neurons were involved in different patterns representing different cognitive content. They found that single cells can be active in more than one of these collections. Our analyses of the responses of single neurons can be interpreted to show dynamical state transitions of spatiotemporal pattern as a probabilistic change in a few discrete firing modes.
We previously pointed out that bimodal activity in striatal spiny cells (up and down states) (Wilson, 1995; Stern et al., 1997) might influence cortical neurons to switch firing states (Shidara et al., 2005). Another electrophysiological study using current injections has shown that cortical neuronal network might have intrinsic properties that give rise to several discrete firing rates (Egorov et al., 2002), similar to the neurons we observed. These circuits might underlie the fluctuation of a finite number of discrete firing modes in cortices that we observed. However, one question that arises is whether the firing modes might be synchronized across different brain regions or within functional circuits. If our fits represent different firing modes, the difference in the percentage of the neurons that showed mode changes over the schedule progress between anterior insula and anterior cingulate makes it seem unlikely that the modes are tightly synchronized across these two cortical areas. Nonetheless, the selection of the different modes might be related to the functional cognitive processing occurring in these two brain regions.
Acknowledgments
The work was supported by Grant-in-Aid for Scientific Research on Priority Areas -System study on higher-order brain functions- from MEXT of Japan and 21st Century COE Program and AIST/Japan. BJR is supported by the US NIMH intramural program.
Footnotes
Publisher's Disclaimer: This is a PDF file of an unedited manuscript that has been accepted for publication. As a service to our customers we are providing this early version of the manuscript. The manuscript will undergo copyediting, typesetting, and review of the resulting proof before it is published in its final citable form. Please note that during the production process errors may be discovered which could affect the content, and all legal disclaimers that apply to the journal pertain.
References
- Alexander GE, DeLong MR, Strick PL. Parallel organization of functionally segregated circuits linking basal ganglia and cortex. Ann Rev Neurosci. 1986;9:357–381. doi: 10.1146/annurev.ne.09.030186.002041. [DOI] [PubMed] [Google Scholar]
- Augustine JR. Circuitry and functional aspects of the insular lobe in primates including humans. Brain Res Rev. 1996;22:229–244. doi: 10.1016/s0165-0173(96)00011-2. [DOI] [PubMed] [Google Scholar]
- Bowman EM, Aigner TG, Richmond BJ. Neural signals in the monkey ventral striatum related to motivation for juice and cocaine reward. J Neurophysiol. 1996;75:1061–1073. doi: 10.1152/jn.1996.75.3.1061. [DOI] [PubMed] [Google Scholar]
- Cossart R, Aronov D, Yuste R. Attractor dynamics of network UP states in the neocortex. Nature. 2003;423:283–288. doi: 10.1038/nature01614. [DOI] [PubMed] [Google Scholar]
- Egorov AV, Hamam BN, Fransen E, Hasselmo ME, Alonso AA. Graded persistent activity in enthorhinal cortex neurons. Nature. 2002;420:173–178. doi: 10.1038/nature01171. [DOI] [PubMed] [Google Scholar]
- Mesulam MM, Mufson EJ. Insula of the old world monkey. III: efferent cortical output and comments on function. J comp neurol. 1982;212:38–52. doi: 10.1002/cne.902120104. [DOI] [PubMed] [Google Scholar]
- Mizuhiki T, Richmond BJ, Shidara M. Society for Neuroscience (2003) 2003 Abstract Viewer and Itinerary Planner. Society for Neuroscience; Washington DC: 2003. Single neurons in anterior insular cortex of rhesus monkey related to reward predictability during multi-trial reward schedules. Program No. 293.14. [Google Scholar]
- Richmond BJ, Liu Z, Shidara M. Predicting future rewards. Science. 2003;301:179–180. doi: 10.1126/science.1087383. [DOI] [PubMed] [Google Scholar]
- Shidara M, Aigner TG, Richmond BJ. Neuronal signals in the monkey ventral striatum related to progress through a predictable series of trials. J Neurosci. 1998;18:2613–2625. doi: 10.1523/JNEUROSCI.18-07-02613.1998. [DOI] [PMC free article] [PubMed] [Google Scholar]
- Shidara M, Richmond BJ. Anterior cingulate: single neuronal signals related to degree of reward expectancy. Science. 2002;296:1709–1711. doi: 10.1126/science.1069504. [DOI] [PubMed] [Google Scholar]
- Shidara M, Mizuhiki T, Richmond BJ. Neuronal firing in anterior cingulate neurons changes modes across trials in single states of multitrial reward schedules. Exp Brain Res. 2005;163:242–245. doi: 10.1007/s00221-005-2232-y. [DOI] [PubMed] [Google Scholar]
- Stern EA, Kincaid AE, Wilson CJ. Spontaneous subthreshould membrane potential fluctuations and action potential variability of rat corticostriatal and striatal neurons in vivo. J Neurophysiol. 1997;77:1697–1715. doi: 10.1152/jn.1997.77.4.1697. [DOI] [PubMed] [Google Scholar]
- Wiener MC, Richmond BJ. Decoding spike trains instant by instant using order statistics and the mixture-of-Poissons model. J Neurosci. 2002;23:2394–2406. doi: 10.1523/JNEUROSCI.23-06-02394.2003. [DOI] [PMC free article] [PubMed] [Google Scholar]
- Wilson CJ. The contribution of cortical neurons to the firing pattern of striatal spiny neurons. In: Houk JC, Davis JL, Beiser DG, editors. Models of information processing in the basal ganglia. MIT; Cambridge, MA: 1995. pp. 29–50. [Google Scholar]