

Abstract
First-pass contrast-enhanced (CE) myocardial perfusion imaging will experience effects at peak concentrations of contrast agent. A reduction in the signal intensity of left ventricular (LV) blood due to losses may effect estimates of the arterial input function (AIF) used for quantitative perfusion measurement. Imaging artifacts may also result from losses as well as off-resonance due to the bolus susceptibility. We hypothesized that losses would not be significant for measurement of the AIF in full-dose studies using a short echo time (TE = 0.6 ms). The purpose of this study was to directly measure in the LV cavity during first-pass perfusion. For single-dose Gd-DTPA (0.1 mmol/kg at 5 ml/s), the LV blood pool had a mean value of 9 ms (N = 10) at peak enhancement. Distortion of the AIF due to signal intensity loss will be less than 10% using TE = 0.6 ms.
Keywords: MRI, T∗2, first-pass perfusion, heart, EPI
First-pass contrast-enhanced (CE) myocardial perfusion imaging will experience effects at peak concentrations of contrast agent. A reduction in the signal intensity of left ventricular (LV) blood due to losses may result in distorted estimates of the arterial input function (AIF) used for quantitative myocardial blood flow measurements (1,2). Both the dual-bolus technique (3,4), which uses a low-concentration bolus for estimating the AIF, and the dual-sequence method (5–7), which acquires AIF reference images using a low TE and short saturation recovery (SR) delay, have been proposed to avoid distortion in the AIF. Imaging artifacts may also result from losses, as well as off-resonance effects associated with the bolus. We hypothesized that losses are not significant for measurement of the AIF in full-dose studies using a short echo time (TE = 0.6 ms). The purpose of this study was to directly measure in the LV cavity during first-pass perfusion imaging using a custom four-echo EPI sequence. Individual images at each TE were reconstructed at reduced spatial resolution, and was estimated by an exponential fit to the multiecho data set.
In previous studies measurements in the heart were used to characterize susceptibility variations (8) and to assess iron overload (9). In these studies, multiple-TE measurements were made using breath-held, gated, segmented sequences to provide high spatial and temporal resolution. In the present study a nonsegmented imaging sequence incorporating parallel imaging with limited spatial resolution was used to measure during the first pass of the bolus.
Materials and Methods
Imaging
Imaging was performed on a Siemens Avanto 1.5T scanner using a custom SR sequence with GRE-EPI readout. For each echo (echo train length (ETL) = 4) the same phase-encode lines were acquired and low-spatial-resolution images were reconstructed offline (using MATLAB) for each TE. estimates were calculated from the multiecho data sets. The imaging time per slice used in typical first-pass perfusion imaging was maintained for the measurements, which resulted in a lower in-plane spatial resolution in the phase-encoding direction due to the decreased number of phase encodes. In the majority of subjects, imaging was performed in each of three orthogonal directions (aligned with the axis of the heart) to measure with different voxel orientations in order to determine whether the effects were due to intravoxel dephasing caused by susceptibility gradients.
The imaging parameters were as follows: The frequency readout was 160 samples with bandwidth = 1645 Hz/pixel, TR = 5.5 ms, and TE = 1.30, 2.22, 3.14, 4.06 ms. Four slices were acquired sequentially during each RR-interval (ECG triggered) with each slice acquired following a 90° saturation preparation with TD = 50 ms preparation time. The acquisition time was approximately 135 ms per slice, including the preparation time (77-ms imaging duration per slice). A BIR4 RF SR prep pulse was used (10) to achieve a 90° saturation that was B1-insensitive. The read-out flip angle was 25° for SR prepped images (two initial frames without SR prep using a 5° readout flip angle were acquired as proton density-weighted reference images for surface coil intensity correction). The actual number of phase encodes acquired was 14, resulting in an imaging window of 77 ms. Parallel imaging using rate R = 2 temporal sensitivity encoding (TSENSE) (11) was used with 12-array elements to increased the spatial resolution to a 160 × 28 matrix size. The typical FOV was 360 × 270 mm2 with a corresponding in-plane spatial resolution of 2.3 × 9.6 mm2 with either a 4- or 8-mm slice thickness.
Experiments
Contrast studies were performed on 10 normal volunteers after they provided informed consent. In eight of the 10 subjects imaging was performed in each of three orthogonal directions two short-axis (two slices) and one long-axis (two- and four-chamber views), so that could be estimated with the rectangular voxel in different spatial orientations. In the other two subjects, four short-axis slices were acquired. In all 10 subjects, 8-mm slices were acquired. In seven of the 10 volunteers, 4-mm slices were additionally acquired during a second bolus injection (following the bolus used for 8-mm slices by approximately 30 min) to test for differences in for different voxel sizes. Time-intensity curves for the LV blood pool during the first pass were generated for each TE using manually traced regions of interest (ROI) covering the majority of the blood pool. was estimated by least-squares fit of an exponential to the signal intensity of four TE images.
The accuracy of the estimates were assessed by Monte Carlo simulation (256 trials) of a least-squares fit to a signal plus noise using the actual values of TE and values of SNR in the measured range. The SNR of the peak LV blood pool signal in the ROI was measured using noise values measured prescan (12). The Monte Carlo simulation was performed for values of ranging from 5 to 20 ms. The simulation used an ROI size of 20 independent voxels (which corresponded to approximately 80 image voxels after interpolation for square voxels).
Distortion of the estimate of the AIF was characterized by using the values of the least-squares curve fit to predict the AIF for various values of TE. The peak signal loss, exp(−TE/ ), and full width at half maximum (FWHM) were estimated for TE = 0.6 and 1.5 ms, relative to the signal intensity curve predicted for TE = 0.
Images were acquired for 40–50 heartbeats beginning approximately 2 s prior to administration of a single-dose bolus (0.1 mmol/kg) of contrast agent (Gadopentetate Dimeglumine (Berlex Magnevist) at 5 ml/s followed by a saline flush 20 ml at 5 ml/s) administered intravenously in the left antecubital vein.
Results
The LV blood pool signal intensity at the time of peak contrast enhancement was visibly reduced at longer values of TE (Fig. 1). Short-axis and four-chamber long-axis views are shown for the same subject at times of peak RV blood enhancement, peak LV blood enhancement, and peak myocardial enhancement. The time-intensity curves of the LV blood pool ROI show that effects are only significant at peak Gd concentrations during the first pass (Fig. 2). The undistorted time-intensity curve (Fig. 2, dotted line) estimated for TE = 0 is shown for comparison. The time-intensity curves (Fig. 2) for this subject were representative. Measurement of of the LV blood pool at peak concentration for the full dose was 9.1 ± 3.1 ms (mean ± SD, N = 10) for the 8-mm-thick short-axis slices.
FIG. 1.
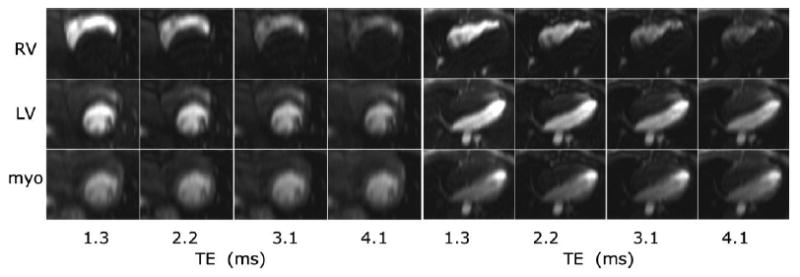
Multiecho images for short-axis (left) and four-chamber (right) views at the time of peak RV enhancement (top row), peak LV enhancement (middle row), and peak myocardial enhancement (bottom row) for TE = 1.3, 2.2, 3.1, and 4.1 ms (left to right). Note the decrease in blood pool signal intensity at longer TE for peak RV and LV enhancement due to the high Gd concentrations of the bolus.
FIG. 2.
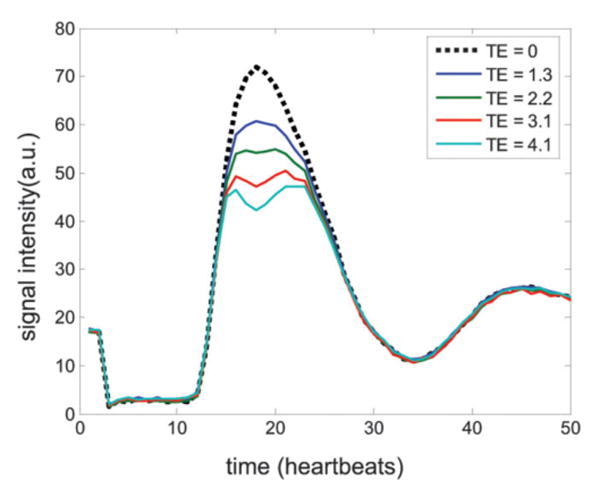
Time-intensity curves for the LV blood pool ROI for each TE. The TE = 0 curve (dotted line) is estimated based on a least-squares fit to the multiecho data set. The initial two time frames are proton density reference images.
For the seven studies for which there were six measurements (3 orientations × 2 slice thickness values) the estimate was 9.3 ± 3.7 (mean ± SD) ranging from 5.6 to 21 ms, estimated from all the measurements. A one-way analysis of variance (ANOVA) indicated that the mean study-to-study variation had statistical significance (P < 10−6), which contributed to the relatively large variance (see Discussion). A nonparametric test (Kruskal-Wallis) revealed the same statistical significance. The standard deviation (SD) of the six measurements per study ranged from 0.4 to 3 ms, with a mean value of 1.1 ms. The study with the highest measured SD (3 ms) corresponded to the study with highest estimate (mean = 17 ms), while the study with the lowest SD (0.4 ms) was one of the studies with a low mean value (7.3 ms). This implies that the loss was independent of slice orientation or thickness, and therefore was not due to intravoxel dephasing.
The measured SNR in the LV blood pool used for the Monte Carlo simulation was in the range of 29–72 (56 ± 14, N = 7) for the 8-mm slice thickness, and 18–37 (30 ± 6, N = 7) for the 4-mm slice thickness. For an actual value of = 5 ms, the estimates for the Monte Carlo simulation had SDs of 0.25, 0.2, 0.11, 0.10, 0.08 ms at SNR = 20, 30, 40, 50, and 60, respectively. For an actual value of = 20 ms, the estimates for the Monte Carlo simulation had SDs of 2.5, 1.7, 1.25, 1.0, and 0.8 ms at SNR = 20, 30, 40, 50, and 60, respectively.
Distortion of the AIF was estimated at TE = 0.6 and 1.5 ms relative to the undistorted AIF predicted for TE = 0. For = 6 ms, signal loss at the peak LV blood pool enhancement ranged between 10% (TE = 0.6 ms) and 23% (TE = 1.5 ms). For = 12 ms, signal loss at the peak LV blood pool enhancement ranged between 5% (TE = 0.6 ms) and 12% (TE = 1.5 ms). At = 6 ms, the increase in FWHM was 5% (TE = 0.6 ms) and 12% (TE = 1.5 ms). At = 12 ms, the increase in FWHM was 2% (TE = 0.6 ms) and 6% (TE = 1.5 ms).
Discussion
The accuracy of measurements depends on both the SNR and the values of TE used for measurement. The measurements in this study were aimed at measuring the at peak bolus concentrations where the is shortest and the LV blood pool signal intensity has high SNR. For accurate measurements at higher values of corresponding to lower concentrations of Gd, longer values of TE would be required. For more accurate measurements during the complete first pass, higher SNR might be achieved by using a sequence without an SR preparation. The spatial resolution was adequate for LV blood pool measurements, which was the objective of the current experiments to quantify distortion of the AIF. measurements in the myocardium are not reported here, due to limited spatial resolution, reduced SNR, and longer than expected 's, which would result in reduced accuracy.
Within each study the measurements agreed well for each slice thickness and each of three orthogonal orientations, with relatively low SDs (mean = 1.1 ms). The study-to-study variation in mean may be attributable to a number of other factors, such as differences in actual concentrations.
values at 3T at peak bolus concentrations during the first pass were recently reported (13) for measurements in the aorta. These data also have implications for cardiac perfusion imaging at 3T, and highlight the significance of losses for quantitative perfusion analysis. Measurements at 3T were made with a dual-echo T1-weighted sequence to characterize and correct the effect of losses on the AIF. The measured values at 3T showed significant losses at TE = 1.5 ms, which is consistent with our findings at 1.5T in the heart.
Conclusions
There was no significant difference in the measured values for different voxel sizes or orientations within the LV cavity. This suggests that the measured values are an intrinsic (i.e., microscopic) property at this level of peak Gd concentration, and are therefore independent of the spatial resolution. These measurements support the previous statement (5) that losses are not significant for measurement of the AIF at short TE. For scans using the dual-sequence method with TE = 0.6 ms for the AIF measurement, the losses would be 5–10% for in the 6–12-ms range. For single-bolus studies at longer TEs typically used for first-pass imaging, the losses may be significant and distort the shape of the AIF. For example, losses as high as 23% are possible at TE = 1.5 ms, and the FWHM is increased by 12%. Therefore, attempting to estimate the AIF using a single-bolus experiment with TE ≥ 1.5 can be expected to distort the AIF and reduce the ability to quantify perfusion.
Because of the limited spatial resolution in the current experiment, which focused on effects on the AIF, we did not characterize myocardial . Both -induced signal intensity losses and off-resonance effects may lead to artifacts at the endocardial rim. A higher-resolution study would be necessary to accurately characterize distortions of the point-spread function (PSF) that may cause subtle artifacts.
Footnotes
† This article is a US Government work and, as such, is in the public domain in the United States of America.
References
- 1.Jerosch-Herold M, Seethamraju RT, Swingen CM, Wilke NM, Stillman AE. Analysis of myocardial perfusion MRI. J Magn Reson Imaging. 2004;19:758–770. doi: 10.1002/jmri.20065. [DOI] [PubMed] [Google Scholar]
- 2.Jerosch-Herold M, Wilke N, Stillman AE, Wilson RF. MR quantification of the myocardial perfusion reserve with a Fermi function model for constrained deconvolution. Med Phys. 1998;25:73–84. doi: 10.1118/1.598163. [DOI] [PubMed] [Google Scholar]
- 3.Christian TF, Rettmann DW, Aletras AH, Liao SL, Taylor JL, Balaban RS, Arai AE. Absolute myocardial perfusion by MRI using a dual-bolus first-pass method: benefits over qualitative and semi-quantitative analysis. Radiology. 2004;232:677–684. doi: 10.1148/radiol.2323030573. [DOI] [PubMed] [Google Scholar]
- 4.Hsu L, Rhoads KL, Holly JE, Kellman P, Aletras AH, Arai AE. Quantitative myocardial perfusion analysis with a dual-bolus contrast enhanced first-pass MR imaging technique in humans. J Magn Reson Imaging. 2006;23:315–322. doi: 10.1002/jmri.20502. [DOI] [PubMed] [Google Scholar]
- 5.Gatehouse PD, Elkington AG, Ablitt NA, Yang GZ, Pennell DJ, Firmin DN. Accurate assessment of the arterial input function during high-dose myocardial perfusion cardiovascular magnetic resonance. J Magn Reson Imaging. 2004;20:39–45. doi: 10.1002/jmri.20054. [DOI] [PubMed] [Google Scholar]
- 6.Elkington AG, He T, Gatehouse PD, Prasad SK, Firmin DN, Pennell DJ. Optimization of the arterial input function for myocardial perfusion cardiovascular magnetic resonance. J Magn Reson Imaging. 2005;21:354–359. doi: 10.1002/jmri.20294. [DOI] [PubMed] [Google Scholar]
- 7.Kim D, Axel L. Multislice, dual-imaging sequence for increasing the dynamic range of the contrast-enhanced blood signal and CNR of myocardial enhancement at 3T. J Magn Reson Imaging. 2006;23:81–86. doi: 10.1002/jmri.20471. [DOI] [PubMed] [Google Scholar]
- 8.Reeder SB, Faranesh AZ, Boxerman JL, McVeigh ER. In vivo measurements of T2∗ and field inhomogeneity maps in the human heart at 1.5T. Magn Reson Med. 1998;39:988–998. doi: 10.1002/mrm.1910390617. [DOI] [PMC free article] [PubMed] [Google Scholar]
- 9.Westwood M, Anderson LJ, Firmin DN, Gatehouse PD, Charrier CC, Wonke B, Pennell DJ. A single breath-hold multiecho T2∗ cardiovascular magnetic resonance technique for diagnosis of myocardial iron overload. J Magn Reson Imaging. 2003;18:33–39. doi: 10.1002/jmri.10332. [DOI] [PubMed] [Google Scholar]
- 10.Kim D, Cernicanu A, Axel L. B(0) and B(1)-insensitive uniform T(1)-weighting for quantitative, first-pass myocardial perfusion magnetic resonance imaging. Magn Reson Med. 2005;54:1423–1429. doi: 10.1002/mrm.20704. [DOI] [PubMed] [Google Scholar]
- 11.Kellman P, Epstein FH, McVeigh ER. Adaptive sensitivity encoding incorporating temporal filtering (TSENSE) Magn Reson Med. 2001;45:846–852. doi: 10.1002/mrm.1113. [DOI] [PubMed] [Google Scholar]
- 12.Kellman P, McVeigh ER. Image reconstruction in SNR units: a general method for SNR measurement. Magn Reson Med. 2005;54:1439–1447. doi: 10.1002/mrm.20713. [DOI] [PMC free article] [PubMed] [Google Scholar]
- 13.de Bazelaire C, Rofsky NM, Duhamel G, Zhang J, Michaelson MD, George D, Alsop DC. Combined T2∗ and T1 measurements for improved perfusion and permeability studies in high field using dynamic contrast enhancement. Eur Radiol. 2006 doi: 10.1007/s00330-006-0198-1. [DOI] [PubMed] [Google Scholar]