

Abstract
The purpose of this study was to investigate the relationship between three-dimensional (3D) deformation patterns in the canine left ventricle and localized graded reductions in perfusion. Magnetic resonance (MR) tissue tagging in a clinical scanner was used to determine systolic 3D deformation throughout the left ventricle with 32-msec time resolution. Six dogs were studied at normal and reduced left anterior descending coronary artery flow levels, for a total of 14 studies. Deformation was calculated by fitting a 3D displacement field to tag displacement data from three orthogonal sets of tags and taking spatial derivatives. A novel index of 3D radial mechanical function, calculated from the 3D strain tensor components and the tissue incompressibility constraint, had a higher correlation (R = 0.94) with perfusion (colored microspheres) than any of the 3D Lagrangian finite strain tensor components or wall thickening. As a function of the fraction of baseline perfusion, it was well fit by a linear relationship for subnormal perfusion with a slope of 0.46 ± 0.05 and an intercept of −0.156 ± 0.026. Longitudinal strain was lost first with decreasing perfusion (48%), followed by circumferential (40%) and finally radial function (35%). The strain method detected perfusion drops as small as 20%, and early paradoxical strain transients lasting 100 msec were seen only with ischemia. 3D strain changes can be noninvasively measured throughout the left ventricle with MR tissue tagging. MR imaging-derived strain indices, unique to 3D analysis, correlate most sensitively with regional perfusion in the canine left ventricle.
Keywords: 3D deformation, Left ventricle, MRI, Perfusion, Strain, Tissue tagging
INTRODUCTION
Ischemic heart disease is a major cause of mortality and morbidity in the United States (1). Most ischemic cardiac dysfunction is caused by disease of the large coronary vessels.
Magnetic resonance (MR) tissue tagging (2–7) with dynamic imaging is a new and rapidly developing technique for the quantitative noninvasive evaluation of cardiac mechanical function. Tags are regions (usually planes) of tissue whose magnetization is altered by special MR pulse sequences. Differences in signal between tagged regions and undisturbed regions serve as a means of tracking the motion of the underlying tissue in subsequent MR images (8–10). Combined with mathematical techniques to reconstruct three-dimensional (3D) deformation from tag positions in cine MR images (11–14), this technology permits local strain evolution to be measured noninvasively with high spatial and temporal resolution throughout the heart wall.
The goal of this work was to study the relationship between perfusion changes due to large vessel coronary artery stenosis and local 3D deformation patterns obtained from this clinically applicable MR technique. The nature of this perfusion–strain relationship in the left ventricle (LV) is needed if MR imaging-based strain maps are to be used effectively in the evaluation of ischemic heart disease.
To investigate this relationship, a canine model of acute graded stenosis in the left anterior descending coronary artery (LAD) was developed. Cardiac deformation and perfusion were determined throughout the LV at multiple blood flow levels in the canine LAD bed.
METHODS
The study was approved by the Animal Care Committee of the Johns Hopkins University School of Medicine. Experiments were performed on six open-chest mongrel dogs (22–26 kg, heart worm negative), for a total of 14 strain/perfusion studies. Each dog was initially anesthetized with intravenous (IV) sodium pentobarbital (25 mg/kg) and then maintained on fentanyl. A left thoracotomy (fifth intercostal space) was used for access to the heart. Heparin sodium (10,000 USP units) was given IV after thoracotomy. Humidified 50% oxygenated air was supplied using a ventilator (Bear 1, Bourns Medical Systems, Riverside, CA) that was easily turned off during image acquisition at resting lung volume to obtain reproducible anatomic positioning.
Blood Flow Control
Locally graded perfusion was produced in the LAD bed distal to the first diagonal branch. The LAD flow control and monitoring system is shown in Fig. 1. Flow control was achieved by cannulating the subclavian artery and the LAD and connecting them with an intervening flow probe and a pressure-based resistor. The resistor consisted of 30 mm of latex tubing (3.2 mm inner diameter [ID], 0.8 mm thickness) suspended within a water-filled plastic casing (40 mm length, 30 mm width, 20 mm thickness) with a pressure port. Pressure within the chamber was adjusted remotely by a water-filled syringe in a screw clamp, attached by 10 m of silicone rubber tubing (1.6 mm ID, 1.6 mm thickness). With no pressure in the chamber, the ability of the LAD bed to produce a full hyperemic response after transient occlusion was maintained, as compared with precannulation flow measurements with a clip-on ultrasonic probe (model 2-S, Transonic Systems Inc., Ithaca, NY). As the volume filled the chamber, opposite walls of the latex tube would oppose at the midline, leaving two blood channels but not initially decreasing LAD flow. These channels gradually constricted as more fluid was injected. The flow resistor was easily adjustable and stable in vivo, requiring adjustment approximately every 5–10 min to maintain the desired flow rate.
Figure 1.

Coronary flow control. Blood flow from the subclavian artery is controlled by a pressure-based resistor, measured by an in-line ultrasonic probe, aid supplied to the LAD through a cannula just distal to the first diagonal branch. There is a tie proximal to the cannula insertion. The flow resistor is controlled remotely by a water-filled line and a syringe. Tightening the clamp on the syringe gradually collapses a tube within the pressure chamber to decrease LAD flow.
An ultrasonic flowmeter (model T106, Transonic Systems Inc.) with a probe muting option and an MR-compatible cannulating probe (model 2-N, brass fittings) with a 2-m extension cable were used to measure low in the LAD while the dog was inside the scanner. This probe was positioned distal to the resistor, within the cannulating bypass. The flow probe muting circuit stopped probe transmission during MR data acquisition to avoid image artifacts.
Monitoring and Pacing
Right atrial pacing at approximately 10 beats per minute (bpm) above baseline controlled the heart rate and improved cardiac beat-to-beat reproducibility and image quality (15). This electrical pacing spike was also used to synchronize the scanner.
The atrial pacing signal, ventricular electrocardiogram (ECG), left ventricular pressure, and LAD flow rate were simultaneously recorded on a chart recorder (model TA240S, Gould Inc., Cleveland, OH). Coronary perfusion pressure was monitored intermittently. The left ventricular pressure was measured with an MR-compatible pressure catheter (model SPC-350MR, Millar Instruments, Inc., Houston, TX) and the coronary perfusion pressure via 2-m extension tube and Stathem transducer. Figure 2 is a diagram of this system. Cable shielding grounded to the scanner room wall, radiofrequency filtering, and electrical isolation were used on all ECG channels to eliminate interference from the scanner. Pressure and flow monitoring cables were shielded and radiofrequency filtered.
Figure 2.

Cardiac pacing and monitoring. The pacemaker stimulates the right atrium and sends a signal to a computer, which triggers the scanner. The pacing and ECG channels were electrically isolated, and all signals were shielded and filtered to avoid interference from the scanner. The left ventricular pressure (LVP), coronary perfusion pressure (CPP), and blood flow in the left anterior descending coronary artery were also recorded.
MR Tagging and Imaging
MR imaging was performed with a Signa 1.5-T scanner with software release 4.7 (General Electric Corporation, Milwaukee, WI). A modified DANTE-SPAMM (3,5) parallel plane tagging method was used, followed by a segmented k-space, fractional-echo, gradient-echo imaging sequence (7) gated to the atrial pacing signal. The pulse sequence diagram is shown in Fig. 3. Two standard 5-inch surface coils (General Electric) were joined with a T-connector and placed on both sides of the chest for signal reception. The dog was in the right decubitus position.
Figure 3.
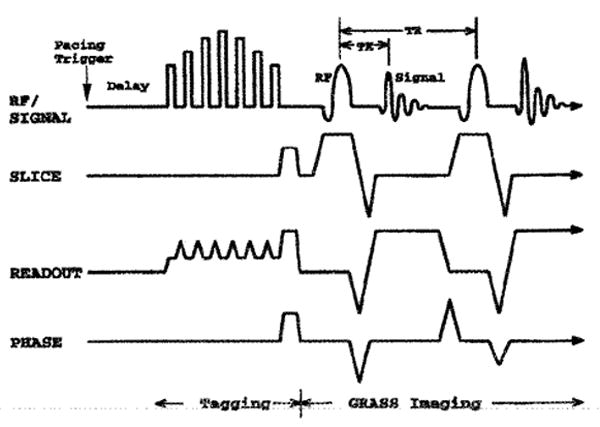
Tagging and imaging pulse sequence. A sequence generating parallel tags is followed by gradient-echo imaging with a fractional echo. After the atrial pacing pulse and a delay until end diastole, parallel tag planes were generated with seven radiofrequency (RF) pulses during which the readout gradient was partially decreased. A minimized echo time (TE) of 2.3 msec reduced motion artifact and the short repetition time (TR) of 6.5 msec permitted high time resolution.
At each LAD flow level, two sets of six parallel short-axis sections with orthogonal tag planes and one set of six radially oriented long-axis sections with tags parallel to the short axis were acquired. Each of these 18 acquisitions occurred during a 22-heartbeat breathhold and contained 8–12 phases through systole. Representative short- and long-axis images at early, mid, and late systole are shown in Fig. 4 to illustrate the image and tag orientation scheme. The first row shows a basal short-axis section at three phases of contraction. The second row is analogous to the first, but the tags are perpendicular. The last row is of a long-axis section at the same three times through systole.
Figure 4.

Tagged short- and long-axis images. Each row shows early (left), mid (middle), and late (left) systolic tagged images. The first two rows show a basal short-axis section with different tag orientations, and the bottom row shows a long-axis section. These images were taken with normal coronary blood flow.
The imaging parameters were as follows: 320-mm field of view, 8-mm slice thickness, 256 × 110 matrix, 6.5-msec repetition time, 2.3-msec echo time, one excitation, five phase-encoding views per movie frame (32.5-msec temporal resolution), 12-degree tip angle, 6-mm tag separation, and 180-degree tag inversion. Tag width and spacing were optimized to be approximately 1.5 and 7 pixels, respectively (16, 17). Tag lines were perpendicular to the frequency encoding axis to optimize detection (18).
Perfusion Measurement
At baseline and after imaging at each reduced LAD flow level, microsphere perfusion measurements were taken. Colored microspheres (19,20) (Dye-Trak, Triton Technology Inc., San Diego, CA) were chosen because radioactive materials could not be used in the clinical facility. The microspheres were resuspended by vortexing, followed by 5–10 min in an ultrasonic water bath. Red and yellow colors were used in all studies, and either blue or violet was used in studies with multiple reduced flow levels. Six million spheres at normal LAD flow and up to 10 million spheres for reduced LAD flow were injected into a cannula in the left atrial appendage. This was followed immediately by a 10-ml saline flush for a total injection duration of 5–10 sec. Blood reference samples were withdrawn from the proximal aorta through a 7Fr catheter that was advanced from the femoral artery. A syringe pump (model 901, Harvard Apparatus Co., Dover, MA) withdrew blood at 7.0 ml/min, beginning 30 sec before injection and continuing for 4 min. Afterward, a silicone rubber tube (1.5 m, 3.2 mm ID) that extended from the aortic catheter to the syringe was flushed into the withdrawal syringe with 20 ml of saline.
After each experiment and an overdose of sodium pentobarbital, the heart was arrested with IV KCI, removed, photographed, and cut into six short-axis slices of equal thickness. Each slice was photographed and cut radially to produce 12 sectors circumferentially. The mass and anatomic location of each sample were recorded. Tissue samples were digested in 16 ml of 2 N KOH at 72°C for 12–18 hr. Blood samples were divided into approximately 15-ml aliquots, and 4 ml of 16N KOH was added for digestion at room temperature for 12–18 hr. All samples were vacuum filtered onto 25-mm diameter polyethylene filters (Dye-Trak, 8-micron pores) to capture the spheres and rinsed thoroughly with saline followed by a 1-sec rinse with 70% ethanol for lipid removal and rapid drying. Filters were folded to trap the spheres and put into 1.5-ml polypropylene centrifuge tubes. Dimethyl formamide, 100 μl, was added to elute the dye, and the tubes were centrifuged to precipitate any free spheres. Finally, 70 μl was withdrawn from each tube and analyzed on a fixed diode array spectrophotometer (model HP8452A, Hewlett Packard, Palo Alto, CA). Spectral data were acquired over the range of 300–700 nm with a 2-sec integration time. Spectral curves were calibrated according to Beer's law, and samples were diluted if the peak absorbance exceeded 1.3 absorption units.
Numbers of spheres of each color in every sample were calculated using a commercial software package (HP89532Q, Hewlett Packard) that used a least-squares method to fit single-color standard spectra to the multi-component spectrum, an analysis that accounts for the partial overlap of the individual spectra. Spectral analysis was performed simultaneously over spectral ranges about the individual peaks to optimally differentiate among the colors: yellow, 420–460 nm (peak, 448 nm); red, 510–550 nm (peak, 530 nm); violet, 590–600 nm (peak, 594 nm); and blue, 650–690 nm (peak, 672 nm).
Perfusion for a given sphere color, in ml/min/g, was calculated from the number of spheres in the tissue sample, the sample mass, the reference flow during withdrawal of aortic Mood, and the number of reference spheres in the sample of aortic blood:
The perfusion values were assigned to the centroid of each tissue sample.
Processing of MR Images
All images were analyzed with a semiautomated contour and tag detection algorithm (21) that defined positions approximately every millimeter around endocardial and epicardial contours and along the centers of the myocardial tag lines. Figure 5 shows short-axis tag and contour data from a basal image plane at nine time frames. A single tag is highlighted to show the evolution of deformation in the LV wall.
Figure 5.

Basal tag and contour data in the short axis. Both acquisitions at this level are shown, producing a grid appearance to the tags. The box identifies data from the first time frame, with sequential time frames shown from left to right. Motion and curvature of the initially straight tag lines can be seen as the heart contracts.
Once tag and contour positions were defined, 3D displacements and strains throughout the LV were determined using the displacement field-fitting method developed in this laboratory (14). Each time frame was reconstructed independently. At a given time frame, each of the three sets of tagged images contained 1D displacement information throughout the myocardium. Specifically, every point on a tag (in the deformed geometry of the heart) was defined by three spatial coordinates and was associated with a 1D displacement from the originally flat tag plane in the direction of the tag plane normal. All 1D displacement data from the three sets of images with orthogonal tag planes (≈2,400 points per time frame) were simultaneously fit using a least-squares method to a 3D displacement function. The function included 12 first-order Cartesian terms (describing bulk motion and spatially invariant shears and stretches) and a 150-term harmonic expansion in prolate spheroidal coordinates to fit local variations in displacement. The prolate spheroidal expansion contained first-order terms in the radial direction and fourth-order terms in the circumferential and longitudinal angles.
A regularly spaced array of material points was defined in the LV wall for the evaluation of displacement and strain. A material point is attached to, and moves with, the underlying myocardium. This array was defined at the end-diastolic geometry, with 3 points radially, 24 points circumferentially, and 11 longitudinally. The long axis of the heart was determined by the axis of the best-fit ellipsoid to the epicardial contour points of the first time frame and was directed from apex to the base. Next, for each material point, a local coordinate system was defined along the radial, circumferential, and longitudinal directions. Radial was defined as perpendicular to the epicardial surface and directed outward, after the material point was projected to the epicardium along the prolate radial direction. Circumferential was perpendicular to the radial direction and to the long axis and directed counterclockwise and viewed from base to apex. Finally, longitudinal was perpendicular to the radial and circumferential directions and directed to increase from apex to base.
The displacement field expression and its spatial derivatives were evaluated at these material points to produce the Lagrangian finite deformation gradient tensor, F, and a displacement vector. These were expressed in local coordinates. A polar decomposition of F was performed to remove the local bulk rotation and to obtain the right stretch tensor, U. Subtraction of the identity tensor, I, from U gave a linear strain tensor, defined here as S, which is independent of bulk motion and is entirely zero (zero tensor) when there is no strain. Its intuitive advantage, compared with the Lagrangian finite strain tensor, E = ½ (U2 − I), is that the normal components of S represent simply a fractional change in length along the direction of the subscripts: Srr = 0.4 means 40% radial thickening, whereas Err = 0.4 means (2 × 0.4 + l)1/2 −1 = 0.34, or 34% thickening (r, radial; c, circumferential; l, longitudinal).
Although local radial strain could be estimated directly from the radial component of the stretch tensor (Srr), this parameter was supported by the lowest density of tag data (two to three tags) and was limited to a constant value across the wall (by the first-order radial displacement function). The other components of U, however, were better defined because of the tag geometry and also permitted radial strain gradients to be measured. Thus, a parameter reflecting local 3D mechanical activity, called radial function (R), was calculated from all the circumferential, longitudinal, and shear components of U and from the assumption of tissue incompressibility in 3D. The constraint of incompressibility was enforced by setting the determinate of U to 1.0 and solving for the radial component:
Radial function represents the overall 3D contractile and shearing capacity at a point in the myocardium. In the case where the myocardium maintains a constant volume, R also represents the local change in length in the radial direction, a type of radial strain. Unlike traditional wall thickening, which is the separation between endocardial and epicardial surfaces, R is a function that varies across the wall.
A 2D index of myocardial contraction was defined as the geometric mean of fractional shortening circumferential and longitudinal directions, called the shortening index (SI).
Finally, traditional wall thickening was calculated from the relative change in separation of the paired endocardial and epicardial material points.
The information acquired with the MR tagging method was multifactorial. There were multiple dogs, multiple flow levels, three dimensions of space and time, six components of the 3D strain, and three components of displacement. To analyze this wealth of information, a few simplifying steps were performed. Analysis was focused on midwall strain because it was aligned with the microsphere tissue sample centroids and had the best support from the tag data. Use of parameters such as radial function and the SI served to summarize overall function in a single parameter. Thus, the remaining dimensions to the data were the circumferential and longitudinal position and time, for the flow levels of each heart.
The perfusion was also evaluated at each material point by linear interpolation of perfusion from four closest surrounding microsphere samples. Spatial registration between the microsphere and strain data was performed in the long-axis direction by scaling the separation between the valve plane and apical point of the tissue slabs (perfusion) to match that from the end-diastolic MR images (strain). Angular registration was performed for each tissue slab by superimposing the chamber centroids and aligning the right ventricle–LV junctions. For each heart at each low level, the microsphere perfusion data were normalized to the average value at 20 contiguous material points in the remote normal zone, opposite the center of LAD perfusion deficit This normalization corrected for scaling errors in the aortic withdrawal corrections (22).
To minimize the effects of misregistration between strain and perfusion, a zone within the central portion of the ischemic bed was defined for each study and used for analysis. Based on the perfusion data, 9–16 contiguous material points were taken from the portion of the LAD bed with the lowest perfusion, avoiding the boundary zone. The perfusion of these points was within 15% of the minimum perfusion in each ischemic flow level.
Finally, the global LV ejection fraction was estimated from the chamber volumes within the array of endocardial material points. Use of material point motions avoided the relatively large errors in estimating the position of the endocardial surface (23).
RESULTS
Complete strain/perfusion examinations were acquired in six dogs at a total of 14 levels of LAD flow. Table 1 shows the heart rate, peak LV pressure, perfusion at the center of the LAD zone, and ejection fraction for all studies. In each heart, the heart rate was fixed for all flow interventions by electronic pacing. Among hearts, these rates ranged from 94 to 146 bpm. Left ventricular peak pressure remained stable during imaging, varying by no more than 15 mm Hg from the initial value and typically by 5–10 mm Hg. With hypoperfusion, all hearts still maintained pressures over 80 mm Hg.
Table 1.
Physiologic Parameters for the Studies
| Dog | LAD Flow | HR | LVP | LAD Bed Perfusion | EF |
|---|---|---|---|---|---|
| Study 1 | Full* | 132 | 115–125 | — | 0.38 |
| Zero | 132 | 70–80 | 0.10 ± 0.02 | 0.23 | |
| Study 2 | Zero† | 126 | 80–100 | 0.24 ± 0.06 | 0.29 |
| Study 3 | Full | 100 | 80–100 | 0.80 ± 0.06 | 0.50 |
| Half | 100 | 90–100 | 0.38 ± 0.01 | 0.54 | |
| Quarter | 100 | 75–90 | 0.00 ± 0.04 | 0.49 | |
| Study 4 | Full | 94 | 150–175 | 1.01 ± 0.12 | 0.27 |
| Half | 94 | 160–180 | 0.35 ± 0.06 | 0.25 | |
| Quarter | 94 | 95–125 | 0.12 ± 0.02 | 0.38 | |
| Study 5 | Full | 126 | 85–110 | 1.09 ± 0.09 | 0.50 |
| Quarter | 126 | 75–100 | 0.25 ± 0.03 | 0.39 | |
| Eighth | 126 | 80–110 | 0.15 ± 0.04 | 0.46 | |
| Study 6 | Full | 146 | 95–105 | 1.01 ± 0.11 | 0.42 |
| Zero | 146 | 90–105 | 0.41 ± 0.07 | 0.31 | |
| Snare‡ | 146 | 85–100 | 0.07 ± 0.02 | 0.39 |
Full flow perfusion data excluded because of 1-min cannula occlusion, before the full-flow perfusion microsphere was injected.
Full flow not acquired due to cannulation failure.
An additional data set was acquired at the end of this study by occluding the LAD proximal to the first diagonal branch with a snare.
LAD Flow, blood flow rate in the left anterior descending coronary artery (LAD), relative to baseline; HR, heart rate in bpm, which was fixed by atrial pacing; LVP, range of peak left ventricular pressure in mm Hg; Perfusion, mean ± SD in ml/min/g for 9–16 material points within the central ischemic zone of the LAD bed; EF, ejection fraction estimated from endocardial material point motions.
Perfusion–Strain Relationship at End Systole
The ability of the tag-based strain method to predict perfusion is well seen when material points retain their spatial relationships. Figure 6 shows representative end-systolic 3D renderings of the LV anteroseptal wall (study 6) at normal LAD flow and both ischemic levels. The degree and spatial extent of the perfusion and radial function deficits are well matched.
Figure 6.

Perfusion and radial function in study 6. Each rendering shows the anteroseptal wall of the left ventricle at end systole, where the midseptum is marked by the dark sphere. The lop row shows perfusion normalized to the remote side the heart (A) and radial function (R) (B) during normal blood flow in the LAD. Perfusion (C) and R (D) are shown in the middle row but with zero blood flow distal to the first diagonal branch of the LAD. The bottom row also shows perfusion (E) and R (F) after LAD occlusion proximal to the first LAD diagonal branch.
Within single-dog studies, the relationship between radial function and perfusion can also be displayed in a scatter gram of material points. Figure 7 shows such data for each dog study, where all LAD flow states in a given heart are superimposed. There was a continuous spectrum of perfusion data even within a single flow state because samples were taken throughout the LV.
Figure 7.

Radial function versus remote-normalized perfusion. One plot is shown for each dog. Material points are shown from all flow levels of the LAD. Points with error bars show the mean and standard deviation of the data in bins spaced every 0.1 along the perfusion axis. The bold line is a linear fit to data with subnormal perfusion.
When perfusion was reduced below baseline, the radial function data were well fit by a linear relationship against normalized perfusion. For each dog, the slope of strain as a function of perfusion was calculated, as well as the zero-perfusion intercept. Table 2 shows the relationship found in each dog.
Table 2.
Radial Function–Perfusion Relationships for Individual Hearts
| Dog | Slope | Intercept | Correlation |
|---|---|---|---|
| Study 1 | 0.41 ± 0.02 | −0.17 ± 0.01 | 0.86 |
| Study 2 | 0.21 ± 0.02 | −0.13 ± 0.01 | 0.59 |
| Study 3 | 0.40 ± 0.02 | −0.04 ± 0.01 | 0.72 |
| Study 4 | 0.29 ± 0.01 | −0.08 ± 0.01 | 0.77 |
| Study 5 | 0.44 ± 0.02 | −0.13 ± 0.01 | 0.78 |
| Study 6 | 0.45 ± 0.02 | −0.10 ± 0.01 | 0.78 |
The slope and intercept define the linear fit for radial function (R) vs. perfusion (normalized to the remote zone) for perfusion values between 0.0 and 1.0. The intercept shows the value of R at zero perfusion. Standard errors are given.
Figure 8 shows mean midwall radial function and the SI plotted versus perfusion for the central portions of the ischemic zones in the studies. Analysis of the central ischemic zone improves the perfusion–strain correlation by focusing on a single region that reduces the effect of spatial heterogeneity and by avoiding the boundary zone where the effect of misregistration between perfusion and strain data is maximal. Connected points are from the same heart and represent different flow levels. The radial function, R, is shown. The error bars represent the standard deviation for 9–16 material points within the central 8–12 cm3 LAD region. One study (study 3) had mild perfusion and strain deficits at full flow due to occlusion of a small LAD branch by the cannula; this is seen by the point with perfusion of 0.80 and radial function of 0.19. There is an approximately linear relationship between end-systolic strain and perfusion, and there was a loss of function with only small (≤20%) decreases in perfusion. The radial function–perfusion relationship for the central ischemic zones of all hearts had a slope of 0.46 and a zero-perfusion strain intercept of −0.16. At a perfusion fraction of 0.35, the LAD zone had no radial function during systole. The strain-perfusion fitting parameters for radial, circumferential, and longitudinal stretch and the components of Lagrangian finite strain are shown in Table 3. The best correlation (r = 0.94) occurred with the radial function parameter, R.
Figure 8.

Perfusion versus strain indices in the central ischemic zones. Radial function (R) and the SI are plotted versus normalized perfusion in A and B, respectively. Strain and perfusion were determined for each flow level. Data from material points (9–16) at the center of the ischemic zone for each heart were averaged, and standard deviations are shown. Data from different flow levels in the same heart are connected, exclusion of a small LAD branch by the cannula occurred in study 3; the full flow data point from this study (fourth point from right in both plots) has mild perfusion and strain deficits. The bold dashed line is the best linear fit to the data.
Table 3.
Strain–Perfusion Relationships for Central Ischemic Zones
| Parameter | Slope | Strain Intercept | Perfusion Intercept | Correlation |
|---|---|---|---|---|
| R | 0.46 ± 0.05 | −0.156 ± 0.026 | 0.350 ± 0.036 | 0.94 |
| SI | −0.20 ± 0.02 | 0.087 ± 0.012 | 0.426 ± 0.037 | −0.93 |
| WT | 0.24 ± 0.06 | −0.038 ± 0.032 | 0.268 ± 0.077 | 0.77 |
| Srr | 0.26 ± 0.05 | −0.034 ± 0.027 | 0.215 ± 0.069 | 0.84 |
| Scc | −0.26 ± 0.04 | 0.104 ± 0.022 | 0.398 ± 0.048 | −0.89 |
| Sll | −0.14 ± 0.03 | 0.069 ± 0.015 | 0.475 ± 0.060 | −0.83 |
| Err | 0.28 ± 0.06 | −0.029 ± 0.031 | 0.206 ± 0.173 | 0.82 |
| Ecc | −0.24 ± 0.04 | 0.106 ± 0.024 | 0.440 ± 0.056 | −0.85 |
| Ell | −0.14 ± 0.03 | 0.077 ± 0.015 | 0.517 ± 0.064 | −0.82 |
| Erc | 0.10 ± 0.04 | 0.001 ± 0.023 | 0.289 ± 0.105 | 0.55 |
| Erl | 0.03 ± 0.06 | −0.027 ± 0.033 | 0.431 ± 0.106 | 0.13 |
| Ecl | 0.04 ± 0.03 | 0.021 ± 0.014 | 0.271 ± 0.140 | 0.40 |
The slope and strain intercept (strain at zero perfusion) define the linear fit of each strain component for perfusion (normalized to the remote zone) values between 0.0 and 1.0. Standard errors are given. Radial function (R) calculated using the tissue incompressibility assumption had the highest correlation with perfusion, followed closely by the shortening index (SI), and fractional circumferential shortening (Scc). Wall thickening (WT) correlated less strongly with perfusion. The perfusion intercepts indicate levels of perfusion at which strain became zero. S is the linear strain tensor, and E is the Lagrangian finite strain tensor. The tensor subscripts are r, radial; c, circumferential; and l, longitudinal; like subscripts indicate length changes. and differing indices represent shears.
As perfusion decreased, longitudinal contraction (Sll) was lost first at 48% perfusion, followed by the SI at 43% perfusion, circumferential contraction (Scc) at 40%, radial function (R) at 35%, wall thickening at 27%, and finally radial strain (Srr) at 22% perfusion.
Finally, because the strain parameter (R) with the best correlation to perfusion was calculated with the incompressibility constraint, this assumption was evaluated. The myocardial volume ratio at end systole compared with end diastole (determinate [U]) for the 1,320 midwall material points in the fully perfused hearts was 0.94 ± 0.10 (mean ± SD) and that for the 54 material points in the central ischemic zones of the hearts with no LAD flow was 1.04 ± 0.06. The average myocardial volume at these extremes of perfusion and strain changed by approximately 6% during systole, so 0.06 is the maximally expected deviation of R from the true radial strain introduced by the incompressibility assumption.
The volume ratio of the central LAD regions at full perfusion (0.94 ± 0.07) was significantly less than that at maximally reduced perfusion (1.02 ± 0.06) by a paired t-test (p < 0.005). This result was expected because one cause of systolic volume loss, the phasic difference between arterial inflow and venous outflow, is dependent on tissue perfusion. This significance level held when the material point density was halved in the circumferential and longitudinal directions (total N = 19) to match the approximate spatial resolution of the strain reconstruction method (24) so that the material points could be considered independent. It also held when mean values from each central LAD zone (N = 5) were used.
Temporal Patterns of Strain during Ischemia
The temporal patterns of strain were also examined in the context of perfusion level. Figure 9 shows the evolution of midwall radial function for the three flow levels of study 5. Ischemic myocardium exhibited decreased strain rates and often had negative radial function (paradoxical strain) in early systole, in contrast to normally perfused myocardium that had monotonically increasing radial function versus time and linearly increasing strain versus ejection fraction. Paradoxical transients of circumferential and longitudinal lengthening were also observed in these areas.
Figure 9.

Evolution of R throughout the LV of study 5. Radial function is plotted versus time in A and versus ejection fraction in B. Each box graph represents a midwall location in the LV. Basal data are at the top and apical are at the bottom. Circumferential position progresses from left to right: septal to anterior to lateral to inferior. Within each plot, the black curve is at full LAD flow, the curve with the gray end is at quarter flow, and the solid color curve is at eighth flow. Color encodes perfusion level, normalized to the remote zone, where blue is 0%, and red ≥. Plots versus ejection fraction serve to linearize strain evolution and to improve strain reproducibility in the normal (basal to lateral) region. With increasing ischemia, strain evolution exhibits decreased strain rate, transient paradoxical (negative values) values followed by recovery (e.g., apical to lateral region), and finally completely paradoxical strain with little or no partial recovery.
The duration of paradoxical transients was also evaluated. For the 400 material points that had thinning during systole (R ≤ 0), the normalized perfusion was 0.24 ± 0.21 (mean ± SD). When thinning of at least 100-ms duration was followed by recovery to baseline, the perfusion level was 57 ± 33% (N = 408). Seven points from the central LAD zone of study 3, which had mild ischemia at full low from cannula insertion, met these strain criteria for evidence of ischemia. When, the study 3 data were excluded, however, none of the remaining 792 material points at the full flow state exhibited thinning of 100-ms duration. If the thinning duration cutoff for evidence of ischemia were decreased from 100 ms, material points at full flow would begin to meet the criteria: 0.8% of full flow material points apparently thinned for at least 75 ms (first three time frames), 17% for 45 ms (first two time frames), and 40% for 26 ms (first time frame). The high percentage (40%) of material points in the first time frame to undergo apparent initial thinning was expected because the strains were nearly zero at 26 ms (0.00 ± 0.04). The 100-ms cutoff for contraction delay in the normal myocardium is probably conservative because uncertainty over the exact time of end diastole may have led to tagging before end diastole.
DISCUSSION
In the early studies of strain versus perfusion, we used a radial tagging pattern that was thought to fit the geometry of the heart optimally (2, 11,25–27). Other investigators have also used this technique (28,29). Significant results have come from these studies; however, the precision and accuracy of the strain estimates are limited by low material point density, low precision in endocardial contour estimation (23), and low time resolution of the images (18). Striped radial tagging methods (6,30) eliminated the need to detect heart contours but still had a low data density. The current 1D parallel tagging scheme-allows for a threefold increase in tag density compared with radial tagging, breathhold data acquisition, and deformation analysis that is independent from the estimation of the endocardial and epicardial contours. Furthermore, data from the entire length of intramyocardial tag lines are used, not just intersections with other tags or contours.
The images contained one set of parallel tag lines, requiring two short-axis sets. Alternatively, images can be tagged with grids (4) containing two sets of tags. To sample the Fourier spectrum of grid patterns, however, requires a greater number of phase-encoding steps, leading to longer breathholds and significant tag blurring in the phase-encoding direction (7, 18). In addition, parallel tags obscure less of the image, permitting simple tag and contour detection on the same image, closer tag spacing, and improved tag contrast farther into the heart cycle.
With the tag and image density used in these studies and the field-fitting strain reconstruction method, the spatial resolution of the strain data (based on the width at half maximum of the point spread function) was approximately 10 mm radially and 15 mm circumferentially and longitudinally (24).
Strain, being a spatial derivative of displacement, is sensitive to uncertainty in displacement data. The most precise strain parameters in this study were the ones supported by tie greatest density of tag data. Tag density was lowest for radial motion, where only two to three tags were present across the wall at the optimal tag spacing (16) of 6 mm used in these studies. This limited the radial displacement function to first order radially and to a constant radial displacement gradient. Strains involving the circumferential and longitudinal directions, in contrast, were best supported by tag data that were distributed continuously across the wall; hence, the use of these 3D strain components to recalculate radial function gave a more precise measure of radial stain. Even in regions where only two tags were present across the wall, radial gradients of strain across the wall were still well resolved with R. These results agree with those of Azhari et al. (29), who studied the ability to discriminate normal myocardium from that distal to an occluded coronary artery with various strain parameters.
To calculate R, tissue incompressibility was used. To the extent that there is a net myocardial blood volume loss during systole, the use of R as a measure of radial strain will be an overestimation. Data from cine radiography of implanted metal beads suggest systolic volume losses of 0–15% (31). Data from our study suggested systolic myocardial volume losses of 2.0–4.2%. The maximal compressibility due to phasic variations in myocardial blood flow, however, can be estimated to be only about 1% by dividing the typical perfusion value (1 ml/min/g tissue) by the typical heart rate (100 bpm) and assuming that all intravascular blood in each beat was ejected during systole. The excess systolic myocardial volume loss observed in these and other studies may be due to systolic ejection of intratrabecular blood that appeared to be part of the myocardium at end diastole.
Despite any error from the incompressibility assumption, however, the sensitivity of R to decreased perfusion is still valid. Furthermore, the smaller perfusion-related volume losses in the ischemic zone as compared with the remote zone increase the sensitivity of R to ischemia.
The SI had the second highest correlation with perfusion and required no tissue property assumptions. Being derived from the circumferential and longitudinal strains, SI also had the second highest supporting tag data density.
When the perfusion–strain relationship was analyzed for all data throughout a single heart, as in Fig. 7, several phenomena weakened the correlation. First, there is regional heterogeneity in the normal amount of strain throughout the heart. The variability of radial function in the normal regions was about 20%, with strains typically highest in the anterior and lateral walls. Perfusion heterogeneity, if different from that of the strain, would also contribute to a decreased correlation. Tethering (32–34) is a confounding factor in all strain–perfusion relationships, whereby the strain in a particular area is constrained by physical connection to neighboring regions or is altered by more global changes in ventricular geometry or pressure resulting from changes in more distal myocardium. Finally, any misregistration of the microsphere data to the strain field would reduce the apparent correlation. This misregistration effect would be greatest in the boundary zone that has the largest strain gradients and smallest in the center of the ischemic zone and the remote region. Evaluation of the perfusion–strain relationship of the central ischemic zones, as in Fig. 8, minimized the combined effects of misregistration, spatial heterogeneity, and tethering on the perfusion–strain correlation.
Even with these limitations, however, strain patterns from tagged MR imaging analysis were reliable predictors of extent and severity of acute ischemia. The ability to detect in vivo strain changes with 3D MR imaging analysis during hypoperfusion compares well with other sensitive but invasive methods, such as sonomicrometry (27,35). As in prior wall thickening studies by Gallagher et al. (36) and Stowe et al. (37), we find a linear relation between radial function and percent perfusion over the full range of ischemia from 0% to approximately 100% (Figs. 7 and 8). In a study by Weintraub et al. (32), a sigmoidal fit was used, but this function was essentially linear between 20% and 80% perfusion. Furthermore, the Weintraub data would have yielded a more linear fit had the hyperfunctional data above 50% perfusion and the paradoxical strain (thinning) data below 50% perfusion not been constrained to 1.0 and 0.0, respectively. A study by Vatner (35) found a good fit with an exponential function, but these thickening data were also linear below approximately 70% perfusion. The perfusion level at which zero radial function occurred in this study (35%) was similar to the perfusion levels at which wall thickening became zero in studies by Weintraub et al. (20%), Stowe et al. (≈40%), and Gallagher et al. (≈55%).
The issue of sensitivity of strain to decreased perfusion is important if tagging studies are to be used for clinical evaluation of local myocardial function. Although the clinical purpose of MR imaging-based 3D strain maps may not be to quantitate perfusion through a strain–perfusion relation, alterations in 3D strain will likely be helpful in detecting the onset of abnormal strain in the setting of ischemia. The essentially linear decrease in radial function and the SI when perfusion was decreased from baseline indicates that quantitatively measured strain abnormalities could be predictive of hypoperfusion, in addition to describing mechanical function.
The examinations carried out in this study were on anesthetized dogs in a near-resting state. It is well known, however, that cardiovascular stress increases the sensitivity of wall motion studies to ischemia (38–43). Modification of the MR imaging protocol to study the heart function during stress is the next extension and is currently being studied. In addition, the method can be further extended to evaluate the full heart cycle. This simply requires a second set of images whose tags were generated at end systole, reconstruction with continuity of material points, and multiplication of the strains. Even with the analysis limited to systolic strains and the minor stress of pacing at 10 bpm above the natural heart rate, the method proved sensitive to small decreases in perfusion from baseline.
Measurement of systolic strain evolution at a 35-ms time resolution permitted evaluation of strain transients and strain rate. Nonlinearities in strain evolution, such as initial dyskinesis, delayed contraction, and strain recovery at end systole, were all detectable with this 3D strain analysis technique. Although normal myocardium showed monotonically increasing strain during systole and linearly increasing strain when plotted versus ejection fraction, ischemic tissue was characterized as nonlinear strain evolution. We also observed this pattern in human hearts (44). Because of poor early function and late systolic recovery patterns in mildly ischemic myocardium, high temporal resolution of strain data may improve sensitivity to ischemia compared to end-systolic measurements alone.
CONCLUSION
We used a noninvasive MR technique to measure the patterns of 3D strain evolution as a function of local perfusion in a canine model of acute coronary artery stenosis and evaluated several novel strain indices and conventional strain tensor components. The changes in 3D strain patterns were well correlated with the degree and extent of local ischemia.
The radial function parameter (R), which was calculated from the longitudinal, circumferential, and shear strains and the incompressibility constraint, is useful as a single index of 3D mechanical function. It was more robust to tag uncertainty and had a higher correlation with perfusion than any of the six MR imaging-derived 3D strain tensor components. Because it is also based on the assumption of tissue incompressibility, ischemia would also lead directly to a fall in R, as the volume of perfusing blood available to leave the heart wall during systole decreases. The SI had the second highest correlation with perfusion followed by circumferential shortening. The directly calculated radial components (Srr and Err) had the lowest correlation of the nonshear strains.
The relationship between end-systolic radial function and perfusion (normalized to the remote zone) was well fit with a linear function with a correlation coefficient of 0.94 when perfusion was subnormal: R = −0.16 + 0.46 × (fractional perfusion). The second highest correlation (r = –0.93) occurred for SI: SI = 0.09 − 0.20 × (fractional perfusion). The linear nature of these relations and the decrease in mechanical function with small drops in perfusion indicate that tag-based 3D strain measures are sensitive to decreases in perfusion. As perfusion dropped, longitudinal contraction was completely lost first (48% perfusion), followed by SI (43%), circumferential contraction (40%), radial function (35%), wall thickening (27%), and finally radial strain (21%). When perfusion fell below the level at which strain became zero, there was increasingly severe paradoxical strain. The finding of transient dysfunction of 100 ms or more followed by recovery in late systole was a highly specific indicator of ischemia.
The noninvasive and non-ionizing nature of this MR imaging-based technique and its unique ability to evaluate 3D strain and perfusion-sensitive parameters such as R and SI throughout the entire LV strengthen its clinical potential for the evaluation of cardiac mechanics in ischemic heart disease.
Acknowledgments
We gratefully acknowledge Ergin Atalar, PhD, for his work on the tagged MR imaging pulse sequence; Carlos Lugo-Olivieri, MD, and Alexandre Mebazaa, MD, for maintaining anesthesia and stability of the canine preparations; Joshua Tsitlik, PhD, and Howard I.evin, MD, for initial development of the pacing and monitoring system; Barry Rayburn, MD, for assistance with the colored microsphere protocol; Michael Guttman, MS, for providing the image segmentation software; Walter O'Dell, PhD, for codeveloping the strain reconstruction software; and William Hunter, PhD, for assistance with data analysis. Supported by the National Institutes of Health grants HL45090 and HL45683. C.C. Moore was supported in part by a fellowship from the Merck Sharp & Dohme Corporation.
References
- 1.American Heart Association. 1999 Heart and Stroke Statistical Update. Dallas, TX: American Heart Association; 1995. [Google Scholar]
- 2.Zerhouni EA, Parish DM, Rogers WJ, Yang A, Shapiro EP. Human heart: Tagging with MR imaging a method for noninvasive assessment of myocardial motion. Radiology. 1988;169:59–63. doi: 10.1148/radiology.169.1.3420283. [DOI] [PubMed] [Google Scholar]
- 3.Axel L, Dougherty L. MR imaging of motion with spatial modulation of magnetization. Radiology. 1989;171:841–849. doi: 10.1148/radiology.171.3.2717762. [DOI] [PubMed] [Google Scholar]
- 4.Axel L, Dougherty L. Heart wall motion: Improved method of spatial modulation of magnetization for MR imaging. Radiology. 1989;172:349–350. doi: 10.1148/radiology.172.2.2748813. [DOI] [PubMed] [Google Scholar]
- 5.Mosher TJ, Smith MB. A DANTE tagging sequence for the evaluation of translational sample motion. Magn Reson Med. 1990;15:334–339. doi: 10.1002/mrm.1910150215. [DOI] [PubMed] [Google Scholar]
- 6.Bolster BD, McVeigh ER, Zerhouni EA. Myocardial tagging in polar coordinates with striped tags. Radiology. 1990;177:769–772. doi: 10.1148/radiology.177.3.2243987. [DOI] [PMC free article] [PubMed] [Google Scholar]
- 7.McVeigh ER, Atalar E. Cardiac tagging with breath hold CINE MRI. Magn Reson Med. 1992;28:318–327. doi: 10.1002/mrm.1910280214. [DOI] [PMC free article] [PubMed] [Google Scholar]
- 8.Pipe JG, Boes JL, Chenevert TL. Method for measuring three-dimensional motion with tagged MR imaging. Radiology. 1991;181:591–595. doi: 10.1148/radiology.181.2.1924810. [DOI] [PubMed] [Google Scholar]
- 9.Young AA, Axel L, Dougherty L, Parenteau CS. Validation of tagging with MR imaging to estimate material deformation. Radiology. 1993;188:101–108. doi: 10.1148/radiology.188.1.8511281. [DOI] [PubMed] [Google Scholar]
- 10.Moore CC, Reader SB, McVeigh ER. Tagged MR imaging in a deforming phantom: Photographic validation. Radiology. 1994;190:765–769. doi: 10.1148/radiology.190.3.8115625. [DOI] [PMC free article] [PubMed] [Google Scholar]
- 11.Moore CC, O'Dell WG, McVeigh ER, Zerhouni EA. Calculation of three-dimensional left ventricular strains from biplanar tagged MR images. J Magn Reson Imag. 1992;2:156–175. doi: 10.1002/jmri.1880020209. [DOI] [PMC free article] [PubMed] [Google Scholar]
- 12.Young AA, Axel L. Three-dimensional motion and deformation of the heart wall: Estimation with spatial modulation of magnetization-a model-based approach. Radiology. 1992;185:241–247. doi: 10.1148/radiology.185.1.1523316. [DOI] [PubMed] [Google Scholar]
- 13.Denney TS, Jr, Prince JL, McVeigh ER, Lopez MJ. Optimal tag pattern validation using magnetic resonance imaging. Book of Abstracts; Proceedings of the First IEEE International Conference on Image Processing; Austin, TX. November 13–16; 1994. [Google Scholar]
- 14.O'Dell WG, Moore CC, Hunter WC, Zerhouni EA, McVeigh ER. Three-dimensional myocardial deformations: Calculation with displacement field fitting to tagged MR images. Radiology. 1995;195:829–835. doi: 10.1148/radiology.195.3.7754016. [DOI] [PMC free article] [PubMed] [Google Scholar]
- 15.Tsitlik JE, Levin HR, Herskowitz A, McVeigh ER, Moore CC, Halperin HR. Magnetic resonance imaging-induced myocardial pacing injury can be prevented during cardiac pacing. PACE, NASPE Abstracts. 1995 April;18(Part II) [Google Scholar]
- 16.Atalar E, McVeigh ER. Optimum tag thickness for the measurement of motion with MRI. IEEE Trans Med Imag. 1994;13:152–160. doi: 10.1109/42.276154. [DOI] [PMC free article] [PubMed] [Google Scholar]
- 17.McVeigh ER, Gao L. Precision of tag position estimation in breath-hold CINE MRI: The effect of tag spacing. Book of Abstracts; Proceedings of the Society of Magnetic Resonance in Medicine, 12th Annual Scientific Meeting; August 1993.p. 199. [Google Scholar]
- 18.McVeigh ER. MRI of myocardial function: Motion tracking techniques. Magn Reson Imag. 1996;14:137–150. doi: 10.1016/0730-725x(95)02009-i. [DOI] [PubMed] [Google Scholar]
- 19.Hale SL, Alker KJ, Kloner RA. Evaluation of nonradioactive, colored microspheres for the measurement of regional myocardial blood flow in dogs. Circulation. 1988;78:428–434. doi: 10.1161/01.cir.78.2.428. [DOI] [PubMed] [Google Scholar]
- 20.Kowallik P, Schulz R, Guth BD, Schade A, Paffhausen W, Gross R, Heusch G. Measurement of regional myocardial blood flow with multiple colored microspheres. Circulation. 1991;83:974–982. doi: 10.1161/01.cir.83.3.974. [DOI] [PubMed] [Google Scholar]
- 21.Guttman MA, Prince JL, McVeigh ER. Tag and contour detection in tagged MR images of the left ventricle. IEEE Trans Med Imag. 1994;13:74–88. doi: 10.1109/42.276146. [DOI] [PubMed] [Google Scholar]
- 22.Canty JM, Giglia J, Kandath D. Effect of tachycardia on regional function and transmural myocardial perfusion during graded coronary pressure reduction in conscious dogs. Circulation. 1990;82:1815–1825. doi: 10.1161/01.cir.82.5.1815. [DOI] [PubMed] [Google Scholar]
- 23.Bazille A, Guttman MA, McVeigh ER, Zerhouni EA. Impact of semi-automated versus manual image segmentation errors on myocardial strain calculation by MR tagging. Invest Radiol. 1994;294:427–433. doi: 10.1097/00004424-199404000-00008. [DOI] [PMC free article] [PubMed] [Google Scholar]
- 24.O'Dell WG, Moore CC, Zerhouni EA, McVeigh ER. Spatial resolution of 3D cardiac tagging reconstruction: Impulse response analysis for displacement field-fitting. Book of Abstracts; Proceedings of the Society of Magnetic Resonance and the European Society for Magnetic Resonance in Medicine and Biology; Nice, France. 1995. p. 1417. [Google Scholar]
- 25.McVeigh ER, Zerhouni EA. A rapid starburst sequence for cardiac tagging. Book of Abstracts; Eighth Annual Meeting of the Society of Magnetic Resonance in Medicine; 1989. p. 23. [Google Scholar]
- 26.Moore CC, O'Dell WG, McVeigh ER, Zerhouni EA. Society of Magnetic Resonance in Medicine, Book of Abstracts. Vol. 1. 1991. Three-dimensional myocardial strains in humans using bi-planar tagged MRI; p. 14. [Google Scholar]
- 27.Lima JA, Jeremy R, Guier W, Bouton S, Zerhouni EA, McVeigh ER, Buchalter MB, Weisfeldt ML, Shapiro EP, Weiss JL. Accurate systolic wall thickening by nuclear magnetic resonance imaging with tissue tagging: Correlation with sonomicrometers in normal and ischemic myocardium. J Am Coll Cardiol. 1993;21:1741–1751. doi: 10.1016/0735-1097(93)90397-j. [DOI] [PubMed] [Google Scholar]
- 28.Azhari H, Weiss JL, Rogers WJ, Siu CO, Zerhouni EA, Shapiro EP. Noninvasive quantification of principal strains in normal canine hearts using tagged MRI images in 3-d. Am J Physiol. 1993;264:H205–H216. doi: 10.1152/ajpheart.1993.264.1.H205. [DOI] [PubMed] [Google Scholar]
- 29.Azhari H, Weiss JL, Rogers WJ, Siu CO, Shapiro EP. A noninvasive comparative study of myocardial strains in ischemic canine hearts using tagged MRI in 3-D. Am J Physiol. 1995;268:H1918–H1926. doi: 10.1152/ajpheart.1995.268.5.H1918. [DOI] [PubMed] [Google Scholar]
- 30.Moore CC, McVeigh ER, Mebazaa A, Zerhouni EA. Use of striped radial tagging to measure three-dimensional endocardial and epicardial deformation throughout the canine left ventricle during ischemia. Book of Abstracts; Proceedings of the Society of Magnetic Resonance Imaging; 1993. p. 124. [Google Scholar]
- 31.Waldman LK, Fung YC, Covell JW. Transmural myocardial deformation in the canine left ventricle. Circ Res. 1985;57:152–163. doi: 10.1161/01.res.57.1.152. [DOI] [PubMed] [Google Scholar]
- 32.Weintraub WS, Hattori S, Agarwal JB, Bodenheimer MM, Banka VS, Helfant RH. The relationship between myocardial blood flow and contraction by myocardial layer in the canine left ventricle during ischemia. Circ Res. 1981;48:430–438. doi: 10.1161/01.res.48.3.430. [DOI] [PubMed] [Google Scholar]
- 33.Gallagher KP, Osakada G, Hess OM, Koziol JA, Kemper WS, Ross J., Jr Subepicardial segmental function during coronary stenosis and the role of myocardial fiber orientation. Circ Res. 1982;50:352–359. doi: 10.1161/01.res.50.3.352. [DOI] [PubMed] [Google Scholar]
- 34.Gallagher KP, Matsuzaki M, Koziol JA, Kemper WS, Ross J., Jr Regional myocardial perfusion and wall thickening during ischemia in conscious dogs. Am J Physiol. 1984;247:H727–H738. doi: 10.1152/ajpheart.1984.247.5.H727. [DOI] [PubMed] [Google Scholar]
- 35.Vatner SF. Correlation between acute reductions in myocardial blood flow and function in conscious dogs. Circ Res. 1980;47:201–207. doi: 10.1161/01.res.47.2.201. [DOI] [PubMed] [Google Scholar]
- 36.Gallagher KP, Kumada T, Koziol JA, McKown MD, Kemper WS, Ross J., Jr Significance of regional wall thickening abnormalities relative to transmural myocardial perfusion in anesthetized dogs. Circulation. 1980;60:1266–1274. doi: 10.1161/01.cir.62.6.1266. [DOI] [PubMed] [Google Scholar]
- 37.Stowe DF, Mathey DG, Moores WY, Glantz SA, Town-send RM, Kabra P, Chatterjee K, Parmley WW, Tyberg JV. Segmental stroke work and metabolism depend on coronary blood flow in the pig. Am J Physiol. 1978;234:H597. doi: 10.1152/ajpheart.1978.234.5.H597. [DOI] [PubMed] [Google Scholar]
- 38.Previtali M, Lanzarini L, Ferrario M, Tortorici M, Mussini A, Montemartini C. Dobutamine versus dipyridamole echocardiography in coronary artery disease. Circulation. 1991;83 5:27–31. [PubMed] [Google Scholar]
- 39.Sawada SG, Segar DS, Ryan T, Brown SE, Dohan AM, Williams R, Fineberg NS, Armstrong WF, Feigenbaum H. Echocardiographic detection of coronary artery disease during dobutamine infusion. Circulation. 1991;83:1605–1614. doi: 10.1161/01.cir.83.5.1605. [DOI] [PubMed] [Google Scholar]
- 40.Picano E. Stress echocardiography from pathophysiological toy to diagnostic tool. Circulation. 1992;85:1604–1612. doi: 10.1161/01.cir.85.4.1604. [DOI] [PubMed] [Google Scholar]
- 41.Marwick T, D'Hondt AM, Baudhuin T, Willemart B, Wijns W, Detry JM, Melin J. Optimal use of dobutamine stress for the detection and evaluation of coronary artery disease: Combination with echocardiography or scintigraphy, or both? J Am Coll Cardiol. 1993;22:159–167. doi: 10.1016/0735-1097(93)90830-t. [DOI] [PubMed] [Google Scholar]
- 42.Marwick T, Willemart B, D'Hondt AM, Baudhuin T, Wijns W, Detry JM, Melin J. Selection of the optimal nonexercise stress for the evaluation of ischemic regional myocardial dysfunction and malperfusion. Comparison of dobutamine and adensoine using echocardiography and 99mtc-MIBI single photon emission computed tomography. Circulation. 1993;87:345–354. doi: 10.1161/01.cir.87.2.345. [DOI] [PubMed] [Google Scholar]
- 43.Cigarroa CG, deFilippi CR, Brickner ME, Alvarez LG, Wait MA, Grayburn PA. Dobutamine stress echocardiography identifies hibernating myocardium and predicts recovery of left ventricular function after coronary revascularization. Circulation. 1993;88:430–436. doi: 10.1161/01.cir.88.2.430. [DOI] [PubMed] [Google Scholar]
- 44.Lugo-Olivieri CH, Moore CC, Poon EGC, Lima JAC, McVeigh ER, Zerhouni EA. Temporal evolution of three dimensional deformation in the ischemic human left ventricle: Assessment by MR tagging. Book of Abstracts; Proceedings of the Society of Magnetic Resonance; 1994. p. 1482. [Google Scholar]