

Abstract
Post mortem human brain tissue is used for the study of many different brain diseases. A key factor in conducting postmortem research is the quality of the tissue. Unlike animal tissue, whose condition at death can be controlled and influenced, human tissue can only be collected naturalistically. This introduces potential confounds, based both on pre- and postmortem conditions, that may influence the quality of tissue and its ability to yield accurate results. The traditionally recognized confounds that reduce tissue quality are agonal factors (e.g., coma, hypoxia, hyperpyrexia at the time of death), and long postmortem interval (PMI). We measured tissue quality parameters in over 100 postmortem cases collected from different sources and correlated them with RNA quality (as indicated by the RNA Integrity Number (RIN)) and with protein quality (as measured by the level of representative proteins). Our results show that the most sensible indicator of tissue quality is RIN and that there is a good correlation between RIN and the pH. No correlation developed between protein levels and the aforementioned factors. Moreover, even when RNA was degraded, the protein levels remained stable. However, these correlations did not prove true under all circumstances (e.g. thawed tissue, surgical tissue), that yielded unexpected quality indicators. These data also suggest that cases whose source was a Medical Examiner’s office represent high tissue quality.
Keywords: brain, RIN, PMI, pH
Introduction
Increasingly, human postmortem brain tissue is being used to quantify cellular and molecular markers of neural processes in the pursuit of understanding normal brain function and correlates of dysfunction in CNS illnesses (Casanova and Kleinman, 1990; Castensson et al., 2000; Harrison et al., 1994; Mirnics et al., 2001; Ravid et al., 1992; Torrey et al., 2000). Because of the inaccessibility of the human brain and its unavailability for biopsy, fresh tissue is rarely obtainable. Consequently, the translation of new findings from basic laboratory studies to human brain diseases relies heavily on the use of postmortem tissue. Although studies using human tissue have been done for decades (Johnson et al., 1986; Wester et al., 1985), the sensitivity and specificity required for today’s molecular measures are greater, therefore calling for better tissue characteristics. This requires not only collecting better tissue than before, but also identifying measures of tissue quality and setting quality thresholds.
With this press for “high quality” tissue comes the need to determine the critical markers of quality for human postmortem tissue (Deep-Soboslay et al., 2005; Hargrove and Schmidt, 1989). Several laboratories have approached the evaluation of human postmortem brain cases with suggestions for markers of tissue quality (Lee et al., 2005; Preece and Cairns, 2003; Tomita et al., 2004). We have taken several of these newer measures of tissue quality and tested them in human postmortem tissue in a variety of situations to detect the relationship of the markers to the real quality of the postmortem tissue. Traditionally, a low postmortem interval (Barton et al., 1993; Ferrer-Alcon et al., 2003; Harrison et al., 1995; Lewis, 2002; Trotter et al., 2002) has been the hallmark of high tissue quality. More recently tissue pH (Hynd et al., 2003; Kingsbury et al., 1995; Li et al., 2004) has been used, and even more recently, specific markers of RNA quality have been introduced (Imbeaud et al., 2005; Johnston et al., 1997; Miller et al., 2004). In a cohort of human postmortem cases, we have determined these standard tissue quality measures, checked their collection correlates, and tested them for an association with RNA quality and with quantification of representative proteins. We have attempted to identify which are the most sensitive and reliable markers of tissue quality in human postmortem cases.
Materials and Methods
Collecting Cases and Processing Tissue
We analyzed postmortem human brain tissue collected at two sites, Dallas, TX and Baltimore, MD. Both tissue collections receive tissue from the local Medical Examiner’s (ME) office; in addition, the Dallas collection also receives tissue from the Willed Body Program (WB) of the University of Texas Southwestern Medical Center and from its Transplant Service Center (TSC). Whole human brains are collected from recently deceased persons with psychiatric diagnoses and matched controls (persons with no psychiatric diagnosis and no evidence of a psychiatric diagnosis in first degree family members). For every case, we obtained next-of-kin (NOK) permission to collect the tissue for research; we gathered medical records from all relevant institutions and conducted a direct informant interview for each case with at least one family member or primary care person. At least 2 research psychiatrists reviewed each case and made an independent diagnosis based on all available clinical information and then developed a consensus diagnosis for each case (Deep-Soboslay et al., 2005). The collection of tissue in Dallas was approved by the UTSW Institutional Review Board; in Baltimore, collection of tissue was approved by the University Of Maryland School Of Medicine Institutional Review Board.
Tissue is collected at autopsy from cases with NOK permission for research donation. At the sites of collection, cases are kept cold (4 degree C) between death and autopsy for variable periods of time. At autopsy, the brain is removed in the usual fashion and put on ice as soon as possible, after which it is transported to the laboratory and dissected immediately using a customized dissection. The cerebellar hemispheres are removed and sliced and frozen. Collection and tissue management at each site is similar, varying in small details, except for the origin of cases.
An emphasis at all sites has always been placed on collecting high quality tissue; therefore, “low quality” cases for comparison are sparse. Characteristics of quality classically used for brain collections include the following: cases with a relatively young age (approx 20--50 years old), unexpected death, as few treatment years as possible, no co-morbid drug abuse (except alcohol and nicotine), low postmortem interval (<24 hours with an average of 10–14 hours), and high quality clinical diagnoses and clear treatment history.
Inclusion criteria for Dallas and Baltimore collection sites are: 1) any psychiatric diagnosis; 2) any cases in which psychiatric medication was used for Axis 1 diagnoses; 3) suicide, 4) all ages, genders, races; 5) any normal case with demographic and PMI characteristics matching a psychiatric case; 6) available NOK and NOK permission for collection. Exclusion criteria are: 1) traumatic injury to the head; 2) forensic or medical issues involving the brain; 3) > 24 hour PMI collected on a case-by-case basis; 4) documented history of an infectious disease.
A gross neuropathological exam was completed on each brain consisting of a macroscopic examination. A broad toxicological screen was done by the ME office for all of the common drugs of abuse and the common therapeutic drugs; these included approximately 500 medications and covers the common antipsychotic, antidepressant, mood stabilizers, and antiepileptic drugs.
For the tissue quality measurements we used cerebellar tissue, except where noted for regional comparison; the samples were obtained by punching the cerebellum slices with a 4 mm diameter dermal biopsy punch (Miltex, Inc.)
The surgical brain samples were obtained from the temporal neocortex of four patients who underwent anterior temporal lobectomy for medically intractable temporal lobe epilepsy at the Parkland Memorial Hospital. All four patients had MRI and pathologic evidence of mesial temporal sclerosis involving the hippocampus. The temporal neocortex was radiologically and histologically normal. Informed consent for research was obtained from the patients. The study was approved by the UTSW Institutional Review Board. The samples were dissected from the neocortex of the surgically resected specimen, carefully avoiding leptomeninges and white matter. Immediately, adjacent samples were submitted for routine histology. Microscopic examination of the adjacent samples verified that the samples contained only neocortex. The samples were placed in 1.5 ml microfuge tubes, frozen rapidly in a metal block at −80 C within 20 minutes of the time the samples were removed from the patient, stored at −80 C for 6–11 months, and used for total RNA isolation.
Agonal Factor Score (AFS)
Because it is recognized that the manner of death (sudden versus prolonged death) impacts the quality of the tissue (Harrison et al., 1991), methods to record this have been developed. Tomita et al developed the Agonal Factor Score (AFS) to quantify the manner of death (Tomita et al., 2004). To calculate the AFS, several factors were rated: prolonged death (PD), coma, pyrexia, hypoxia, multiple organ failure (MOF), head injury (HI), neurotoxic substance ingestion. Each of these factors is scored with 1 (if present) or 0 (if absent). The overall AFS is calculated by summing all the individual scores.
pH Determination
Approximately 150 mg of frozen cerebellar tissue was homogenized in 1.5 ml of double deionized water (pH adjusted to 7.00), centrifuged for 3 minutes at 8000 g at 4 degree C. Tissue from other brain areas was used, where indicated. The pH of the supernatant was measured with a pH meter (Thermo – Electron Corporation) previously calibrated with 3 standards (pH = 4.00; pH = 7.00; pH = 10.00). For each sample, the determinations were made in duplicate.
RNA Analysis
Total RNA was isolated using Trizol (Invitrogen), according to the manufacturer’s instructions. RNA purity was assessed using the A260/A280 ratio (A260 = absorbance at 260 nm; A280 = absorbance at 280 nm).
RNA integrity was analyzed first by 1.5% agarose gel electrophoresis. As a further step, the samples were run on an Agilent 2100 Bioanalyzer, which also automatically calculates the sample concentration, the 28S/18S ribosomal ratio, and the RNA Integrity Number (RIN).
Protein Analysis
Approximately 75 mg of frozen cerebellar tissue was homogenized with a Polytron homogenizer in 1.5 ml lysis buffer (0.05 M Tris, 10 mM EDTA, 0.5% Tween-20, 2μg/ml aprotinin, leupeptin and pepstatin, and 100μg/ml phenylmethane sulphonyl fluoride (PMSF)) and centrifuged for 15 minutes at 1000g at 4 degree Celsius. The protein concentration of the supernatant was determined using a BCA assay (Pierce). 30 micrograms of protein was mixed with 5X loading buffer (250 mM Tris HCl (pH 6.8), 10% SDS, 10%l Glycerol, 100 mM DTT and 0.2% bromphenol blue), resolved on a 12% SDS-PAGE gel, transferred to PVDF membrane (120 V, for 1.5 hours at 4 degree C), blocked in 5% milk in TBST (50 mM Tris, pH 7.4, 150 mM NaCl, 0.1% Tween-20), and incubated in primary antibody: synaptotagmin (St) (1:1500), Rab3A (R) (1:3000), Syntaxin1 (St) (1:4000), Munc18 (M) (1:1000), VCP (valosine containing protein) (1:2000) and GAPDH (G). The primary antibodies used in this study were a gift from Thomas Sudhof (UTSW), except for primary antibodies against GAPDH, where they were purchased from Santa Cruz Biotechnology. After washing with TBST, membranes were incubated in secondary antibody 125I (1:2000) and detected using a Storm phosphor imager. Valosin containing protein (VCP) was used as a loading control. All the protein levels were normalized to VCP.
Statistic Methods
All cases were first divided into 5 diagnostic groups: normal controls (NL), schizophrenia (SZ), bipolar disorder (BD), depression/suicide (D/S), and other diagnoses (O). The difference among the quality parameters was examined using one-way ANOVA followed by post hoc tests when indicated.
Secondly, all collection cases were divided by the 4 tissue sources: Dallas County Medical Examiner’s Office (DME), Baltimore Medical Examiner’s Office (BME), Transplant Service Center (TSC), and Willed Body Program (WB). The same parameters as above were compared between groups in a similar fashion.
Results
1. Postmortem Tissue Characteristics by Diagnosis and Tissue Source
We analyzed tissue samples taken from 114 individuals aged 15 years to 90 years, with the mean age of 45.3 * 17.9 years. The tissue came from two locations (Dallas, Texas and Baltimore, Maryland) and from three sources: Medical Examiner’s Office (ME), Transplant Service Center (TSC) and Willed Body Program (WB). Neither Dallas nor Baltimore collections contained low quality tissue because of strict preexisting inclusion criteria.
The demographic characteristics of the cases and parameters used to assess case tissue quality are detailed by psychiatric diagnosis in Table 1. The average age range for each diagnostic group is: 16 – 77 years for normal controls (NL), 22 – 81 years for schizophrenia (SZ), 16 – 68 years for bipolar disorder (BD), 15 – 90 years for depression/suicide (D/S), and 17 – 57 for other diagnoses (O). This range covers the active illness years for most of the diagnoses. Tissue quality measures are generally high with relatively low PMIs (<24 hours), few agonal events at death (AFS = 0 or AFS = 1), good pHs (<6.4) and RINs (>7). ANOVA showed no difference among groups in terms of age (F(4, 109)=1.77, p=0.14)), PMI (F(4, 108)=0.94, p=0.44)), pH (F(4, 102)=0.28, p=0.89)), or RIN (F(4, 101)=1.01, p=0.40)).
Table 1.
Demographic and quality characteristics grouped by diagnosis
| Diagnosis | No. of cases | Age | Gender | Race | PMI | AFS | pH | RIN | |||||
|---|---|---|---|---|---|---|---|---|---|---|---|---|---|
| M | F | C | AA | O | 0 | 1 | >1 | ||||||
| NL | 36 | 49.9*16.0 | 27 | 9 | 29 | 6 | 1 | 16.1*6.8 | 27 | 7 | 1 | 6.6*0.3 | 7.1*2.3 |
| SZ | 38 | 46.9*17.5 | 25 | 13 | 18 | 18 | 2 | 17.6*9.4 | 22 | 6 | 2 | 6.6*0.3 | 7.5*2.0 |
| BD | 11 | 40.1*17.2 | 7 | 4 | 11 | 0 | 0 | 20.4*8.3 | 8 | 3 | 0 | 6.6*0.3 | 7.0*2.4 |
| D/S | 23 | 40.3*20.4 | 16 | 7 | 23 | 0 | 0 | 18.9*6.0 | 16 | 5 | 2 | 6.7*0.2 | 8.1*1.2 |
| O | 6 | 36.7*17.6 | 4 | 2 | 4 | 1 | 1 | 19.4*6.4 | 5 | 1 | 0 | 6.7*0.4 | 7.0*3.3 |
To address the question of which tissue source provides high quality tissue, we contrasted the characteristics of tissue from ME, TSC and WB (Table 2). ANOVA indicated that there were age differences among locations (F(3, 110) = 7.02, p=0.0002)). The tissue from WB program had a significantly higher mean age as compared to DME (p< 0.001), BME (p = 0.002) and TSC (p= 0.0023). While it appeared that the WB tissue had a lower mean RIN value (RIN = 5.9 * 2.9) than the other tissue sources (RIN = 7.5 * 2.1 for DME; RIN = 7.5 * 1.7 for BME; RIN = 7.9 * 2.1 for TSC), the difference was not significant. Tissue quality measures from cases collected at both ME offices and TSC matched and were similarly good, with no differences in PMI (F(3, 109)=1.03, p=0.38)), pH (F(3, 108)=1.26, p=0.29)), or RIN (F(3, 102)=1.94, p=0.13)).
Table 2.
Demographic and quality characteristics grouped by the source of the tissue
| Tissue source | No of cases | Age | Gender | Race | PMI | AFS | pH | RIN | |||||
|---|---|---|---|---|---|---|---|---|---|---|---|---|---|
| M | F | C | AA | O | 0 | 1 | >1 | ||||||
| DME | 43 | 40.5*17.5 | 28 | 15 | 37 | 5 | 1 | 18.1*6.3 | 26 | 15 | 2 | 6.7*0.3 | 7.5*2.1 |
| BME | 44 | 44.6*14.5 | 24 | 10 | 21 | 13 | 0 | 16.7*7.8 | 43 | 1 | 0 | 6.7*0.3 | 7.5*1.7 |
| TSC | 18 | 47.1*19.2 | 12 | 6 | 15 | 2 | 1 | 17.4*6.8 | 13 | 2 | 3 | 6.6 *0.3 | 7.9*2.1 |
| WB | 9 | 68.2*16.7 | 5 | 4 | 8 | 0 | 1 | 21.6*13.6 | 5 | 4 | 0 | 6.5*0.5 | 5.9*2.9 |
2. Measured Parameters
2a. pH
i. pH comparisons
pH is one of the most widely used tissue quality measurements. We assessed pH levels in the whole collection and contrasted them by diagnosis and by the tissue source. The average pH is not significantly different across any of the diagnostic groups (Fig. 1) or the collection sites (Fig. 2). Although the average pH appears lower for the brains collected from WB program, it is not significantly lower.
Fig. 1.

Scatterplot diagram of the pH distribution of all cases grouped by diagnosis. Within every diagnostic group, the cases with low RIN (RIN<7) are plotted in open diamonds and the cases with high RIN (RIN>7) are plotted in filled diamonds.
Fig. 2.
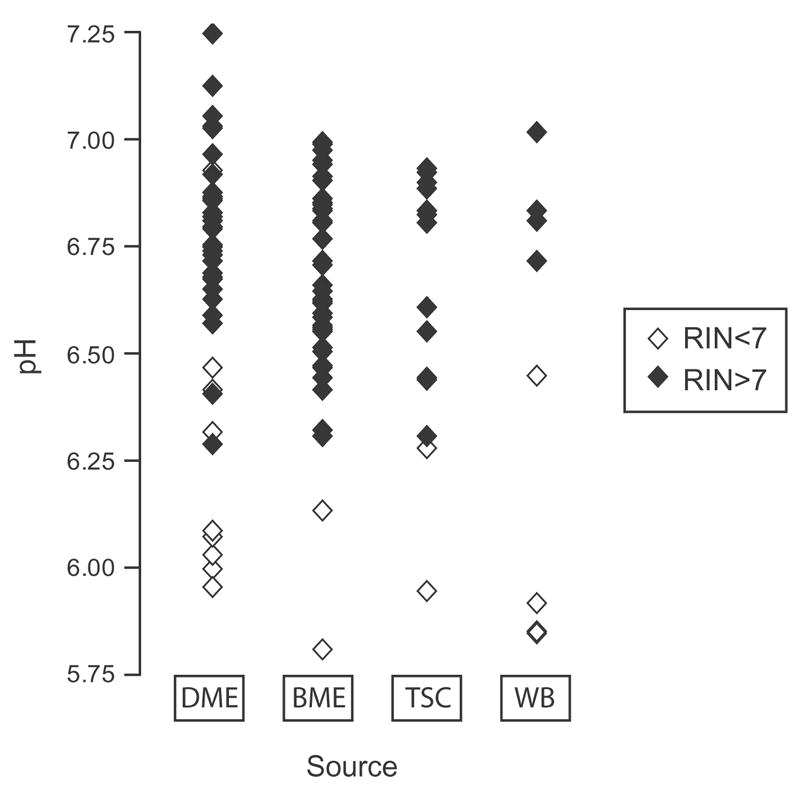
Scatterplot diagram of the pH distribution of all cases grouped by the source of tissue. Within every group, the cases with low RIN (RIN<7) are plotted in open diamonds and the cases with high RIN (RIN>7) are plotted in filled diamonds.
ii. pH across different brain regions
It is possible that inner regions of the brain cool more slowly than the brain surface, therefore brain tissue in the deep areas could be of poorer quality, due to its prolonged exposure to higher temperatures. To address this question, we sampled several parts of the brain found at variable distances from the brain surface: dorsolateral prefrontal cortex (DLPFC), medial prefrontal cortex (MPFC) and the deep temporal cortex (TC). Moreover, inside any brain region, given the higher metabolic rate of the neurons as compared to the glia, we predicted that the neurons might be more susceptible to the factors that adversely influence the tissue quality. As the gray matter (GM) is composed mostly of neuronal soma and the white matter (WM) mainly of axons and glia, a comparison between the WM and GM could provide a crude estimate of how different tissue types in the brain are conserved. We measured pH from the regions described above and found that the marker was constant across all the sampled areas and that pH in all brain regions tested is well represented by the cerebellum pH (Table 3).
Table 3.
pH across different brain regions
| Case | Index | Comparisons | Mean * SD | |||||
|---|---|---|---|---|---|---|---|---|
| Cerebellum | DLPFC | TC | MPFC | |||||
| WM | GM | GM | WM | GM | WM | |||
| 1 | 6.1 | 6.0 | 6.3 | 5.9 | 6.1 | 6.2 | 6.2 | 6.1 * 0.1 |
| 2 | 6.3 | 6.5 | 6.5 | 6.5 | 6.5 | 6.5 | 6.5 | 6.5 * 0.1 |
| 3 | 6.8 | 7.0 | 7.0 | 7.0 | 6.9 | 7.0 | 7.1 | 7.0 * 0.1 |
| 4 | 6.8 | 6.6 | 6.6 | 6.7 | 6.7 | 6.6 | 6.6 | 6.7 * 0.1 |
| 5 | 6.8 | 6.6 | 7.0 | 6.7 | 7.0 | 7.1 | 6.9 | 6.9 * 0.2 |
2b. RNA Quality
i. Agarose gel electrophoresis
Intact total RNA consists mainly of two ribosomal species: 28S and 18S. Their corresponding bands should appear crisp and well delineated on a gel electrophoresis and the 28S band should be approximately twice as bright as the 18S band. As total RNA degrades, shorter fragments progressively accumulate and the ribosomal species become less abundant; consequently, the 28S and 18S bands fade or disappear and the smaller species migrate as a smear. Illustrations of this by RNA quality are given in Fig. 3a.
Fig. 3.
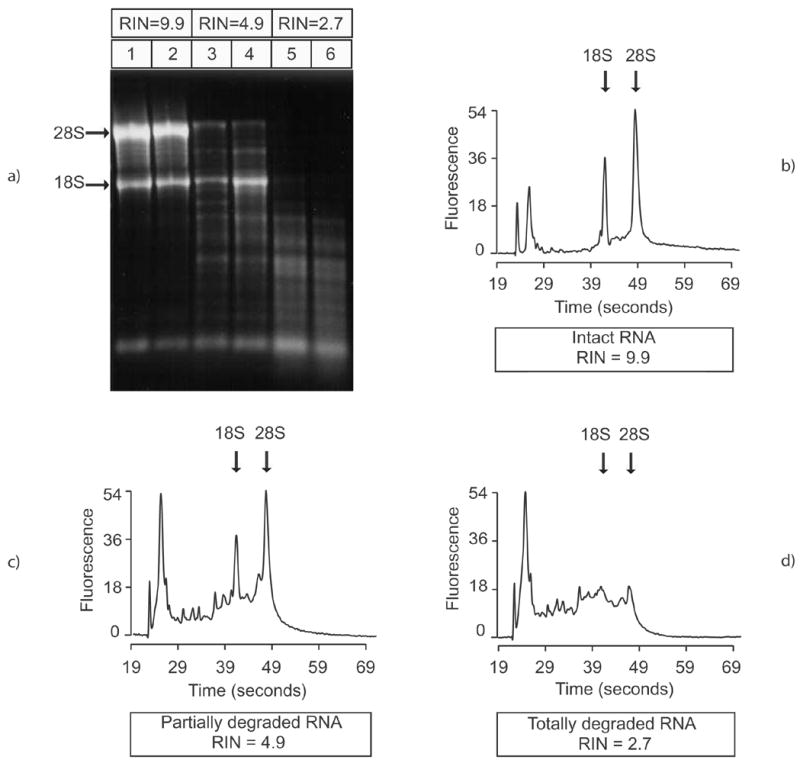
Agarose gel electrophoresis image (a) and electropherograms of three representative RNA samples: intact RNA (RIN = 9.9) (b), partially degraded RNA (RIN = 4.9) (c) and totally degraded RNA (RIN = 2.7) (d)
ii. Agilent bioanalyzer
Agilent electrophoresis utilizes microcapillary electrophoresis, separating the molecules by size. The output is a diagram that displays fluorescence over time, with small molecules appearing at the left side of the graph. Illustrations of this by RNA quality are in Fig. 3b (high quality), Fig. 3c (medium quality), and Fig. 3d (low quality). With intact RNA, the baseline is flat, the two main peaks corresponding to the ribosomal species are sharp and clearly defined, and there is little noise between them (Fig. 3b). With progressive degradation of the total RNA, low molecular weight material can be visualized as supplementary peaks at the left side of the curve or as a shift in the baseline, and the ribosomal peaks are lower (Fig. 3c). Totally degraded RNA is made only of short fragments (Fig. 3d).
Classically, the 28S/18S area ratio has been used to assess the total RNA quality. The 28S:18S rRNA ratio is calculated by dividing the areas under the 18S rRNA peak into the area under the 28S rRNA peak. When RNA is intact, the ratio should be approximately 2. However, looking only at 28S/18S ratio for RNA quality doesn’t capture the magnitude of the degradation products in the estimation of RNA quality.
To solve this problem, Agilent developed an algorithm that analyzes the entire electropherogram without investigator bias and assigns a score from 1 to 10 based on the ribosomal peaks and the extent of RNA degradation products. This score is designated as RIN (RNA Integrity Number). A completely intact RNA will be attributed a RIN of 10. As more peaks different from 28S and 18S are encountered, RIN decreases accordingly to reflect the presence of the degraded material (Imbeaud et al., 2005).
3. Correlates of Tissue Quality
3a. pH and RIN
Overall, there is a good correlation between pH and RIN (R2 = 0.64) (Fig. 4a). RIN and pH are highly correlated in the low RIN value range (RIN<7) (R2 = 0.8) (Fig. 4b). This correlation is not evident when looking only at higher RIN values (RIN>7) (R2 = 0.1), supporting the need for other tissue quality markers in addition to pH. Since most of the tissue we collected was of reasonably high quality, we may have had too few low quality cases to represent this correlation strongly.
Fig. 4.
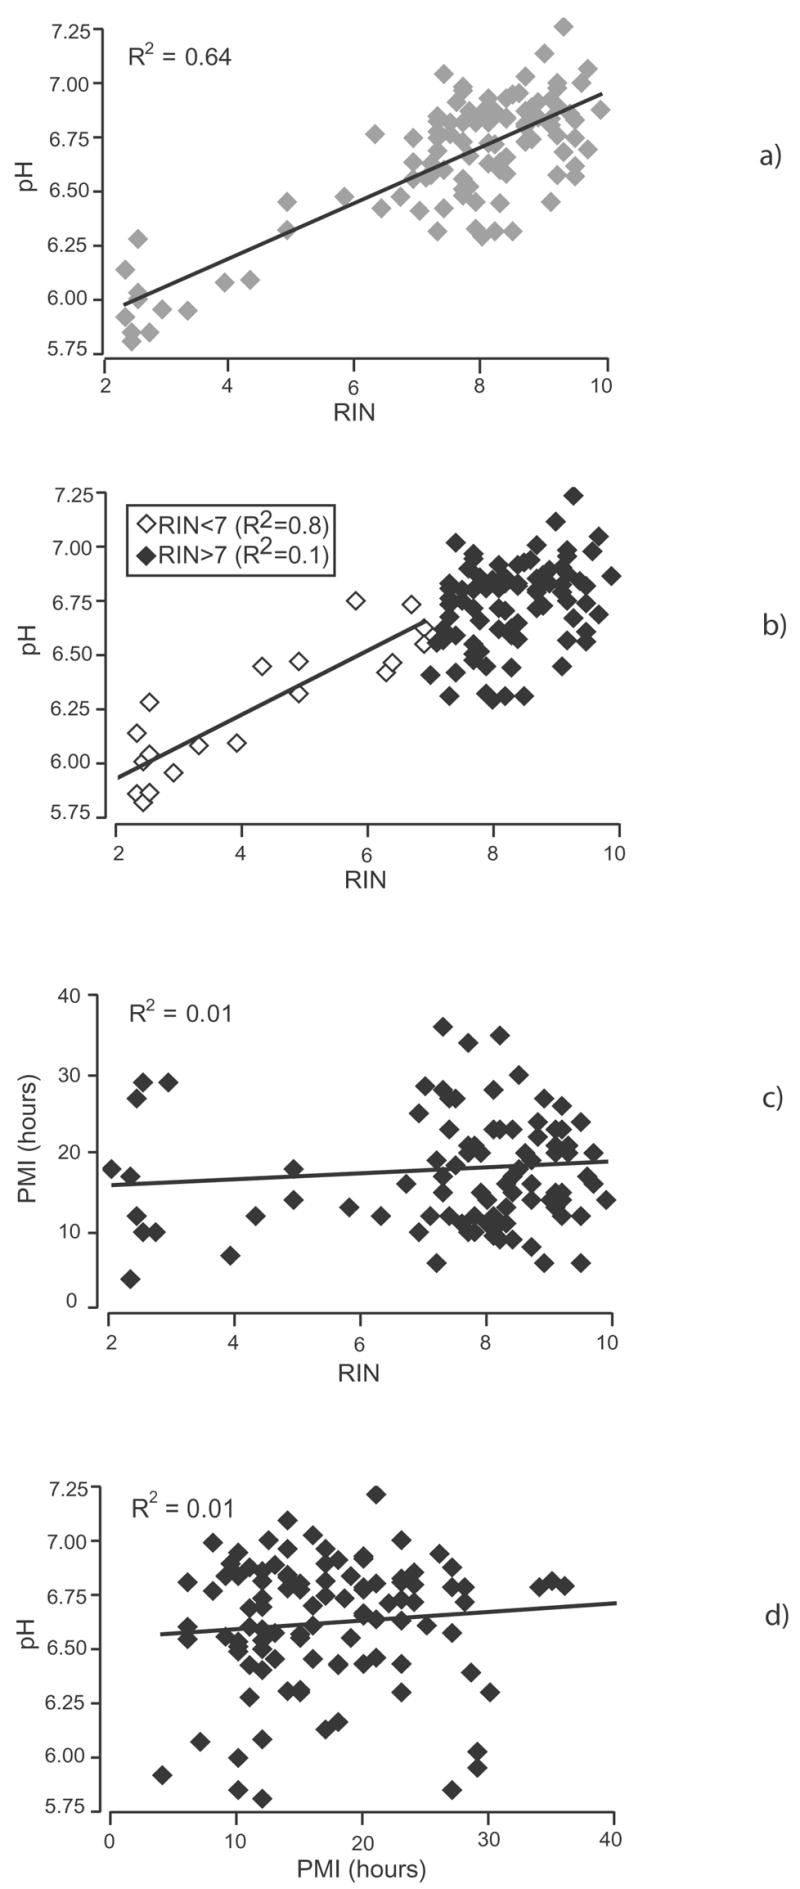
Correlations between different quality parameters: (a) pH and RIN. At low RIN values (RIN<7; white diamonds), there is a strong correlation between pH and RIN (R2=0.8). No correlation develops at high RIN values (RIN>7; black diamonds). The correlation bar is shown only for the low RIN value range; (b) pH and RIN. There is a good overall correlation between pH ands RIN (R2=0.6) (c) PMI and RIN. No significant correlation exists (R2=0.01); (d) pH and PMI. No significant correlation exists (R2=0.01).
3b. PMI and RIN
Postmortem interval (PMI) as used here is the interval between the time of death and the time when the brain is frozen or fixed. When the exact time of death is unknown, we use the midpoint between the last time seen alive and the time when the body is discovered. Although traditionally thought to be a good marker of high tissue quality, with a PMI range of 6 to 40 hours, PMI does not correlate with the RNA quality (Fig. 4c). However, again, we may have lacked sufficiently long PMIs to demonstrate such a correlation.
3c. PMI and pH
Both PMI and pH have been previously used to indicate RNA quality assessment, but our data showed that there is no correlation between them, looked at independently (Fig. 4d). Again, a correlation might become evident in poor quality tissue.
3d. Protein concentration correlate
Although VCP is not widely used as a loading control, we found it to have low variability across all tissue conditions. Out of 6 protein gels, we averaged the VCP values across all lanes and normalized VCP value in every lane to the average value. The changes relative to the mean were between 0.5% and 10%, even if we loaded tissue of different PMIs, RINs and agonal conditions. Specifically, we loaded 6 protein gels: the coefficients of VCP variability for each gel were as follows: 0.07, 0.06, 0.07, 0.06, 0.05, and 0.03. To begin to evaluate the effect of tissue quality markers on protein concentrations in the postmortem material, we measured protein concentrations in cerebellar tissue and correlated them with putative quality markers. Proteins of different sizes were chosen spanning different molecular weights (Rab 3A = 30 KDa; Syntaxin 1 = 35 KDa; Synaptotagmin 1 = 65 KDa; Munc-18 = 65 KDa) and from different cellular compartments (Rab 3A = 50% soluble, 50% synaptic vesicles; Syntaxin 1 = plasma membrane, Synaptotagmin 1 = synaptic vesicles, Munc-18 = 50% soluble, 50% plasma membrane) (Siew et al., 2004). These results were intended to be illustrative, not definitive. The relationship between the levels of these proteins and PMI, pH and RIN are shown in Fig. 5a, 5b, and 5c. Protein concentrations of these diverse illustrative proteins are stable across all of the tissue conditions available in the tissue collections we have analyzed. Neither PMI, pH, nor RIN impacts protein concentrations in the human tissue.
Fig. 5.

Correlation between protein level and quality parameters for five different proteins: GAPDH (G), Munc-18 (M), Syt1 (St), Rab3a (R), and Syntaxin (Sn). Only the correlation bars are shown for the tested proteins (dotted lines). (a) protein level and RIN; (b) protein level and pH; (c) protein level and PMI. No correlation develops in any case (R2<0.2) (see following table).
| Prot level (r.u.) | GAPDH (G) | Munc-18 (M) | Syt-1 (St) | Rab 3A (R) | Synt (Sn)a |
|---|---|---|---|---|---|
| RIN | R2 = 0.0052 | R2 = 0.1743 | R2 = 0.0431 | R2 = 0.0026 | R2 = 0.04 |
| pH | R2 = 0.0068 | R2 = 0.0193 | R2 = 0.1341 | R2 = 0.0413 | R2 = 0.0216 |
| PMI | R2 = 0.0828 | R2 = 0.0834 | R2 = 0.1037 | R2 = 0.0334 | R2 = 0.0002 |
4. Tissue Examples
4a. Effect of thaw
Accidentally, several pieces of cerebral tissue thawed and stayed at room temperature (in the −80 degree C freezer) for up to 24 hours. Fig. 6 illustrates the electropherograms for the 3 tissue samples before and after the thaw. The pH was practically unchanged across the before and after samples. However, the RNA quality was severely degraded, as indicated by the precipitous drop of RIN and by the electrophoretic migration pattern. Fig. 7 shows the before and after tissue values for both pH and RIN. Although the drop in pH was significant, the value is not informative for a quality marker, given the extensive overlap between “before” and “after” values. However, nearly all RIN values were in the “thawed” tissue were below 7. This example demonstrates a tissue condition where pH fails to signal the post - thaw change, whereas RIN easily discriminates the pre- and post-thaw states.
Fig. 6.
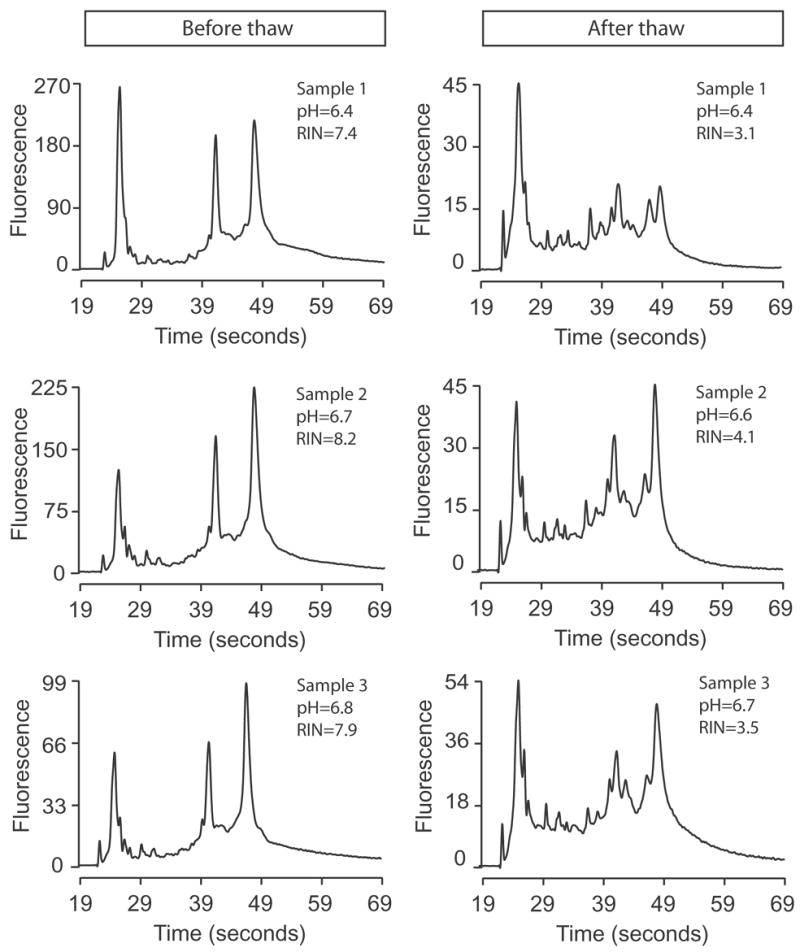
Electropherograms of three RNA samples before (left column) and after (right column) tissue thawing. The pH and RIN are written in the cassette for each condition.
Fig. 7.
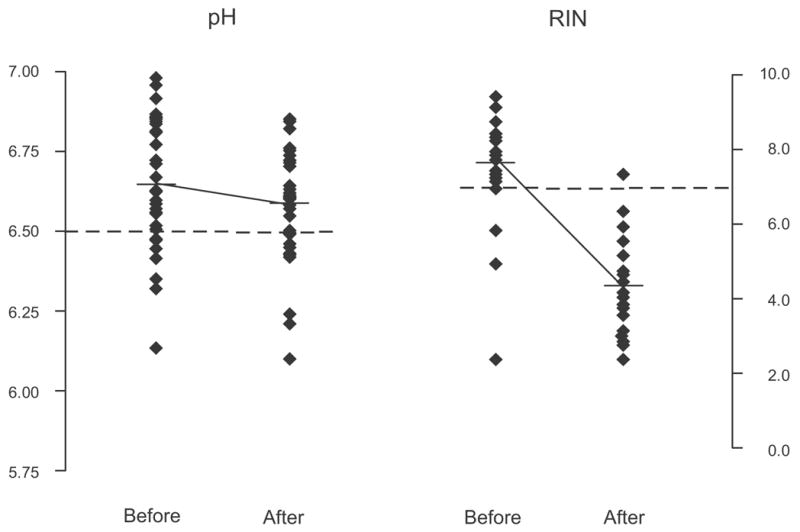
Scatterplot diagram of the pH and RIN distribution before and after the thaw. The dotted lines represent a pH value of 6.5 (our threshold for good versus low quality tissue) and a RIN value of 7 (our threshold for good versus low quality tissue). As results from the graph, most of the RIN values after the thaw are below 7.
4b. Human surgical tissue
Some investigators have speculated that most of the degradation of RNA and protein in brain tissue happens early after death, perhaps within the first hour. To assess tissue with the shortest possible time after sampling, we procured and analyzed 4 surgical tissue samples. These were small pieces of medial temporal cortex collected during neurosurgery for epilepsy and frozen in less than 60 minutes. We predicted that our surgical samples would have an intact RNA and a pH close to the physiological pH of the living brain. Surprisingly, the range of pH values was similar to those found in postmortem brains; RIN values were generally lower, sometimes strikingly, than in the postmortem brain and the pH did not correlate with RIN (Table 3).
Discussion
This study examined the characteristics of postmortem tissue quality in two human postmortem brain collections with the goal of identifying optimal tissue quality characteristics to use when selecting cases for human molecular studies. Furthermore, we examined the extent to which molecular measures from human postmortem tissue can be taken to represent such measures from fresh tissue and, therefore, the extent to which data from human postmortem brain tissue can represent the molecular conditions of the live brain. This study assumed optimal clinical diagnosis of cases, an essential feature of the process (Deep-Soboslay et al., 2005). The answers to these questions serve to suggest additional questions for the area of postmortem tissue quality and provide support for the use of postmortem brain tissue in studies of human brain research (Lewis, 2002; Tomita et al., 2004; Torrey et al., 2000).
These data show that chemical markers of tissue quality exist and suggest that they are useful in validating tissue quality. The traditional markers of tissue quality have been descriptive and included PMI, agonal condition, case age and health. In our hands, PMI was not predictive for RNA stability (within the limited quality range of our cases), confirming findings from a previous report (Trotter et al., 2002). Gradually, the field has acquired chemical markers of tissue quality, starting with pH and 28S/18S ratio, and now including direct measures of RNA quality, like RIN. The most useful human postmortem tissue quality marker in our hands is RIN. It correlates with the pH of the tissue and integrates the extent of RNA degradation with the presence of the 28S/18S peaks. However, caution is necessary: RIN is undoubtedly a sensitive indicator of total RNA integrity and a good predictor of overall mRNA integrity. However, since it has been shown that under certain circumstances some specific mRNA species are preferentially degraded (Barrachina et al., 2006; Buesa et al., 2004), it is advisable to verify individual mRNA integrity within an experiment. Our finding that RIN is the optimal marker for representing quality agrees with previously published studies that found RNA quality measures in assessing gene expression analysis (Colangelo et al., 2002; Jones et al., 2006; Ross et al., 1992).
pH appears to be a good marker of peri-mortem tissue quality, but does not appear to be sensitive to freezer degradation, as shown in our tissue-thaw illustration. Cerebellar tissue appears to be an adequate representative for other brain regions when testing for quality markers. Although we did not screen everywhere, we tested several representative regions from brain surface and from deep brain structures and saw pH values correlate highly. The data suggest that measures of tissue quality from a single brain region (like cerebellum) are likely to be representative of whole brain.
Overall, we found that the cases with the best tissue quality were more likely to come from the medical examiner’s office than from other collection sources. It is reasonable to assume that cases where the cause of death is fast and unexpected might demonstrate good pre-mortem conditions with low agonal stress. It must be stressed, however, that before analyzing tissue quality for the collection cases, we had already screened and excluded many ME cases who failed to meet collection criteria (e.g., drug abuse, infectious diseases, head injury) so that the cases that qualified for our collection were already pre-screened for potentially confounding conditions. Therefore, we can only claim that it is for the subset of ME cases where case confounds have already been excluded, that tissue quality is high. In contrast, the tissue collected from the WB program was from cases with advanced age and anticipated deaths, where these and other confounds might have biased tissue quality.
Somewhat unexpectedly, in a preliminary analysis, we showed that postmortem tissue has tissue quality markers that are at least as good as surgical biopsy tissue. We are in the process of examining this question further to determine the source of RNA degradation in the surgical tissue. Several possibilities are reasonable: still active RNAases in the surgical tissue, the surgical anesthesia or exposure to air while fresh. However, these results provide preliminary support for a renewed confidence in molecular measures derived from postmortem tissue (Bahn et al., 2001; Leonard et al., 1993; Preece et al., 2003).
Furthermore, the results raise the possibility that variability in molecular outcomes across CNS regions and disease groups may more likely be the result of tissue heterogeneity than postmortem degradation.
The data shown here document remarkable stability of the protein we selected in postmortem tissue. However, until further data accrue, documentation of protein stability should still be individually demonstrated for specific experiments. Nonetheless, the proteins that we selected for analysis were varied by size and tissue compartment and are, to some extent, representative. However, others have found variable protein degradation in human and animal postmortem brain using immunoblotting and immunohistochemistry techniques (Irving et al., 1997; Li et al., 1996; Liu and Brun, 1995). Even so, in most cases, protein degradation occurred at high PMIs (> 40 hours). Moreover, we do not exclude the possibility of early degradation for specific proteins and we pursue the question of the stability of protein species using fresh human surgical tissue.
In conclusion, we find evidence for the proposal that human high quality postmortem tissue is a generally reliable laboratory resource for exploring molecular characteristics of healthy and diseased human brain. For any RNA or protein species, its degradation characteristics in human postmortem tissue still need to be documented. Nonetheless, case screening and tissue quality assessments (including RIN) are two indispensable tools to selecting postmortem cases representative of human brain tissue.
Table 4.
Surgical Tissue Characteristics
| Sample | Age | Gender | Race | pH | RIN |
|---|---|---|---|---|---|
| Sample 1 | 23 | F | L | 6.9 | 5.4 |
| Sample 2 | 62 | M | L | 6.9 | 2.4 |
| Sample 3 | 36 | M | U | 5.7 | 3.5 |
| Sample 4 | 54 | F | L | 6.8 | 3.1 |
Acknowledgments
Drs. Couso-Bertalo and Sami Daoud participated in the dissections for the Maryland Brain Collection. Pengfei Cheng did the statistical analysis. This work was supported by a MH 60744 (RCR) and a MH 6223602 grant.
Abbreviations
- NL
Normal control
- SZ
Schizophrenia
- BD
Bipolar Disorder
- D/S
Depression/Suicide
- C
Caucasian
- AA
African – American
- L
latino
- U
unknown
- O
Other
- PMI
postmortem interval
- AFS
Agonal Factor Score
- RIN
RNA integrity number
- DME
Dallas County Medical Examiner’s Office
- BME
Baltimore Medical Examiner’s Office
- TSC
Transplant Service Center
- WB
Willed Body Program
- DLPFC
dorsolateral prefrontal cortex
- MPFC
medial prefrontal cortex
- TC
deep temporal cortex
- WM
white matter
- GM
gray matter
- SD
standard deviation.
Footnotes
Publisher's Disclaimer: This is a PDF file of an unedited manuscript that has been accepted for publication. As a service to our customers we are providing this early version of the manuscript. The manuscript will undergo copyediting, typesetting, and review of the resulting proof before it is published in its final citable form. Please note that during the production process errors may be discovered which could affect the content, and all legal disclaimers that apply to the journal pertain.
References
- Bahn S, et al. Gene expression profiling in the post-mortem human brain--no cause for dismay. J Chem Neuroanat. 2001;22:79–94. doi: 10.1016/s0891-0618(01)00099-0. [DOI] [PubMed] [Google Scholar]
- Barrachina M, et al. TaqMan PCR assay in the control of RNA normalization in human post-mortem brain tissue. Neurochem Int. 2006;49:276–284. doi: 10.1016/j.neuint.2006.01.018. [DOI] [PubMed] [Google Scholar]
- Barton AJ, et al. Pre- and postmortem influences on brain RNA. J Neurochem. 1993;61:1–11. doi: 10.1111/j.1471-4159.1993.tb03532.x. [DOI] [PubMed] [Google Scholar]
- Buesa C, et al. DNA chip technology in brain banks: confronting a degrading world. J Neuropathol Exp Neurol. 2004;63:1003–14. doi: 10.1093/jnen/63.10.1003. [DOI] [PubMed] [Google Scholar]
- Casanova MF, Kleinman JE. The neuropathology of schizophrenia: a critical assessment of research methodologies. Biol Psychiatry. 1990;27:353–62. doi: 10.1016/0006-3223(90)90009-q. [DOI] [PubMed] [Google Scholar]
- Castensson A, et al. High-resolution quantification of specific mRNA levels in human brain autopsies and biopsies. Genome Res. 2000;10:1219–29. doi: 10.1101/gr.10.8.1219. [DOI] [PMC free article] [PubMed] [Google Scholar]
- Colangelo V, et al. Gene expression profiling of 12633 genes in Alzheimer hippocampal CA1: transcription and neurotrophic factor down-regulation and up-regulation of apoptotic and pro-inflammatory signaling. J Neurosci Res. 2002;70:462–73. doi: 10.1002/jnr.10351. [DOI] [PubMed] [Google Scholar]
- Deep-Soboslay A, et al. Reliability of psychiatric diagnosis in postmortem research. Biol Psychiatry. 2005;57:96–101. doi: 10.1016/j.biopsych.2004.10.016. [DOI] [PubMed] [Google Scholar]
- Ferrer-Alcon M, et al. Downregulation of neuronal cdk5/p35 in opioid addicts and opiate-treated rats: relation to neurofilament phosphorylation. Neuropsychopharmacology. 2003;28:947–55. doi: 10.1038/sj.npp.1300095. [DOI] [PubMed] [Google Scholar]
- Hargrove JL, Schmidt FH. The role of mRNA and protein stability in gene expression. Faseb J. 1989;3:2360–70. doi: 10.1096/fasebj.3.12.2676679. [DOI] [PubMed] [Google Scholar]
- Harrison PJ, et al. The effects of Alzheimer's disease, other dementias, and premortem course on beta-amyloid precursor protein messenger RNA in frontal cortex. J Neurochem. 1994;62:635–44. doi: 10.1046/j.1471-4159.1994.62020635.x. [DOI] [PubMed] [Google Scholar]
- Harrison PJ, et al. The relative importance of premortem acidosis and postmortem interval for human brain gene expression studies: selective mRNA vulnerability and comparison with their encoded proteins. Neurosci Lett. 1995;200:151–4. doi: 10.1016/0304-3940(95)12102-a. [DOI] [PubMed] [Google Scholar]
- Harrison PJ, et al. Terminal coma affects messenger RNA detection in post mortem human temporal cortex. Brain Res Mol Brain Res. 1991;9:161–4. doi: 10.1016/0169-328x(91)90143-l. [DOI] [PubMed] [Google Scholar]
- Hynd MR, et al. Biochemical and molecular studies using human autopsy brain tissue. J Neurochem. 2003;85:543–62. doi: 10.1046/j.1471-4159.2003.01747.x. [DOI] [PubMed] [Google Scholar]
- Imbeaud S, et al. Towards standardization of RNA quality assessment using user-independent classifiers of microcapillary electrophoresis traces. Nucleic Acids Res. 2005;33:e56. doi: 10.1093/nar/gni054. [DOI] [PMC free article] [PubMed] [Google Scholar]
- Irving EA, et al. The effect of postmortem delay on the distribution of microtubule-associated proteins tau, MAP2, and MAP5 in the rat. Mol Chem Neuropathol. 1997;30:253–71. doi: 10.1007/BF02815102. [DOI] [PubMed] [Google Scholar]
- Johnson SA, et al. Extensive postmortem stability of RNA from rat and human brain. J Neurosci Res. 1986;16:267–80. doi: 10.1002/jnr.490160123. [DOI] [PubMed] [Google Scholar]
- Johnston NL, et al. Multivariate analysis of RNA levels from postmortem human brains as measured by three different methods of RT-PCR. Stanley Neuropathology Consortium. J Neurosci Methods. 1997;77:83–92. doi: 10.1016/s0165-0270(97)00115-5. [DOI] [PubMed] [Google Scholar]
- Jones L, et al. Assessment of the relationship between pre-chip and post-chip quality measures for Affymetrix GeneChip expression data. BMC Bioinformatics. 2006;7:211. doi: 10.1186/1471-2105-7-211. [DOI] [PMC free article] [PubMed] [Google Scholar]
- Kingsbury AE, et al. Tissue pH as an indicator of mRNA preservation in human post-mortem brain. Brain Res Mol Brain Res. 1995;28:311–8. doi: 10.1016/0169-328x(94)00219-5. [DOI] [PubMed] [Google Scholar]
- Lee J, et al. Effects of RNA degradation on gene expression analysis of human postmortem tissues. Faseb J. 2005;19:1356–8. doi: 10.1096/fj.04-3552fje. [DOI] [PubMed] [Google Scholar]
- Leonard S, et al. Biological stability of mRNA isolated from human postmortem brain collections. Biol Psychiatry. 1993;33:456–66. doi: 10.1016/0006-3223(93)90174-c. [DOI] [PubMed] [Google Scholar]
- Lewis DA. The human brain revisited: opportunities and challenges in postmortem studies of psychiatric disorders. Neuropsychopharmacology. 2002;26:143–54. doi: 10.1016/S0893-133X(01)00393-1. [DOI] [PubMed] [Google Scholar]
- Li JZ, et al. Systematic changes in gene expression in postmortem human brains associated with tissue pH and terminal medical conditions. Hum Mol Genet. 2004;13:609–16. doi: 10.1093/hmg/ddh065. [DOI] [PubMed] [Google Scholar]
- Li X, et al. Effects of postmortem interval, age, and Alzheimer's disease on G-proteins in human brain. Neurobiol Aging. 1996;17:115–22. doi: 10.1016/0197-4580(95)02023-3. [DOI] [PubMed] [Google Scholar]
- Liu X, Brun A. Synaptophysin immunoreactivity is stable 36 h postmortem. Dementia. 1995;6:211–7. doi: 10.1159/000106949. [DOI] [PubMed] [Google Scholar]
- Miller CL, et al. Evaluating RNA status for RT-PCR in extracts of postmortem human brain tissue. Biotechniques. 2004;36:628–33. doi: 10.2144/04364ST03. [DOI] [PubMed] [Google Scholar]
- Mirnics K, et al. Analysis of complex brain disorders with gene expression microarrays: schizophrenia as a disease of the synapse. Trends Neurosci. 2001;24:479–86. doi: 10.1016/s0166-2236(00)01862-2. [DOI] [PubMed] [Google Scholar]
- Preece P, Cairns NJ. Quantifying mRNA in postmortem human brain: influence of gender, age at death, postmortem interval, brain pH, agonal state and inter-lobe mRNA variance. Brain Res Mol Brain Res. 2003;118:60–71. doi: 10.1016/s0169-328x(03)00337-1. [DOI] [PubMed] [Google Scholar]
- Preece P, et al. An optimistic view for quantifying mRNA in post-mortem human brain. Brain Res Mol Brain Res. 2003;116:7–16. doi: 10.1016/s0169-328x(03)00208-0. [DOI] [PubMed] [Google Scholar]
- Ravid R, et al. Brain banking and the human hypothalamus--factors to match for, pitfalls and potentials. Prog Brain Res. 1992;93:83–95. doi: 10.1016/s0079-6123(08)64565-3. [DOI] [PubMed] [Google Scholar]
- Ross BM, et al. On the stability of messenger RNA and ribosomal RNA in the brains of control human subjects and patients with Alzheimer's disease. J Neurochem. 1992;58:1810–9. doi: 10.1111/j.1471-4159.1992.tb10057.x. [DOI] [PubMed] [Google Scholar]
- Siew LK, et al. Measurement of pre- and post-synaptic proteins in cerebral cortex: effects of post-mortem delay. J Neurosci Methods. 2004;139:153–9. doi: 10.1016/j.jneumeth.2004.04.020. [DOI] [PubMed] [Google Scholar]
- Tomita H, et al. Effect of agonal and postmortem factors on gene expression profile: quality control in microarray analyses of postmortem human brain. Biol Psychiatry. 2004;55:346–52. doi: 10.1016/j.biopsych.2003.10.013. [DOI] [PMC free article] [PubMed] [Google Scholar]
- Torrey EF, et al. The stanley foundation brain collection and neuropathology consortium. Schizophr Res. 2000;44:151–5. doi: 10.1016/S0920-9964(99)00192-9. [DOI] [PubMed] [Google Scholar]
- Trotter SA, et al. Stability of gene expression in postmortem brain revealed by cDNA gene array analysis. Brain Res. 2002;942:120–3. doi: 10.1016/s0006-8993(02)02644-6. [DOI] [PubMed] [Google Scholar]
- Wester P, et al. Agonal status affects the metabolic activity of nerve endings isolated from postmortem human brain. Neurochem Pathol. 1985;3:169–80. doi: 10.1007/BF02834269. [DOI] [PubMed] [Google Scholar]