

Abstract
Purpose
To assess what image plane is most reproducible for performance of brain volumetry measurements, and to determine inter- and intra-observer variability in determining fetal brain volume in fetuses referred for ventriculomegaly (VM).
Materials and Methods
In this IRB-approved, HIPAA compliant prospective study, 50 consecutive fetuses 17 to 37 weeks gestational age (GA) referred for magnetic resonance (MR) imaging for VM underwent fast spin-echo T2-weighted imaging. Supratentorial brain parenchyma, lateral ventricles, extra-axial and cerebellar volumetric measurements were manually obtained in 3 planes by two radiologists. Inter- and intra-observer variability were assessed. The relationship between volumes and GA, lateral ventricular diameter, and preliminary neonatal outcomes were compared and results were stratified by prenatal and postnatal diagnosis (normal, isolated VM, VM with other central nervous system findings).
Results
Volumes increased with GA. The presence of VM correlated with increased lateral ventricle diameter. The effect of image plane was negligible. Inter- and intra-observer variability were low. In all cases, parenchymal volume was significantly different between the normal study group and those with VM. Ventricular volumes were significantly different in neonatal outcomes of isolated VM of 10-15 mm compared to the group with VM with other central nervous system findings (P = .002).
Conclusion
Supratentorial parenchyma and lateral ventricular volumes can be reliably measured on fetal MR and imaging plane was not an important factor in measurement. Further studies are needed to correlate these indices with long-term postnatal outcomes.
Keywords: ventriculomegaly, MRI, central nervous system
Introduction
Mild fetal ventriculomegaly (VM) is defined as a transverse atrial measurement of 10-15 mm [1] and is associated with other anomalies, both neuronal and somatic, in 70-85% of cases [2-10]. Multiple studies have shown that the anomalies that occur in conjunction with, or are the source of, enlarged ventricles (rather than the degree of dilatation) account for most of the morbidity and mortality associated with VM [1-10]. Therefore, the sonographic finding of fetal VM prompts a careful search for other anomalies, both inside and outside the central nervous system (CNS). However, the false negative rates for the detection of associated anomalies in experienced prenatal diagnostic centers is approximately 10-25% [1, 11]. In some of these cases the missed anomalies (e.g., migrational disorders of the gray matter) were too subtle to be detected with ultrasound prior to birth. In others, the anomaly was potentially diagnosable but technically difficult [12]. Fetal MR has greatly improved our ability to counsel patients with prenatal diagnosis of VM, since it can show abnormalities that are not diagnosed sonographically [13-18].
Follow-up of cognitive and motor development in cases of sonographically diagnosed fetal VM has been reported in a limited fashion [4, 7, 19-21]. However, it is difficult to generalize these preliminary results due to small sample sizes, inclusion of various anomalies associated with mild VM, differences in evaluation techniques, and short terms of follow-up. In studies limited to follow-up of sonographically isolated mild VM, developmental delays were reported in 0-36% of cases [1, 6, 22, 23]. This wide range of outcomes can be explained at least in part by differing methods of evaluation of development. The degree of ventriculomegaly is correlated to outcome, with fetuses with ventricular width less than 12 mm having better outcome [21, 24].
As part of an ongoing study to assess outcomes in fetuses with VM, we hypothesized that the use of qualitative and quantitative MRI indices will improve the diagnostic utility of MR to predict outcomes compared to a reliance on sonographic data alone. Specifically, in fetuses with VM, higher ventricular volume and lower cortical volume (with respect to gestational age, GA) will each correlate negatively with normal cognitive and motor development.
However, in order to test this hypothesis, we must first validate the method of performing fetal brain volumetry. This study was performed to assess what image plane is most reproducible for performance of brain volumetry measurements, and to determine inter- and intra-observer variability in determining fetal brain volumes in fetuses referred for VM.
Materials and Methods
Patients
50 fetuses from 50 consecutive pregnant patients referred for MR due to sonographically diagnosed VM were studied between 7/1/2003 and 10/18/2004 as part of an IRB approved, HIPAA compliant NIH funded study at ≪name of institution withheld≫. Patient data included age by dates in weeks (based on either the last menstrual period (LMP) or the estimated due date if the patient had been re-dated in a first trimester sonogram) and referral diagnosis.
Imaging
Ultrasound
All fetuses had a sonogram performed at our institution on the day of the MR. Sonograms were performed with an ATL 5000 (ATL, Bothell, WA) unit with 2.5–5.0-MHz transducers by a radiologist with experience in high-risk obstetric ultrasound (initials withheld for review, 12 years of experience). When the fetus was in cephalic position, a transvaginal scan was also performed to better assess intracranial anatomy.
Sonographic data obtained included biometric measurements in weeks (biparietal diameter (BPD), head circumference (HC), and average ultrasound age (calculated from the average of BPD, HC, abdominal circumference and femur length using Hadlock [25]), and lateral ventricular diameter (measured on a transverse image at the atrium). When VM was asymmetric, the larger ventricular diameter was used for data analysis. Sonographic diagnosis of VM (defined as a lateral ventricle measurement ≥ 10 mm), and other CNS anomalies were recorded.
MR protocol
MR examinations were performed on a 1.5-T superconducting system (Signa, General Electric Medical Systems, Milwaukee, WI) using an 8-element phased array surface coil with a radiologist monitoring the study as it was being performed. A 3-plane scout view was obtained and used to orient the first diagnostic imaging sequence. Single shot fast spin echo imaging was performed in the fetal sagittal, coronal, and axial planes using the following parameters: TR/TE = single shot/60; field of view from 30 × 30 cm up to 34 × 34 cm; matrix of 256 × 256 or 512 × 512; 4-5 mm slice thickness, sequence acquisition time of 29-45 seconds. The number of slices in each sequence depended upon fetal size and orientation of image plane to cover the region of interest. Each sequence was utilized as the scout for subsequent sequences. Sequences were repeated as needed to demonstrate pertinent anatomy, but since these studies were performed to assess CNS anatomy, and not necessarily to perform volumetry, sequences were not repeated if only a few slices were affected by motion. T1 weighted sequences were obtained for diagnostic purposes, but were not used for the volumetry portion of this study.
MR diagnosis
MR images were reviewed by a radiologist experienced in fetal MR (initials withheld for review, 11 years experience), and measurement of the size of the lateral ventricle (in mm) at the level of the atrium and at the frontal horns obtained using electronic calipers was recorded. MR diagnosis of VM (lateral ventricle measurement ≥ 10 mm), and other CNS anomalies were recorded.
Cases with discrepant diagnoses
Discrepant cases were categorized as follows:
When a referred VM case appeared normal upon sonography and MR, the case was categorized as normal.
When either sonography or MR showed an anomaly in addition to VM, the case was categorized as having VM plus an additional CNS finding.
When the sonographic and MR impression of VM were discordant in cases where the lateral ventricle measured close to 10 mm and no other CNS anomalies were visualized, the sonographic impression (the current standard for measurement of the ventricular atrial diameter) was used for categorization of the fetus (i.e., normal or VM).
Volume calculation
MR images were transferred to an Advantage Windows workstation (ADW 3.0 GE Medical Systems, Milwaukee, WI) and volumes were assessed using Advantage Windows Volume Analysis software (Voxtool 3.1® GE Medical Systems, Milwaukee, WI).
Radiologist A (initials withheld for review, with 3 years experience in fetal MR), selected the best sagittal, coronal and axial sequences for volumetric analysis. If a sequence subjectively showed motion that would interfere with accurate tracing, or if the entire brain was not included in a sequence then that sequence was not utilized for data analysis. If a particular image plane was obtained more than once during an examination, then the sequence with less motion was chosen for review. A total of 135 sequences in 50 fetuses were evaluated (46 axial, 44 coronal, 45 sagittal). 40 used 3 slice orientations, 6 used 2 slice orientations, and 4 used 1 slice orientation. No fetuses were excluded from review due to motion on all sequences.
Segmentation was performed using hand tracing of a free-form region-of-interest (ROI) on individual consecutive slices in the axial, sagittal and coronal (figure 1) planes around the outer aspect of supratentorial cortex, lateral ventricles and cerebellum. In addition, the extra-axial cerebrospinal fluid (CSF) was traced in the axial plane (figure 2). The area of each ROI obtained per image was automatically calculated (based on the cross-sectional area and slice thickness) and summed to determine the total ROI volume. Lateral ventricular volume included the choroid plexus. Supratentorial parenchymal volumes were obtained by subtracting the volume of the lateral ventricles from the volume of the supratentorial cortex tracing. In two images from the same 17week gestational age fetus, the two measures were small and close together (16-17 cc) and the difference was negative; these points were not used in analysis.
Figure 1.
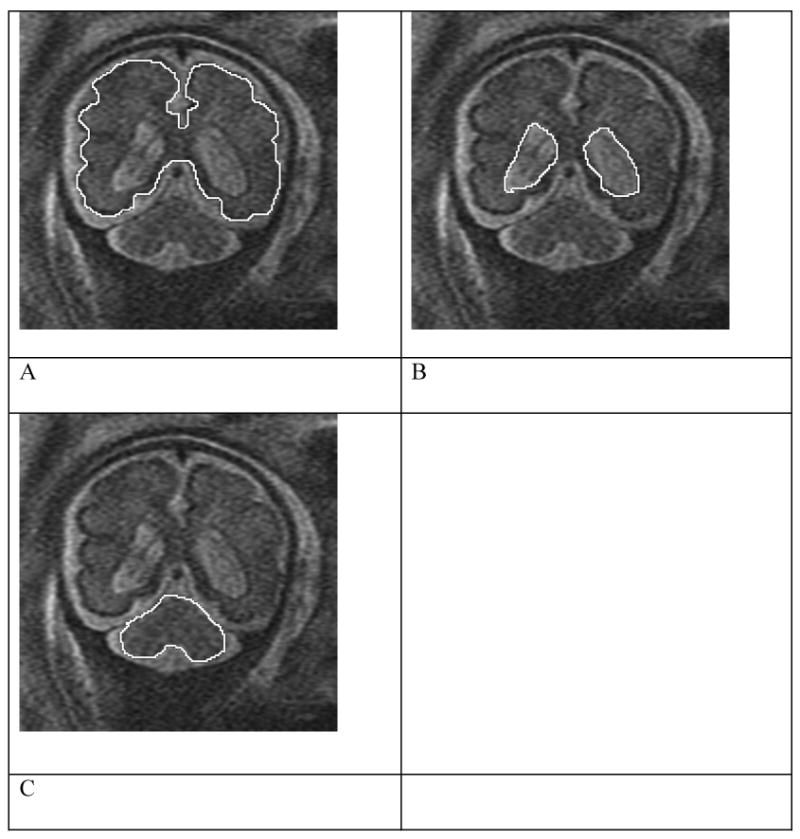
Coronal views of fetus at 31 weeks demonstrating tracings of the supratentorial cortex (A), ventricles (B), and cerebellum (C). The supratentorial parenchymal volume was determined by subtracting the values for the ventricles from that of the cortex.
Figure 2.
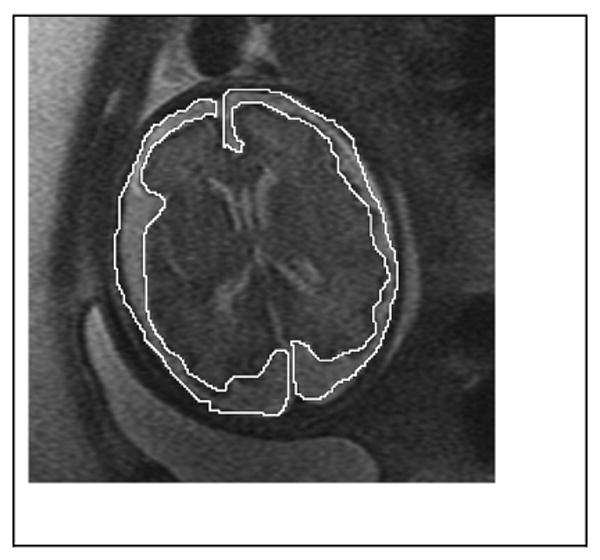
Axial image at 31 weeks demonstrating the tracing of extra-axial CSF
Radiologist A performed volumetry on all 50 fetuses at two separate intervals, 6 months apart, to minimize recall bias. The second set of volumetric analyses was performed blinded to the volumes obtained during the first analysis. A second radiologist, Radiologist B (initials withheld for review, with 1 year experience in fetal MR) performed volumetric analysis a single time on the same sequences as Radiologist A.
The total amount of time to manually trace the regions of interest was calculated for Radiologist A. This time included up to 3 image planes, cerebellar, and extra-axial space measurements. In order to obtain an estimate of time needed to perform volumetry in a single plane, this overall number was divided by the number of imaging planes used for the volumetry.
Neonatal outcome analysis
Neonatal outcomes were obtained from chart review (N= 38), imaging (N=24), and survey data (N=13), with 9 being in more than one category. If a patient dropped out of the study prior to postnatal imaging being performed, the mother was mailed a survey asking whether she felt her infant was normal or if there was another reason for leaving the study. Postnatal outcomes for 5 fetuses, all in the prenatal isolated VM group, were not obtained due to termination of pregnancy or loss to follow-up. One fetus with holoprosencephaly was excluded from outcomes analysis.
The relationship between prenatal diagnosis, neonatal outcomes, and volumes were compared overall using two different definitions of isolated mild VM. The first comparison defined a diagnosis of isolated mild VM as 10-12 mm and included the following groups:
Normal at the time of the prenatal MRI;
Mild VM only (10-12 mm) at the time of the prenatal MRI and neonatal outcome either normal or isolated mild VM ≤12 mm only;
Mild VM only (10-12 mm) at the time of the prenatal MRI and abnormal outcome (other CNS abnormality found at birth, postnatal VM >12 mm, or death).
The alternative scenario defined a diagnosis of isolated mild VM as 10 -15mm and included these groups:
Normal at the time of the prenatal MRI;
Mild VM only (10-15 mm) at the time of the prenatal MRI and neonatal outcome either normal or isolated mild VM ≤ 15 mm;
Any other VM diagnosis at the time of the prenatal MRI and/or abnormal outcome (other CNS abnormality at birth, postnatal VM > 15 mm, or death).
Any fetus with prenatal diagnosis of isolated mild VM who lacked outcome data was categorized as having a postnatal outcome of normal/mild VM to address potential bias related to a differential lack of follow-up across study groups.
Statistical analysis
Each volume measurement (supratentorial parenchyma, ventricles, cerebellum, and extra-axial CSF) was analyzed separately, as was the ratio of ventricular to supratentorial parenchymal volume. We used a comprehensive mixed-effects regression model to assess simultaneously the influences of GA, plane of observation, random variability among subjects, and random variability between and within raters. Fetal GA was represented in four alternate ways: by dates, ultrasound biometry; BPD alone, and HC alone. The regression model also included terms for interaction of plane with rater, testing whether rater agreement was better in one plane of observation than another; and interaction of plane with fetal size, testing whether the relationship of volume with respect to GA or brain size was the same as observed from all directions.
To compare volume among subgroups according to prenatal diagnosis and neonatal outcome, we added these groupings to the regression model.
The volume measurements were log-transformed for analysis. Consequently the regression contrasts and variance components are expressed as percentages; e.g., the patient-to-patient standard deviation of log10 parenchymal volume was 0.139, which we report as a relative standard deviation of 100%×(100.139−1) = 38%. Gestational age was entered linearly in the model, and accordingly the relationship of volume with respect to GA is expressed as percentage per wk; e.g., the regression coefficient for log10 parenchymal volume was 0.0646/wk, which we report as 100 %×( 100.0646−1) = 16.0%/wk. Head size was log-transformed for entry into the regression model, making the rate increase of volume with respect to head size the exponent of a power-law relationship; e.g., the regression coefficient for log10 parenchymal volume was 2.7 per log10 BPD, which we report as volume being proportional to the 2.7 power of BPD. For comparison among outcome groups of the ratio of ventricular to parenchymal volume, we log-transformed the ratio, i.e., analyzed the difference in log volumes.
As a general index of reliability for each volume measurement, including all sources of random variance, we calculated the intraclass correlation coefficient (ICC) as: (Subject variance) ÷ (Subject + Inter-rater + Intra-rater + Residual variance). To assess the correlation of ventricular volume with MR measurements of ventricular size and parenchymal thickness, we used the Spearman correlation coefficient, adjusted for GA, because of its resistance to bias from highly skewed data. To assess the correlation between measurement time and GA, neither of which showed a pronounced skew, we used the Pearson correlation coefficient.
We used p<0.05 as the threshold for statistical significance and interpreted correlations above 0.6 as strong, below 0.4 as mild. SAS software (version 9.1, Cary, NC) was used for all analyses. Mixed-effects regression was carried out with the SAS MIXED procedure, with 0 as a lower bound on random variance estimates. In cases where the optimal estimate was on the boundary, we report variance as “negligible.”
Results
Patient population
Prenatal diagnosis, postnatal diagnosis, and outcome data are given in Table 1. There were 8 normal fetuses at prenatal imaging and 29 fetuses with isolated VM.
Table 1.
Prenatal diagnosis, postnatal diagnosis, and outcome.
| Postnatal outcome | ||||||
|---|---|---|---|---|---|---|
| Prenatal diagnosis (US and MRI) | N | Normal | Isolated VM | VM + other findings | Terminated or lost to follow-up | Other |
| Normal | 8 | 7 | 1 | |||
| Isolated VM | 29 | |||||
| 10.0 -12.0 | (22) | 11 | 4 | 1 porencephaly | 3 | 1 neonatal death; 1 eye gaze abnormality, 1 trisomy |
| 12.1- 15.0 | (4) | 2 | 1 | 1 premature birth | ||
| > 15.1 | (3) | 1 | 1 porencephaly | 1 | ||
| VM + corpus callosum pathology | 5 | 3 ACC/1 with abnormal gyral pattern | 1 | |||
| VM + cerebellar pathology | 2 | 2 | ||||
| VM + abnormal migration | 2 | 2 | ||||
| VM + hemorrhage | 3 | 1 | 1 porencephaly | 1 | ||
| Holoprosencephaly | 1 | 1 holoprosencephaly | ||||
| Total | 50 | 20 | 6 | 8 | 12 | 4 |
Volumes with respect to gestational age
Gestational age by dates ranged from 17 weeks to 36 weeks and 5 days. The dependence of fetal brain volume measurements on GA is detailed in Table 2 and illustrated in Figures 3-5. Supratentorial parenchymal volumes ranged from 1.6 to 291 cc and was 16% higher for every additional week of GA as measured by either dates or ultrasound variables (p<0.0001). Ventricular volumes ranged from 1.9 to 74 cc and increased by 4% per week, a statistically significant rate (p<0.005), though slower than parenchyma. Cerebellar volume and extra-axial CSF increased with respect to GA at rates comparable to parenchyma, 15% and 12% per week, respectively (p<0.0001).
Table 2.
Increase of fetal brain volume measurements with gestational age by dates and biometry.
| Measure | Increase /wk, %* | Power-law exponent* | ||
|---|---|---|---|---|
| GA (dates) | GA (US) | BPD | HC | |
| Supratentorial parenchyma | 16.5 | 16.0 | 2.7 | 3.4 |
| Ventricles | 4.2 | 3.7 | 0.6 | 0.6 |
| Extra-axial cerebrospinal fluid | 12.6 | 11.9 | 2.2 | 2.8 |
|
| ||||
| Cerebellum: overall | 15.8 | 15.2 | 2.5 | 3.2 |
| axial | 14.4 | 13.8 | 2.3 | 2.9 |
| coronal | 15.9 | 15.1 | 2.5 | 3.2 |
| sagittal | 17.1 | 16.6 | 2.8 | 3.5 |
From mixed-model analysis of variance; see Methods for details. All rates and exponents differ significantly from zero, p<0.05. All were invariant across plane of observation, p>0.10, except for cerebellum, which by all measures increased more rapidly in sagittal plane, least in axial plane (p<0.01). HC= head circumference; GA= gestational age BPD=biparietal diameter
Figure 3.

Volume of supratentorial parenchyma was directly related to fetal GA as determined by ultrasound. A similar pattern was observed with GA determined by dates, BPD, and HC (see Table 2).
Figure 5.

Volume of cerebellum (including vermis) was directly related to fetal GA as determined by ultrasound (l.) and brain size as represented by BPD (r.). Rate of increase was comparable to that of parenchyma (Fig. 3) and varied significantly by plane of measurement. Similar patterns were observed with GA determined by dates or by brain size represented by HC (see Table 2).
Parenchymal volume increased in proportion to the 2.7 power of BPD (p<0.0001), whereas ventricular volume increased only as the 0.6 power (p<0.03). Cerebellar volume and extra-axial CSF increased similarly to parenchyma, in proportion to the 2.5 and 2.2 power respectively (p<0.0001). Similar results were obtained for rates of increase with respect to HC.
Two versus three dimensional measurements
There was a moderately strong and significant positive correlation between ventricular volumes and ventricular diameter at the left and right atrium (Spearman r=0.62, adjusted for ultrasound GA), with lesser (r=0.42−.43) but still significant correlations at the left and right frontal horn (all p<0.0001).
Inter- and intra-observer variability
Inter-observer agreement was excellent, with 3% standard deviation between the two raters for measurements of parenchyma, 6% for ventricles, 4% for extra-axial CSF, and negligible variation for cerebellum (Table 3). Still less variability was seen for the two measurements on different occasions by a single rater: 4% for extra-axial CSF and the other variables studied being negligible. The overall reliability of measurement was best for ventricular volume (ICC=0.86) and poorest for cerebellum (ICC=0.34).
Table 3.
Patient and rater variability in MR measurement of fetal brain volumes.
| Measure | Standard deviation (%)* | ||||
|---|---|---|---|---|---|
| Among subjects | Between raters | Between occasions, 1 rater | Residual | ICC† | |
| Supratentorial parenchyma | 38 | 3 | 0 | 21 | 0.74 |
| Ventricles | 68 | 6 | 0 | 22 | 0.86 |
| Cerebellum | 22 | 0 | 0 | 32 | 0.34 |
| Extra-axial cerebrospinal fluid | 71 | 4 | 4 | 38 | 0.73 |
Standard deviation, from mixed-model analysis of variance adjusted for plane of observation and GA (by US); see Methods for details.
Intraclass correlation coefficient (ICC), defined as patient (“true”) variance as a fraction of total variance (“true” + measurement error). Higher value (nearer 1.0) indicates more reliable measurement.
Image plane
The measured volumes (p>0.10) and inter-observer variation (interaction variance negligible) did not differ systematically by plane of observation. Supratentorial parenchymal and ventricular volumes were proportionately larger with larger GA, HC and BPD, with variations in size being similar in all three planes (p>0.10).
The sole influence of imaging plane that we observed was in cerebellar volume, which showed more rapid increase in the sagittal plane with respect to all four dating measures – GA by LMP or ultrasound, BPD, and HC – than in the coronal or axial plane (p<0.01). The difference in rates had the effect of making sagittal measures consistently highest and axial measures lowest at late GA, whereas the reverse order held at low GA (Fig. 5).
Volumes and outcomes
Table 4 shows the differences in parenchymal volume, ventricular volume, and ventricular percentage and preliminary neonatal outcomes using two different definitions of mild VM (10-12 mm and 10-15 mm). When adjusting for GA, image plane, rater, and patient variability, there were significant differences in the test groups. However, when comparing only the 10-12 mm groups with normal and abnormal outcomes, no significant difference was found in any of the three measurements. When comparing the groups using mild VM of 10-15 mm, a difference was found when comparing ventricular volumes (p = 0.002) and ventricular/parenchymal ratio (p = .001). Figure 6 and 7 illustrate the parenchymal and ventricular volumes with respect to GA in these groups.
Table 4.
Differences in MR measurement of fetal brain volume according to prenatal diagnosis and preliminary neonatal outcome using using 2 different definitions of mild VM
| Parenchymal volume | Ventricular volume | Ventricular percentage** | |||||
|---|---|---|---|---|---|---|---|
| Prenatal diagnosis/outcome | n | Mean (cc)* | p | Mean (cc)* | p | Mean | p |
| Using 10-12 mm as definition of mild VM | |||||||
|
| |||||||
| Normal | 8 | 70.6 | 0.05† | 5.4 | <0.001† | 5.4 | <0.001† |
| Mild VM (10-12 mm), normal outcome | 15 | 61.3 | >0.30‡ | 8.4 | >0.80‡ | 9.5 | >0.50‡ |
| Mild VM (10-12 mm), abnormal outcome | 7 | 57.2 | 8.6 | 9.8 | |||
| Using 10-15 mm as definition of mild VM | |||||||
| Normal | 8 | 76.2 | 0.04† | 5.5 | <0.0001† | 6.7 | <0.0001† |
| Mild VM (10-15 mm), normal outcome | 22 | 64.8 | >0.10‡ | 8.9 | 0.002‡ | 11,8 | 0.001‡ |
| All other | 19 | 55.7 | 13.6 | 18.2 | |||
Averaged over raters and planes of observation, and adjusted to mean gestational age of the three groups being compared.
Ventricular percentage is the ratio of ventricular/(ventricular + parenchymal) volume
Comparing all three groups.
Comparing latter two groups.
Figure 6.

Parenchymal volume measured by MR, grouped by prenatal diagnosis and preliminary neonatal outcome.
 normal outcome; + − − − − mild isolated VM 10-15 mm prenatal diagnosis with either normal outcome or isolated mild VM; ▾ ·········· all other VM cases. For illustration each point represents an average over all 3 planes and 2 raters; the analysis was performed on individual data points.
Figure 7.

Ventricular volume measured by MR, grouped by prenatal diagnosis and preliminary neonatal outcome.
normal outcome; + − − − − mild isolated VM 10-15 mm prenatal diagnosis with either normal outcome or isolated mild VM; ▾ ·········· all other VM cases. For illustration each point represents an average over all 3 planes and 2 raters; the analysis was performed on individual data points.
Time for measurement
Total time to obtain all the volumetric data varied from 20 to 80 min (mean ± SD 62.6 ± 13.8 minutes). When divided by the number of image planes obtained, time required for the volume measurements ranged from 15.7 to 35.0 minutes for each plane of observation (mean ± SD 23.0 ± 3.0 min). The time was mildly correlated with GA (Pearson r=0.3, p=0.05).
Discussion
Counseling women with pregnancies affected by fetal ventriculomegaly is difficult due to the wide range of reported outcomes. While outcomes are best when ventriculomegaly is isolated, and when the atrial diameter measures less than 12 mm, it would be helpful to have other morphologic indices to improve our counseling. One potential area where MR can add additional information beyond that available with ultrasound and beyond 2D characterization of associated abnormalities, is in precise volume measurements, not just of the parenchyma, but also of the ventricles.
There have been many published manuscripts on the use of volumetry for assessment of fetal lungs using ultrasound [17, 26-28] and MRI [17, 29-33]. However, there has been less attention given to brain volumetry. In a study of postmortem fetuses by Kinoshita et al [34] the maximum volume of the ventricles was 2.6 cc at 23 weeks. We found a similar volume early in gestation, ranging from 1.9 cc in our in vivo population. Our maximum ventricular volume was 74 cc, much greater than that reported by Kinoshita, which is expected given our ventriculomegaly population. In a preliminary report of 3D modeling of the fetal brain Schierlitz et al assessed 8 fetuses for brain morphology and ventricular volume measurements [35]. However, ventricular volumes were not given for comparison.
Our study has shown that volumetry of the parenchyma and ventricles in fetuses referred for VM can be performed in a reliable manner, since inter- and intra-observer variability are low.
One limitation of this study was the length of time required to perform the manual tracings. It should be noted that this time includes evaluation of extraaxial CSF space and cerebellar volumes that would not necessarily be performed in volumetry to predict outcome in the future. As software enhancement of semi-automatic tools for aid in tracings are developed the time to perform volumetry should also decrease. In addition, an important finding in this study is that the effect of image plane is negligible. This means that if volumetry is to be performed, time can be saved by performing it in a single image plane, utilizing the plane with the least motion.
It is important to recognize that volumetry of the cerebellum does vary with image plane. This is likely due to the small size of the cerebellum, and the fact that motion of the fetus between image acquisitions can lead to under or overestimates of volume.
The potential for accurate supratentorial volumes obtained in any image plane also has important consequences for scanning time in the magnet. If diagnostic information is obtained on sequences obscured by motion, as long as one sequence in a fetal examination has relatively little motion, then volumetry can be performed. In our study, the images were monitored by a radiologist interested in ensuring that diagnostic information was obtained, but without regard for the performance of volumetry. In this small series, at least one sequence was suitable for volumetry in every case. There is potential in the future that if volumetry becomes a standard method of evaluation that more attention will need to be paid to motion artifact, or that lower resolution, faster sequences will be needed.
A second limitation of our study was limited outcome data. This was intentional, as we are currently following a large cohort of fetuses with VM with standardized neurologic and psychologic testing. The current manuscript is meant to elucidate the methodology for performing fetal volumetry. We have shown that there is a low inter- and intra-observer variability, and that only a single image plane needs to be utilized. Even with the limited neonatal outcomes assessed in this study we have shown a difference in parenchymal and ventricular volumetry between normal fetuses and those with VM. We have also shown a significant difference in ventricular volumes in fetuses with VM compared to those with normal (or isolated VM) postnatal diagnosis and those with abnormal outcomes. Being able to show these differences in such a small cohort, suggests that quantitative data from the MR might be useful in formal outcomes analysis in large cohorts in the future.
Use of a standardized comprehensive method of evaluation is needed to correlate degree of VM, age at diagnosis, and associated findings with postnatal development. Parenchymal and ventricular volumetry are tools that may aid in this process. Further studies are needed to correlate longer term outcomes with these findings.
Figure 4.

Volume of ventricles was directly related to fetal GA as determined by ultrasound but increased less rapidly than parenchymal volume (Fig. 3). A similar pattern was observed with GA determined by dates, BPD and HC (see Table 2).
Acknowledgments
*This study was sponsored by NIH grant NIBIB01998
References
- 1.Patel MD, Filly AL, Hersh DR, Goldstein RB. Isolated mild fetal cerebral ventriculomegaly: clinical course and outcome. Radiology. 1994;192:759–764. doi: 10.1148/radiology.192.3.7520183. [DOI] [PubMed] [Google Scholar]
- 2.Cochrane DD, Myles ST, Nimrod C, Still DK, Sugarman RG, Wittmann BK. Intrauterine hydrocephalus and ventriculomegaly: associated anomalies and fetal outcome. Can J Neurol Sci. 1985;12:51–59. doi: 10.1017/s031716710004659x. [DOI] [PubMed] [Google Scholar]
- 3.Nyberg DA, Mack LA, Hirsch J, Pagon RO, Shepard TH. Fetal hydrocephalus: sonographic detection and clinical significance of associated anomalies. Radiology. 1987;163:187–191. doi: 10.1148/radiology.163.1.3547493. [DOI] [PubMed] [Google Scholar]
- 4.Chervenak FA, Duncan C, Ment LR, et al. Outcome of fetal ventriculomegaly. Lancet. 1984;2:179–181. doi: 10.1016/s0140-6736(84)90477-x. [DOI] [PubMed] [Google Scholar]
- 5.Pretorius DH, Davis K, Manco-Johnson ML, Manchester D, Meier PR, Clewell WH. Clinical course of fetal hydrocephalus: 40 cases. AJR Am J Roentgenol. 1985;144:827–831. doi: 10.2214/ajr.144.4.827. [DOI] [PubMed] [Google Scholar]
- 6.Cardoza JD, Goldstein RB, Filly RA. Exclusion of fetal ventriculomegaly with a single measurement: the width of the lateral ventricular atrium. Radiology. 1988;169:711–714. doi: 10.1148/radiology.169.3.3055034. [DOI] [PubMed] [Google Scholar]
- 7.Vintzileos AM, Campbell WA, Weinbaum PJ, Nochimson DJ. Perinatal management and outcome of fetal ventriculomegaly. Obstet Gynecol. 1987;69:5–11. [PubMed] [Google Scholar]
- 8.Hudgins RJ, Edwards MS, Goldstein RB, et al. Natural history of fetal ventriculomegaly. Pediatrics. 1988;82:692–697. [PubMed] [Google Scholar]
- 9.Drugan A, Krause B, Canady A, Zador IE, Sacks AJ, Evans MI. The natural history of prenatally diagnosed cerebral ventriculomegaly. J Am Med Asso. 1989;261:1785–1788. [PubMed] [Google Scholar]
- 10.Nicolaides KH, Berry S, Snijders RJ, Thorpe-Beeston JG, Gosden C. Fetal lateral cerebral ventriculomegaly: associated malformations and chromosomal defects. Fetal Diagn Ther. 1990;5:5–14. doi: 10.1159/000263529. [DOI] [PubMed] [Google Scholar]
- 11.Mahony BS, Nyberg DA, Hirsch JH, Petty CN, Hendricks SK, Mack LA. Mild idiopathic lateral cerebral ventricular dilatation in utero: sonographic evaluation. Radiology. 1988;169:715–721. doi: 10.1148/radiology.169.3.3055035. [DOI] [PubMed] [Google Scholar]
- 12.Filly RA, Goldstein RB. The fetal ventricular atrium: fourth down and 10 mm to go. Radiology. 1994;193:315–317. doi: 10.1148/radiology.193.2.7972733. [DOI] [PubMed] [Google Scholar]
- 13.Levine D, Barnes PD, Robertson RR, Wong G, Mehta TS. Fast MR imaging of fetal central nervous system abnormalities. Radiology. 2003;229:51–61. doi: 10.1148/radiol.2291020770. [DOI] [PubMed] [Google Scholar]
- 14.Levine D, Barnes PD, Madsen JR, Li W, Edelman RR. Fetal central nervous system anomalies: MR imaging augments sonographic diagnosis. Radiology. 1997;204:635–642. doi: 10.1148/radiology.204.3.9280237. [DOI] [PubMed] [Google Scholar]
- 15.Thickman D, Mintz M, Mennuti M, Kressel HY. MR imaging of cerebral abnormalities in utero. J Comput Assist Tomogr. 1984;8:1058–1061. doi: 10.1097/00004728-198412000-00003. [DOI] [PubMed] [Google Scholar]
- 16.Rypens F, Metens T, Rocourt N, et al. Fetal lung volume: estimation at MR imaging-initial results. Radiology. 2001;219:236–241. doi: 10.1148/radiology.219.1.r01ap18236. [DOI] [PubMed] [Google Scholar]
- 17.Ruano R, Joubin L, Sonigo P, et al. Fetal lung volume estimated by 3-dimensional ultrasonography and magnetic resonance imaging in cases with isolated congenital diaphragmatic hernia. J Ultrasound Med. 2004;23:353–358. doi: 10.7863/jum.2004.23.3.353. [DOI] [PubMed] [Google Scholar]
- 18.Kubik-Huch RA, Huisman TA, Wisser J, et al. Ultrafast MR imaging of the fetus. AJR Am J Roentgenol. 2000;174:1599–1606. doi: 10.2214/ajr.174.6.1741599. [DOI] [PubMed] [Google Scholar]
- 19.Wilhelm C, Keck C, Hess S, Korinthenberg R, Breckwoldt M. Ventriculomegaly diagnosed by prenatal ultrasound and mental development of the children. Fetal Diagn Ther. 1998;13:162–166. doi: 10.1159/000020830. [DOI] [PubMed] [Google Scholar]
- 20.Oi S, Honda Y, Hidaka M, Sato O, Matsumoto S. Intrauterine high-resolution magnetic resonance imaging in fetal hydrocephalus and prenatal estimation of postnatal outcomes with “perspective classification”. J Neurosurg. 1998;88:685–694. doi: 10.3171/jns.1998.88.4.0685. [DOI] [PubMed] [Google Scholar]
- 21.Gaglioti P, Danelon D, Bontempo S, Mombro M, Cardaropoli S, Todros T. Fetal cerebral ventriculomegaly: outcome in 176 cases. Ultrasound Obstet Gynecol. 2005;25:372–377. doi: 10.1002/uog.1857. [DOI] [PubMed] [Google Scholar]
- 22.Mercier A, Eurin D, Mercier PY, Verspyck E, Marpeau L, Marret S. Isolated mild fetal cerebral ventriculomegaly: a retrospective analysis of 26 cases. Prenat Diagn. 2001;21:589–595. doi: 10.1002/pd.88. [DOI] [PubMed] [Google Scholar]
- 23.Bloom SL, Bloom DD, Dellanebbia C, Martin LB, Lucas MJ, Twickler DM. The developmental outcome of children with antenatal mild isolated ventriculomegaly. Obstet Gynecol. 1997;90:93–97. doi: 10.1016/S0029-7844(97)00112-9. [DOI] [PubMed] [Google Scholar]
- 24.Vergani P, Locatelli A, Strobelt N, et al. Clinical outcome of mild fetal ventriculomegaly. Am J Obstet Gynecol. 1998;178:218–222. doi: 10.1016/s0002-9378(98)80003-3. [DOI] [PubMed] [Google Scholar]
- 25.Hadlock FP, Deter RL, Harrist RB, Park SK. Estimating fetal age: computer-assisted analysis of multiple fetal growth parameters. Radiology. 1984;152:497–501. doi: 10.1148/radiology.152.2.6739822. [DOI] [PubMed] [Google Scholar]
- 26.D'Arcy TJ, Hughes SW, Chiu WS, et al. Estimation of fetal lung volume using enhanced 3-dimensional ultrasound: a new method and first result. Br J Obstet Gynaecol. 1996;103:1015–1020. doi: 10.1111/j.1471-0528.1996.tb09553.x. [DOI] [PubMed] [Google Scholar]
- 27.Ruano R, Benachi A, Joubin L, et al. Three-dimensional ultrasonographic assessment of fetal lung volume as prognostic factor in isolated congenital diaphragmatic hernia. Bjog. 2004;111:423–429. doi: 10.1111/j.1471-0528.2004.00100.x. [DOI] [PubMed] [Google Scholar]
- 28.Moeglin D, Talmant C, Duyme M, Lopez AC. Fetal lung volumetry using two-and three-dimensional ultrasound. Ultrasound Obstet Gynecol. 2005;25:119–127. doi: 10.1002/uog.1799. [DOI] [PubMed] [Google Scholar]
- 29.Peralta CF, Kazan-Tannus JF, Bunduki V, et al. Evaluation of the Agreement Between 3-Dimensional Ultrasonography and Magnetic Resonance Imaging for Fetal Lung Volume Measurement. J Ultrasound Med. 2006;25:461–467. doi: 10.7863/jum.2006.25.4.461. [DOI] [PubMed] [Google Scholar]
- 30.Zaretsky M, Ramus R, McIntire D, Magee K, Twickler DM. MRI calculation of lung volumes to predict outcome in fetuses with genitourinary abnormalities. AJR Am J Roentgenol. 2005;185:1328–1334. doi: 10.2214/AJR.04.1536. [DOI] [PubMed] [Google Scholar]
- 31.Paek BW, Coakley FV, Lu Y, et al. Congenital diaphragmatic hernia: prenatal evaluation with MR lung volumetry--preliminary experience. Radiology. 2001;220:63–67. doi: 10.1148/radiology.220.1.r01jl4163. [DOI] [PubMed] [Google Scholar]
- 32.Baker PN, Johnson IR, Gowland PA, Freeman A, Adams V, Mansfield P. Estimation of fetal lung volume using echo-planar magnetic resonance imaging. Obstet Gynecol. 1994;83:951–954. doi: 10.1097/00006250-199406000-00010. [DOI] [PubMed] [Google Scholar]
- 33.Williams G, Coakley FV, Qayyum A, Farmer DL, Joe BN, Filly RA. Fetal Relative Lung Volume: Quantification by Using Prenatal MR Imaging Lung Volumetry. Radiology. 2004;233:457–462. doi: 10.1148/radiol.2332031566. [DOI] [PubMed] [Google Scholar]
- 34.Kinoshita Y, Okudera T, Tsuru E, Yokota A. Volumetric analysis of the germinal matrix and lateral ventricles performed using MR images of postmortem fetuses. AJNR Am J Neuroradiol. 2001;22:382–388. [PMC free article] [PubMed] [Google Scholar]
- 35.Schierlitz L, Dumanli H, Robinson JN, et al. Three-dimensional magnetic resonance imaging of fetal brains. Lancet. 2001;357:1177–1178. doi: 10.1016/S0140-6736(00)04375-0. [DOI] [PubMed] [Google Scholar]